

 |
市場調查報告書
商品編碼
2125465
日本容器玻璃市場:市場佔有率分析、產業趨勢與統計及成長預測(2026-2031)Japan Container Glass - Market Share Analysis, Industry Trends & Statistics, Growth Forecasts (2026 - 2031) |
||||||

※ 本網頁內容可能與最新版本有所差異。詳細情況請與我們聯繫。
根據 Mordor Intelligence 預測,日本玻璃容器市場規模將從 2025 年的 143 萬噸成長到 2026 年的 146 萬噸,然後從 2026 年到 2031 年以 2.37% 的複合年成長率成長,到 2031 年達到 165 萬噸。
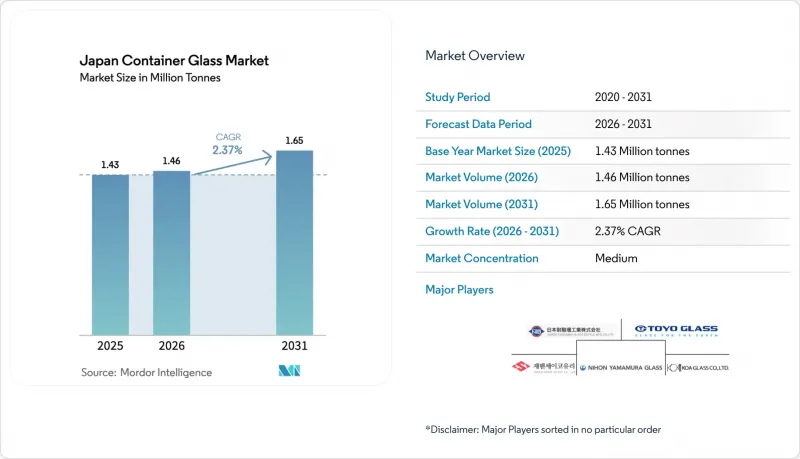
本報告按最終用戶(飲料[酒精飲料(啤酒、葡萄酒、烈酒及其他酒精飲料)和非酒精飲料(碳酸飲料、乳製品飲料等)]、食品[果醬、果凍等]、化妝品和個人護理用品、藥品、香水)、顏色(綠色、琥珀色、燧石色及其他顏色)和地區(日本)進行細分。市場預測以噸為單位。
日本玻璃容器市場趨勢及洞察。
環境永續性和監管支持
日本玻璃製造商正受益於一系列政策,這些政策將玻璃定位為最具循環利用性的硬質包裝材料。 「玻璃瓶回收標誌」系統提高了玻璃屑的回收率,而新推出的 PFAS 法規則則強調了玻璃在食品接觸環境中的惰性。全國範圍內的減廢棄物目標鼓勵零售商規定最低再生材料含量,而玻璃完全可以在不影響品質的前提下達到這一標準。節能法規也推動了熔爐維修項目,這些項目整合了電力增壓技術,降低了整體燃料消耗強度,並有助於獲得碳價信用額度。公眾輿論支持減少塑膠廢棄物,這推動了持續的需求,並保護了日本玻璃容器市場免受敏感類別中聚合物替代的影響。
高階品牌和產品差異化
品牌擁有者利用玻璃的觸感和視覺特性來證明其在貨架上的高價合理性。精釀軟性飲料製造商Hatakosen在停產30年後重新推出了全玻璃「彈珠汽水」瓶,利用懷舊情懷和感官體驗,使其每箱售價高達7,776日圓(約53.70美元)。在化妝品產業,小批量生產的玻璃瓶能夠實現精細的壓紋和噴色效果,這是大規模生產的塑膠製品無法複製的。啤酒製造商堅持為銷往海外市場的旗艦啤酒使用厚重的玻璃瓶,因為出口商認知到玻璃瓶與「真實性」的認知之間存在直接聯繫。這種設計自由有利於那些承接小批量、高利潤訂單的專業製造商,助長了市場兩極化的競爭格局。
高昂的能源成本和生產成本
燃料和電力成本佔熔爐運作成本的三分之一以上。自2022年以來,天然氣進口價格飆升,日圓貶值導致堿灰和添加劑成本上漲,擠壓了通用玻璃瓶生產線的利潤空間。維修熔爐以採用氧氣燃料和電力輔助技術需要高達4億美元的資本投資,這將延長投資回收期。儘管一些製造商正在測試氫燃料,但供應鏈規模仍然有限,碳定價的抵銷作用尚未完全彌補燃料成本的飆升。這些趨勢正在對短期盈利構成壓力,並可能減緩日本容器玻璃市場產能的擴張。
細分市場分析
到2025年,飲料業將佔日本玻璃容器市場佔有率的59.02%,這表明既定的飲酒習慣和出口需求支撐著玻璃容器的銷售成長。酒精飲料品牌仍偏好玻璃瓶,因為玻璃瓶對風味的影響最小,能帶來高階、厚實的質感;而即飲雞尾酒和精釀蘇打水則採用定製瓶,強調視覺敘事。雖然一些主流非酒精飲料產品線正在轉向PET材質,但小規模手工生產商透過選擇玻璃瓶來彌補這一缺口,以傳遞傳統和真實感。醫藥產業的需求保持穩定,因為注射劑和維生素溶液需要惰性且不透水的初級容器。化妝品和個人護理行業正以3.18%的複合年成長率成長,這主要得益於消費者願意為可重複使用的玻璃瓶買單,因為玻璃瓶既能提升浴室美感,又能減少塑膠廢棄物。食品應用領域則分為兩類:一類是高階調味品,透明材質能提升品質感;另一類是通用醬料,這類產品主要依賴塑膠來降低運輸成本。雖然香水產業是一個小眾市場,但它能帶來很高的利潤率,因為品牌所有者追求的是只有玻璃才能實現的複雜形狀和色彩效果。
儘管飲料業依然主導,確保了基本負載爐的運轉率,但利潤成長正轉向細分領域。化妝品配方開發商擴大指定使用彩色噴塗、電鍍和細頸瓶等工藝,而小規模製造商可以利用靈活的模具提供這些工藝。製藥供應商維持最高的無塵室標準,並生產關鍵產品,例如I型硼矽酸管瓶,其價格高於標準的鈉鈣玻璃瓶。面向出口的啤酒和清酒釀造廠正在將傳統的瓶型與輕量化結構相結合,即使在以大規模生產為中心的品類中,也體現了對材料減量的關注。因此,日本玻璃容器市場正從單一細分市場的巨頭市場演變為一個需求多元化的市場,在穩定的銷售量和高收入之間取得平衡。
其他好處:
- Excel格式的市場預測(ME)表
- 3個月的分析師支持
目錄
第1章:引言
- 研究假設和市場定義
- 調查範圍
第2章:調查方法
第3章執行摘要
第4章 市場狀況
- 市場概覽
- 市場促進因素
- 環境永續性和監管支持
- 高階品牌和產品差異化
- 飲料和酒精飲料領域成長強勁。
- 醫藥和個人護理行業的需求不斷成長。
- 玻璃製造技術的進步
- 玻璃製造技術的進步
- 市場限制因素
- 高昂的能源成本和生產成本
- 其他包裝材料的激烈競爭
- 搬運和運輸過程中損壞的風險
- 供應鏈脆弱性與原料供應限制
- PESTLE分析
- 產業價值鏈分析
- 日本容器用玻璃熔爐的生產能力和位置
- 工廠位置及投產年份
- 生產能力
- 爐子的種類
- 玻璃的顏色
- 貨櫃玻璃進出口資料-涵蓋主要進出口目的地。
- 2021年至2024年進口量及進口額
- 2021年至2024年出口量及出口額
- 波特五力分析
- 原料分析
- 玻璃包裝回收趨勢
- 玻璃包裝供需分析
第5章 市場規模與成長預測
- 最終用戶
- 飲料
- 酒精飲料
- 啤酒
- 葡萄酒
- 烈酒
- 其他酒精飲料(蘋果酒和其他發酵飲料)
- 非酒精性
- 汁
- 碳酸飲料(CSD)
- 乳製品飲料
- 其他非酒精飲料
- 酒精飲料
- 食品(果醬、果凍、橘子醬、蜂蜜、香腸和調味品、食用油、醃菜)
- 化妝品和個人護理
- 藥品(不包括管瓶和安瓿)
- 香水
- 飲料
- 按顏色
- 綠色的
- 琥珀色
- 燧石
- 其他顏色
第6章 競爭情勢
- 市場集中度
- 策略舉措和趨勢
- 各公司企業市場占有率分析(基於最新產能)
- 公司簡介
- Toyo Glass Co., Ltd.(Part of Toyo Seikan Group Holdings Ltd)
- Nihon Yamamura Glass Co., Ltd.
- Japan Seiko Glass Co., Ltd.
- KOA Glass Co., Ltd.
- Ishizuka Glass Co., Ltd.
- Nipro Corporation
- Nihon Taisanbin Glass Bottle MFG Co., Ltd.
- Okubo Glass Co., Ltd.
- DAI-ICHI GLASS CO., LTD.
- DAISHO GLASS Co., Ltd.
- Takemoto Yohki Co., Ltd.
第7章 市場機會與未來展望
According to Mordor Intelligence, the Japan container glass market size is expected to grow from 1.43 million tonnes in 2025 to 1.46 million tonnes in 2026 and is forecast to reach 1.65 million tonnes by 2031 at 2.37% CAGR over 2026-2031.
This report is Segmented by End-User (Beverages [Alcoholic {Beer, Wine, Spirits, Other Alcoholic Beverages}, and Non-Alcoholic {CSDs, Dairy Product Based Drinks, and More}], Food [Jam and Jelly, and More], Cosmetics and Personal Care, Pharmaceuticals, and Perfumery), Color (Green, Amber, Flint, and Other Colors), and Geography (Japan). The Market Forecasts are Provided in Terms of Volume (Tonnes).
Japan Container Glass Market Trends and Insights
Environmental Sustainability and Regulatory Support
Japan's glass producers benefit from a policy mix that elevates glass as the most circular rigid-packaging substrate. The Glass Bottle Recycling Mark scheme grows cullet recovery rates, and emerging PFAS controls accentuate glass's inert nature in food contact settings. Nationwide waste-reduction targets encourage retailers to specify minimum recycled-content thresholds that glass can meet without quality loss. Energy-conservation mandates also incentivize furnace-rebuild projects that integrate electrical boosting, which cuts overall fuel intensity and unlocks carbon-price credits. Public sentiment favors plastic-waste reduction, creating an enduring demand pull that cushions the Japan Container Glass market against polymer substitution in sensitive categories.
Premium Branding and Product Differentiation
Brand owners leverage the tactile and visual cues of glass to justify premium shelf prices. Craft soft-drink maker Hata Kosen revived its all-glass Ramune bottle after a 30-year hiatus, capitalizing on nostalgia and sensory ritual to command case prices of JPY 7,776 (USD 53.7). In cosmetics, small-batch glass jars enable intricate embossing and color-spray effects that mass-market plastics cannot replicate at low volumes. Breweries maintain heavy glass formats for flagship beers abroad because exporters note a direct link between glass bottling and perceived authenticity. The design latitude benefits specialty converters that offer limited-run, high-margin orders, supporting a bifurcated competitive landscape.
High Energy and Production Costs
Fuel and electricity account for more than one-third of furnace operating expenses. Natural-gas import prices spiked after 2022, and a weak yen inflated soda-ash and additive costs, compressing margins for commodity bottle lines. Furnace rebuilds that integrate oxy-fuel or electric-boosting technology demand capex outlays that can reach USD 400 million, prolonging payback horizons. Although some producers test hydrogen blends, supply-chain scale remains limited, and carbon-price offsets have yet to fully compensate higher fuel bills. These dynamics weigh on near-term profitability and could slow capacity additions within the Japan Container Glass market.
Other drivers and restraints analyzed in the detailed report include:
- Robust Growth in Beverage and Alcoholic Drink Segments
- Rising Demand in Pharmaceuticals and Personal Care
- Intense Competition from Substitute Packaging Materials
For complete list of drivers and restraints, kindly check the Table Of Contents.
Segment Analysis
The beverages domain occupied 59.02% of the Japan Container Glass market share in 2025, illustrating how entrenched drinking rituals and export ambitions underpin bulk volumes. Alcoholic brands continue to favor glass for flavor neutrality and premium heft, while ready-to-drink cocktails and craft sodas adopt custom bottles that amplify visual storytelling. Non-alcoholic mainstream lines have partly migrated to PET, yet smaller artisanal players counterbalance this slide by choosing glass to convey heritage and authenticity. Pharmaceutical demand remains steady because injectable drugs and vita-liquids require inert, impermeable primary containers. Cosmetics and personal care advance at a 3.18% CAGR, propelled by consumer willingness to pay for refillable glass jars that enhance bathroom aesthetics and reduce plastic waste. Food applications are split between premium condiments, where transparency reinforces quality cues, and commodity sauces that lean on plastic to save on transport costs. Perfumery, although niche, adds high-margin tonnage because brand owners demand complex shapes and color effects that only glass can sustain.
Continued beverage dominance ensures base-load furnace utilization, yet margin growth shifts toward specialty segments. Cosmetics formulators increasingly specify color-spray coatings, electroplated finishes, and low-profile neck finishes that smaller converters can deliver with agile tooling. Pharmaceutical suppliers uphold top-tier clean-room standards and hero products such as Type I borosilicate vials, which carry price premiums over standard soda-lime bottles. Export-oriented brewers and sake producers blend traditional bottle silhouettes with lightweight structures, showing that even volume-centric categories aim for material reduction. The Japan Container Glass market therefore evolves from a single-segment powerhouse toward a diversified demand portfolio that balances volume stability with premium revenue streams.
Complete Report Scope:
- By End-user
- Beverages
- Alcoholic
- Beer
- Wine
- Spirits
- Other Alcoholic Beverages (Cider and Other Fermented Drinks)
- Non-Alcoholic
- Juices
- Carbonated Drinks (CSDs)
- Dairy Product Based Drinks
- Other Non-Alcoholic Beverages
- Alcoholic
- Food (Jam, Jelly, Marmalades, Honey, Sausages and Condiments, Oil, Pickles)
- Cosmetics and Personal Care
- Pharmaceuticals (excluding Vials and Ampoules)
- Perfumery
- Beverages
- By Color
- Green
- Amber
- Flint
- Other Colors
List of Companies Covered in this Report:
- Toyo Glass Co., Ltd. (Part of Toyo Seikan Group Holdings Ltd)
- Nihon Yamamura Glass Co., Ltd.
- Japan Seiko Glass Co., Ltd.
- KOA Glass Co., Ltd.
- Ishizuka Glass Co., Ltd.
- Nipro Corporation
- Nihon Taisanbin Glass Bottle MFG Co., Ltd.
- Okubo Glass Co., Ltd.
- DAI-ICHI GLASS CO., LTD.
- DAISHO GLASS Co., Ltd.
- Takemoto Yohki Co., Ltd.
Additional Benefits:
- The market estimate (ME) sheet in Excel format
- 3 months of analyst support
TABLE OF CONTENTS
1 INTRODUCTION
- 1.1 Study Assumptions and Market Definition
- 1.2 Scope of the Study
2 RESEARCH METHODOLOGY
3 EXECUTIVE SUMMARY
4 MARKET LANDSCAPE
- 4.1 Market Overview
- 4.2 Market Drivers
- 4.2.1 Environmental Sustainability and Regulatory Support
- 4.2.2 Premium Branding and Product Differentiation
- 4.2.3 Robust Growth in Beverage and Alcoholic Drink Segments
- 4.2.4 Rising Demand in Pharmaceuticals and Personal Care
- 4.2.5 Technological Advancements in Glass Manufacturing
- 4.2.6 Technological Advancements in Glass Manufacturing
- 4.3 Market Restraints
- 4.3.1 High Energy and Production Costs
- 4.3.2 Intense Competition from Substitute Packaging Materials
- 4.3.3 Fragility and Risk of Breakage During Handling and Transport
- 4.3.4 Supply Chain Vulnerabilities and Raw Material Constraints
- 4.4 PESTEL Analysis
- 4.5 Industry Value Chain Analysis
- 4.6 Container Glass Furnace Capacity and Locations in Japan
- 4.6.1 Plant Locations and Year of Commencement
- 4.6.2 Production Capacities
- 4.6.3 Types of Furnaces
- 4.6.4 Color of Glass Produced
- 4.7 Export-Import Data of Container Glass - Covering Key Import and Export Destinations
- 4.7.1 Import Volume and Value, 2021-2024
- 4.7.2 Export Volume and Value, 2021-2024
- 4.8 Porter's Five Forces Analysis
- 4.8.1 Threat of New Entrants
- 4.8.2 Bargaining Power of Suppliers
- 4.8.3 Bargaining Power of Buyers
- 4.8.4 Threat of Substitutes
- 4.8.5 Competitive Rivalry
- 4.9 Raw Material Analysis
- 4.10 Recycling Trends for Glass Packaging
- 4.11 Demand vs Supply Analysis for Glass Packaging
5 MARKET SIZE AND GROWTH FORECASTS (VOLUME)
- 5.1 By End-user
- 5.1.1 Beverages
- 5.1.1.1 Alcoholic
- 5.1.1.1.1 Beer
- 5.1.1.1.2 Wine
- 5.1.1.1.3 Spirits
- 5.1.1.1.4 Other Alcoholic Beverages (Cider and Other Fermented Drinks)
- 5.1.1.2 Non-Alcoholic
- 5.1.1.2.1 Juices
- 5.1.1.2.2 Carbonated Drinks (CSDs)
- 5.1.1.2.3 Dairy Product Based Drinks
- 5.1.1.2.4 Other Non-Alcoholic Beverages
- 5.1.1.1 Alcoholic
- 5.1.2 Food (Jam, Jelly, Marmalades, Honey, Sausages and Condiments, Oil, Pickles)
- 5.1.3 Cosmetics and Personal Care
- 5.1.4 Pharmaceuticals (excluding Vials and Ampoules)
- 5.1.5 Perfumery
- 5.1.1 Beverages
- 5.2 By Color
- 5.2.1 Green
- 5.2.2 Amber
- 5.2.3 Flint
- 5.2.4 Other Colors
6 COMPETITIVE LANDSCAPE
- 6.1 Market Concentration
- 6.2 Strategic Moves and Developments
- 6.3 Company Market Share Analysis, (Based on Latest Production Capacity)
- 6.4 Company Profiles (includes Global level Overview, Market level overview, Core Segments, Financials as available, Strategic Information, Market Rank/Share for key companies, Products and Services, and Recent Developments)
- 6.4.1 Toyo Glass Co., Ltd. (Part of Toyo Seikan Group Holdings Ltd)
- 6.4.2 Nihon Yamamura Glass Co., Ltd.
- 6.4.3 Japan Seiko Glass Co., Ltd.
- 6.4.4 KOA Glass Co., Ltd.
- 6.4.5 Ishizuka Glass Co., Ltd.
- 6.4.6 Nipro Corporation
- 6.4.7 Nihon Taisanbin Glass Bottle MFG Co., Ltd.
- 6.4.8 Okubo Glass Co., Ltd.
- 6.4.9 DAI-ICHI GLASS CO., LTD.
- 6.4.10 DAISHO GLASS Co., Ltd.
- 6.4.11 Takemoto Yohki Co., Ltd.
7 MARKET OPPORTUNITIES AND FUTURE OUTLOOK
- 7.1 White-space and Unmet-Need Assessment

 法國玻璃容器:市場佔有率分析、行業趨勢和統計數據以及成長預測(2026-2031 年)泰國容器玻璃:市場佔有率分析、產業趨勢與統計、成長預測(2026-2031)義大利容器玻璃:市場佔有率分析、產業趨勢與統計、成長預測(2026-2031)西班牙容器玻璃:市場佔有率分析、產業趨勢與統計、成長預測(2026-2031)印度容器用玻璃器皿:市場佔有率分析、產業趨勢與統計、成長預測(2026-2031)
 玻璃器皿市場-2026-2032年全球市場預測
 玻璃器皿市場規模、佔有率、成長和行業分析:按玻璃類型、成型方法、應用和地區分類,並預測至2034年
 玻璃器皿市場規模、佔有率和趨勢分析報告:按產品、應用、地區和細分市場分類(2026-2033 年)玻璃瓶市場:依材質、顏色、容量、應用及通路分類-2026-2032年全球市場預測
 酒精飲料瓶市場規模、佔有率和成長分析:按形狀、容量、材質、應用和地區分類-2026-2033年產業預測