


 |
市場調查報告書
商品編碼
2125289
交流電驅動:市場佔有率分析、產業趨勢與統計資料、成長預測(2026-2031 年)Alternating Current (AC) Electric Drives - Market Share Analysis, Industry Trends & Statistics, Growth Forecasts (2026 - 2031) |
||||||

※ 本網頁內容可能與最新版本有所差異。詳細情況請與我們聯繫。
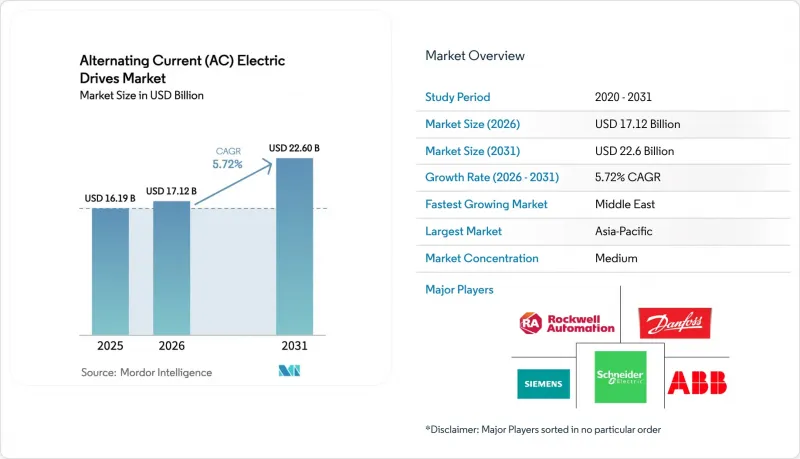
據 Mordor Intelligence 稱,2025 年交流電 (AC) 電動驅動市場價值為 161.9 億美元,預計從 2026 年的 171.2 億美元成長到 2031 年的 226 億美元。
預測期(2026-2031 年)的複合年成長率預計為 5.72%。
本報告依電壓(低壓、中壓及其他)、額定功率(1MW以下、1-3MW、3MW以上)、應用(泵浦、風扇、壓縮機及其他)、終端用戶產業(石油天然氣、化學及石化、食品飲料、水處理及污水處理及其他)及地區進行細分。市場預測以美元計價。
全球交流電機驅動市場趨勢及洞察
製造業自動化技術的進步
對智慧工廠的投資正在加速交流馬達驅動器的市場普及,因為企業主管將提高能源效率視為關鍵的成本節約因素。 2024年11月,ABB推出了ACS8080,這是一款中壓平台,運作效率高達98%,諧波失真降低50%。即使對風扇進行變速改造,也能降低高達30%的能耗,節省預算用於進一步的自動化升級。驅動器向工廠歷史資料庫傳輸的即時數據,透過預測性維護支援品管,並減少意外停機時間。中國、印度和印尼政府正透過稅額扣抵鼓勵採用機器人技術,從而擴大了現有設備基礎設施的適用範圍,使其能夠部署智慧駕駛。
政府監管日益嚴格,對節能設備的需求不斷成長
目前,全球約三分之二的馬達出貨量都受到最低能源效率標準的約束。歐盟的生態設計指令和美國能源局法規要求工廠證明其節能效果可量化,這使得交流電機驅動器在新生產線中的市場普及幾乎成為必然。預計到2050年,電力在最終能源消耗中的佔比將從2022年的29%上升至52%,因此,對所有馬達驅動系統的監管力度正在加大。此外,電力公司還為參與需量反應的企業提供激勵措施,而配備變速驅動器的工廠可以將靈活的負載能力轉化為收益。
高昂的初始安裝成本和維護成本
包括設計費、諧波濾波器組、冷卻系統升級和操作人員培訓在內的總實施成本,有時可達驅動器標價的兩到三倍。如果投資回收期超過兩個財政年度,中小企業可能會推遲專案。維修現有設備會因配電盤重新佈線和符合電能品質標準而進一步增加預算。服務團隊需要定期更換直流鏈路電容器和風扇組件,這對習慣更簡單啟動器的維護部門來說,將帶來前所未有的生命週期負擔。
細分市場分析
到2025年,低壓馬達將佔據最大佔有率,達到57.74%,因為大多數工業馬達的電壓將低於690V。然而,專案開發商正日益整合負載,並傾向於使用一台4MW電機而非四台1MW電機,以簡化維護。目前,在交流電機驅動市場,受石油化工、海水淡化和採礦項目中兆瓦級水泵投資不斷成長的推動,預計到2031年,中壓產品的市場價值將以7.52%的複合年成長率成長。 ACS8080的推出表明,由於其高功率密度和低諧波特性,即使在現有設施(棕地改造)中,這些驅動器也具有實用化。該地區的煉油廠正在採用6.6kV變頻器來減少輔助蒸氣渦輪系統,從而顯著降低製程熱排放,符合淨零排放藍圖的要求。
在亞太地區,本地配電盤製造商正將環路開關整合到中壓配電櫃中,以滿足承包工程總承包(EPC)競標。歐洲公司則憑藉整合式有源前端轉換器脫穎而出,這些轉換器符合嚴格的電網規範閃爍限制。同時,北美電力公司正在批准再生驅動配置,將煞車能量回饋到電網,實現電能品質提升所帶來的效益。這些趨勢表明,到本十年末,中壓產品將在電力消耗量產業中取代現有的低壓產品,這將是一個轉捩點。
由於食品、飲料和個人製造業的原始設備製造商 (OEM) 通常為輸送機和攪拌機指定標準化框架,因此 2025 年 1MW 以下的系統仍將佔出貨量的 47.10%。然而,在交流電驅動市場,3MW 以上設備的安裝量成長最為迅速,複合年成長率 (CAGR) 為 7.26%。這是因為氫氣電解裝置、浮體式液化天然氣運輸船和大規模碳捕集系統需要對大型壓縮機進行精確控制。最新的碳化矽 (SiC) 逆變器可在這些額定功率下實現超過 7kHz 的開關頻率,因此無需大型空調系統,因此可進行室內安裝並降低環境密封成本。
原始設備製造商 (OEM) 正在供應配備主動式磁軸承壓縮機的 5MW 驅動器,無需潤滑迴路,從而提高了工廠的運作。在金屬和採礦領域,以高功率變速驅動器取代液力耦合器可降低磨機啟動時的機械負載,從而延長齒輪箱的使用壽命。服務供應商正利用持續的數位轉型,透過雲端提供諧波審核和軟體補丁,這使得先前因設備複雜性而猶豫不決的營運商更容易採用大規模設備。
區域分析
預計到2025年,亞太地區將佔全球銷售額的35.29%,這反映了跨產業化進程以及政府對機器人技術的支持。中國在生產和消費方面均佔據主導地位,本土品牌正在開發縮短前置作業時間的面向大眾市場的產品。印度的生產連結獎勵計畫計畫(PLI)正在擴大水泥、鋼鐵和汽車領域的需求,而日本則在推動功率裝置的小型化,並向全球原始設備製造商(OEM)出口技術模組。
北美和歐洲市場成熟且依然充滿活力。美國《通膨控制法案》提供稅額扣抵,提高了能源效率維修的內部報酬率,鞏固了交流電驅動市場作為脫碳關鍵驅動力的地位。歐洲電力公司正在推行動態電網輔助電價機制,獎勵那些能夠調整馬達負載以適應間歇性可再生能源的設施。因此,買家越來越傾向於選擇具有能量回收和低諧波性能的驅動裝置。
中東市場預計將實現6.62%的複合年成長率,主要得益於沙烏地阿拉伯NEOM新城和阿拉伯聯合大公國海水淡化廠等大型企劃的推動。綜合性石化中心正在為乙烯裂解裝置和海水進水泵指定使用兆瓦級驅動裝置。非洲和南美市場也因採礦業擴張和水利基礎設施投資而發展迅速,但資金籌措和售後服務網路的缺乏限制了其普及。
其他好處
- Excel格式的市場預測(ME)表
- 3個月的分析師支持
目錄
第1章:引言
- 研究假設和市場定義
- 調查範圍
第2章:調查方法
第3章執行摘要
第4章 市場狀況
- 市場概覽
- 市場促進因素
- 製造業自動化技術的進步
- 政府監管日益嚴格,對節能設備的需求不斷成長
- 商業建築暖通空調設施的快速擴張
- 降低高功率IGBT模組每千瓦的成本。
- 老舊工業廠房中變頻驅動器的維修需求激增。
- 交流變頻器與工業物聯網平台的整合用於預測性維護
- 市場限制因素
- 高昂的初始安裝成本和維護成本
- 對諧波和電能品質的擔憂阻礙了其廣泛應用。
- 缺乏熟練的技術人員來對驅動系統進行程式設計和調校。
- 半導體元件供應鏈波動對前置作業時間的影響
- 產業價值鏈分析
- 監理情勢
- 技術展望
- 宏觀經濟因素的影響
- 波特五力分析
第5章 市場規模與成長預測
- 透過電壓
- 低電壓
- 中壓及其他
- 按類型分類的額定輸出
- 1兆瓦或以下
- 1~3MW
- 超過3兆瓦
- 透過使用
- 泵浦
- 扇子
- 壓縮機
- 輸送機
- 擠出機
- 其他
- 按最終用戶行業分類
- 石油和天然氣
- 化工/石油化工
- 飲食
- 水和污水處理
- 發電
- 金屬和採礦
- 紙漿和造紙
- HVAC
- 各行業
- 其他
- 按地區
- 北美洲
- 美國
- 加拿大
- 墨西哥
- 歐洲
- 德國
- 英國
- 法國
- 俄羅斯
- 其他歐洲國家
- 亞太地區
- 中國
- 日本
- 印度
- 韓國
- 澳洲
- 其他亞太國家
- 中東和非洲
- 中東
- 沙烏地阿拉伯
- 阿拉伯聯合大公國
- 其他中東國家
- 非洲
- 南非
- 埃及
- 其他非洲地區
- 中東
- 南美洲
- 巴西
- 阿根廷
- 南美洲其他地區
- 北美洲
第6章 競爭情勢
- 市場集中度
- 策略趨勢
- 市佔率分析
- 公司簡介
- ABB Ltd
- Siemens AG
- Schneider Electric SE
- Danfoss A/S
- Rockwell Automation Inc.
- WEG SA
- Yaskawa Electric Corporation
- Toshiba International Corporation
- Parker Hannifin Corporation
- Fuji Electric Co., Ltd.
- Mitsubishi Electric Corporation
- Hitachi, Ltd.
- Emerson Electric Co.
- Nidec Corporation
- Invertek Drives Ltd.
- Eaton Corporation plc
- Bonfiglioli Riduttori SpA
- SEW-EURODRIVE GmbH and Co KG
- Lenze SE
- Nord Drivesystems Group
第7章 市場機會與未來展望
According to Mordor Intelligence, the AC electric drives market size was valued at USD 16.19 billion in 2025 and estimated to grow from USD 17.12 billion in 2026 to reach USD 22.6 billion by 2031, at a CAGR of 5.72% during the forecast period (2026-2031).
This report is Segmented by Voltage (Low Voltage, and Medium Voltage and Others), Power Rating (Up To 1 MW, 1 MW - 3 MW, Above 3 MW), Application (Pumps, Fans, Compressors, and More), End User Industry (Oil and Gas, Chemical and Petrochemical, Food and Beverage, Water and Wastewater, and More), and Geography. The Market Forecasts are Provided in Terms of Value (USD).
Global Alternating Current (AC) Electric Drives Market Trends and Insights
Increasing Automation in Manufacturing Industries
Smart-factory investments accelerate the adoption of AC electric drives in the market because executives view energy-efficiency gains as decisive cost levers. ABB released the ACS8080 medium-voltage platform in November 2024, which runs at 98% efficiency while cutting harmonic distortion by 50%. Variable-speed retrofits on fans alone reduce electricity use by up to 30%, freeing up the budget for further automation upgrades. Real-time data transmitted from drives to plant historians supports predictive quality control and reduces unplanned downtime. Governments in China, India, and Indonesia incentivize robotics through tax credits, thereby broadening the addressable installed base for intelligent drives.
Rising Government Regulations and Demand for Efficient Devices
Minimum-energy-performance standards now govern roughly two-thirds of global motor shipments. The European Union's Eco-design Directive and the United States Department of Energy's rules require factories to demonstrate quantifiable savings, making AC electric drives' market penetration virtually mandatory in new build lines. The share of electric power in final energy consumption is projected to rise from 29% in 2022 to 52% by 2050, intensifying scrutiny of every motor-driven system. Utilities also reward demand-response participation, allowing facilities equipped with variable-speed drives to monetize flexible load capacity.
High Initial Installation and Maintenance Costs
Total installed cost includes engineering, harmonic-filter banks, cooling upgrades, and operator training, sometimes reaching 2-3X the drive list price. Smaller firms defer projects when payback exceeds two fiscal years. In retrofit scenarios, rewiring panels and verifying power-quality compliance further inflate budgets. Service teams must periodically replace DC-link capacitors and fan assemblies, creating unfamiliar lifecycle obligations for maintenance departments accustomed to simple starters.
Other drivers and restraints analyzed in the detailed report include:
- Rapid Expansion of HVAC Installations in Commercial Buildings
- Declining Cost per Kilowatt of High-Power IGBT Modules
- Shortage of Skilled Technicians for Drive Programming and Tuning
For complete list of drivers and restraints, kindly check the Table Of Contents.
Segment Analysis
Low-voltage units captured the lion's share of 57.74% in 2025 because most industrial motors draw less than 690 V. However, project developers are consolidating loads, preferring one 4 MW motor over four 1 MW units to simplify maintenance. The AC electric drives market now observes medium-voltage quotations rising at a 7.52% CAGR through 2031, as petrochemical, desalination, and mining projects double down on multi-megawatt pumps. The ACS8080 release illustrates how higher power density and lower harmonics make these drives practical for brownfield sites. Regional oil refineries are adopting 6.6 kV VFDs to reduce steam-turbine auxiliary systems, thereby slashing process-heat emissions under net-zero roadmaps.
In the Asia-Pacific region, local panel builders package medium-voltage cabinets with ring-main units to meet turnkey EPC bids. European players differentiate through integral active-front-end converters that meet stringent grid-code flicker limits. Meanwhile, North American utilities are approving regenerative drive configurations that return braking energy to the network, thereby monetizing power quality improvements. These dynamics indicate an inflection point where medium-voltage penetration may displace low-voltage incumbents in power-hungry verticals by the decade's close.
Systems up to 1 MW still account for 47.10% of 2025 shipments, as OEMs in the food, beverage, and discrete manufacturing sectors typically specify standardized frames for conveyors and mixers. Yet, the AC electric drives market sees above-3 MW installations growing fastest at a 7.26% CAGR, as hydrogen electrolyzer plants, floating LNG vessels, and large-scale carbon-capture units demand precise control of giant compressors. Modern SiC inverters now exceed 7 kHz switching frequency at these ratings without requiring oversized air conditioning, allowing for indoor placement and reduced environmental sealing costs.
Original equipment manufacturers bundle 5 MW drives with active-magnetic-bearing compressors, eliminating lube-oil circuits and boosting plant uptime. In metals and mining, replacing hydraulic couplings with high-power variable-speed drives reduces mechanical stress during mill start-up, thereby extending gearbox life. Service providers capitalize on the ongoing digital transformation by offering cloud-delivered harmonic audits and software patches, making large-scale ownership less daunting for operators previously deterred by complexity.
Complete Report Scope:
- By Voltage
- Low Voltage
- Medium Voltage and Others
- By Power Rating
- Up to 1 MW
- 1 MW - 3 MW
- Above 3 MW
- By Application
- Pumps
- Fans
- Compressors
- Conveyors
- Extruders
- Other Application
- By End User Industry
- Oil and Gas
- Chemical and Petrochemical
- Food and Beverage
- Water and Wastewater
- Power Generation
- Metals and Mining
- Pulp and Paper
- HVAC
- Discrete Industries
- Other End User Industry
- By Geography
- North America
- United States
- Canada
- Mexico
- Europe
- Germany
- United Kingdom
- France
- Russia
- Rest of Europe
- Asia-Pacific
- China
- Japan
- India
- South Korea
- Australia
- Rest of Asia-Pacific
- Middle East and Africa
- Middle East
- Saudi Arabia
- United Arab Emirates
- Rest of Middle East
- Africa
- South Africa
- Egypt
- Rest of Africa
- Middle East
- South America
- Brazil
- Argentina
- Rest of South America
- North America
Geography Analysis
The Asia-Pacific region captured 35.29% of the revenue in 2025, reflecting cross-sector industrialization and supportive government robotics schemes. China's dominance spans both production and consumption, with local brands cultivating mass-market offerings that shorten lead times. India's Production Linked Incentive scheme expands demand in cement, steel, and automotive verticals, while Japan champions power-device miniaturization, exporting technology modules to global OEMs.
North America and Europe remain mature yet dynamic. The U.S. Inflation Reduction Act offers tax credits that enhance internal rates of return for energy efficiency retrofits, solidifying the AC electric drives market as a key enabler of decarbonization pathways. European utilities implement dynamic grid-support tariffs that reward facilities that throttle motor loads in response to renewable energy intermittency. Consequently, buyers favor drives with regenerative and low-harmonic capabilities.
The Middle East is on a 6.62% CAGR trajectory, energized by mega-projects such as Saudi Arabia's NEOM and United Arab Emirates desalination complexes. Integrated petrochemical hubs specify multi-megawatt drives for ethylene crackers and seawater intake pumps. African and South American markets are gaining momentum through mining expansion and water infrastructure investments; however, adoption is tempered by financing constraints and limited after-sales service networks.
- ABB Ltd
- Siemens AG
- Schneider Electric SE
- Danfoss A/S
- Rockwell Automation Inc.
- WEG S.A.
- Yaskawa Electric Corporation
- Toshiba International Corporation
- Parker Hannifin Corporation
- Fuji Electric Co., Ltd.
- Mitsubishi Electric Corporation
- Hitachi, Ltd.
- Emerson Electric Co.
- Nidec Corporation
- Invertek Drives Ltd.
- Eaton Corporation plc
- Bonfiglioli Riduttori S.p.A.
- SEW-EURODRIVE GmbH and Co KG
- Lenze SE
- Nord Drivesystems Group
Additional Benefits:
- The market estimate (ME) sheet in Excel format
- 3 months of analyst support
TABLE OF CONTENTS
1 INTRODUCTION
- 1.1 Study Assumptions and Market Definition
- 1.2 Scope of the Study
2 RESEARCH METHODOLOGY
3 EXECUTIVE SUMMARY
4 MARKET LANDSCAPE
- 4.1 Market Overview
- 4.2 Market Drivers
- 4.2.1 Increasing Automation in Manufacturing Industries
- 4.2.2 Rising Government Regulations and Demand for Energy Efficient Devices
- 4.2.3 Rapid Expansion of HVAC Installations in Commercial Buildings
- 4.2.4 Declining Cost per Kilowatt of High-Power IGBT Modules
- 4.2.5 Surge in Variable Frequency Drive Retrofits in Aging Industrial Plants
- 4.2.6 Integration of AC Drives with IIoT Platforms for Predictive Maintenance
- 4.3 Market Restraints
- 4.3.1 High Initial Installation and Maintenance Costs
- 4.3.2 Harmonics and Power Quality Concerns Limiting Adoption
- 4.3.3 Shortage of Skilled Technicians for Drive Programming and Tuning
- 4.3.4 Supply Chain Volatility in Semiconductor Components Affecting Lead Times
- 4.4 Industry Value Chain Analysis
- 4.5 Regulatory Landscape
- 4.6 Technological Outlook
- 4.7 Impact of Macroeconomic Factors
- 4.8 Porter's Five Forces Analysis
- 4.8.1 Bargaining Power of Suppliers
- 4.8.2 Bargaining Power of Buyers/Consumers
- 4.8.3 Threat of New Entrants
- 4.8.4 Threat of Substitutes
- 4.8.5 Intensity of Competitive Rivalry
5 MARKET SIZE AND GROWTH FORECASTS (VALUE)
- 5.1 By Voltage
- 5.1.1 Low Voltage
- 5.1.2 Medium Voltage and Others
- 5.2 By Power Rating
- 5.2.1 Up to 1 MW
- 5.2.2 1 MW - 3 MW
- 5.2.3 Above 3 MW
- 5.3 By Application
- 5.3.1 Pumps
- 5.3.2 Fans
- 5.3.3 Compressors
- 5.3.4 Conveyors
- 5.3.5 Extruders
- 5.3.6 Other Application
- 5.4 By End User Industry
- 5.4.1 Oil and Gas
- 5.4.2 Chemical and Petrochemical
- 5.4.3 Food and Beverage
- 5.4.4 Water and Wastewater
- 5.4.5 Power Generation
- 5.4.6 Metals and Mining
- 5.4.7 Pulp and Paper
- 5.4.8 HVAC
- 5.4.9 Discrete Industries
- 5.4.10 Other End User Industry
- 5.5 By Geography
- 5.5.1 North America
- 5.5.1.1 United States
- 5.5.1.2 Canada
- 5.5.1.3 Mexico
- 5.5.2 Europe
- 5.5.2.1 Germany
- 5.5.2.2 United Kingdom
- 5.5.2.3 France
- 5.5.2.4 Russia
- 5.5.2.5 Rest of Europe
- 5.5.3 Asia-Pacific
- 5.5.3.1 China
- 5.5.3.2 Japan
- 5.5.3.3 India
- 5.5.3.4 South Korea
- 5.5.3.5 Australia
- 5.5.3.6 Rest of Asia-Pacific
- 5.5.4 Middle East and Africa
- 5.5.4.1 Middle East
- 5.5.4.1.1 Saudi Arabia
- 5.5.4.1.2 United Arab Emirates
- 5.5.4.1.3 Rest of Middle East
- 5.5.4.2 Africa
- 5.5.4.2.1 South Africa
- 5.5.4.2.2 Egypt
- 5.5.4.2.3 Rest of Africa
- 5.5.4.1 Middle East
- 5.5.5 South America
- 5.5.5.1 Brazil
- 5.5.5.2 Argentina
- 5.5.5.3 Rest of South America
- 5.5.1 North America
6 COMPETITIVE LANDSCAPE
- 6.1 Market Concentration
- 6.2 Strategic Moves
- 6.3 Market Share Analysis
- 6.4 Company Profiles (includes Global level Overview, Market level overview, Core Segments, Financials as available, Strategic Information, Market Rank/Share for key companies, Products and Services, and Recent Developments)
- 6.4.1 ABB Ltd
- 6.4.2 Siemens AG
- 6.4.3 Schneider Electric SE
- 6.4.4 Danfoss A/S
- 6.4.5 Rockwell Automation Inc.
- 6.4.6 WEG S.A.
- 6.4.7 Yaskawa Electric Corporation
- 6.4.8 Toshiba International Corporation
- 6.4.9 Parker Hannifin Corporation
- 6.4.10 Fuji Electric Co., Ltd.
- 6.4.11 Mitsubishi Electric Corporation
- 6.4.12 Hitachi, Ltd.
- 6.4.13 Emerson Electric Co.
- 6.4.14 Nidec Corporation
- 6.4.15 Invertek Drives Ltd.
- 6.4.16 Eaton Corporation plc
- 6.4.17 Bonfiglioli Riduttori S.p.A.
- 6.4.18 SEW-EURODRIVE GmbH and Co KG
- 6.4.19 Lenze SE
- 6.4.20 Nord Drivesystems Group
7 MARKET OPPORTUNITIES AND FUTURE OUTLOOK
- 7.1 White-Space and Unmet-Need Assessment

 亞太地區電動驅動市場:市場佔有率分析、產業趨勢與統計及成長預測(2026-2031)低壓馬達驅動:市場佔有率分析、產業趨勢與統計、成長預測(2026-2031年)電動驅動:市場佔有率分析、產業趨勢與統計、成長預測(2026-2031)
 2034年全球電動驅動單元市場預測-按組件、驅動系統、電壓架構、推進方式、架構類型、銷售管道和地區分類的分析
 電動裝置市場規模、佔有率和成長分析:按組件、驅動系統配置、系統電壓配置、終端用戶產業和地區分類-2026-2033年產業預測
 OEM電動驅動單元市場機會、成長要素、產業趨勢分析及2026-2035年預測
 電氣和機械驅動裝置市場:2026-2032年全球市場預測(按驅動系統、額定功率、速度範圍、最終用戶產業、應用和控制系統分類)
 BEV電動裝置的全球市場中東和非洲的電動式驅動:市場佔有率分析、產業趨勢和成長預測(2025-2030)全球直流 (DC) 電力驅動市場:市場佔有率分析、產業趨勢與統計、成長預測(2025-2030 年)