


 |
市場調查報告書
商品編碼
2125272
電動驅動:市場佔有率分析、產業趨勢與統計、成長預測(2026-2031)Electric Drives - Market Share Analysis, Industry Trends & Statistics, Growth Forecasts (2026 - 2031) |
||||||

※ 本網頁內容可能與最新版本有所差異。詳細情況請與我們聯繫。
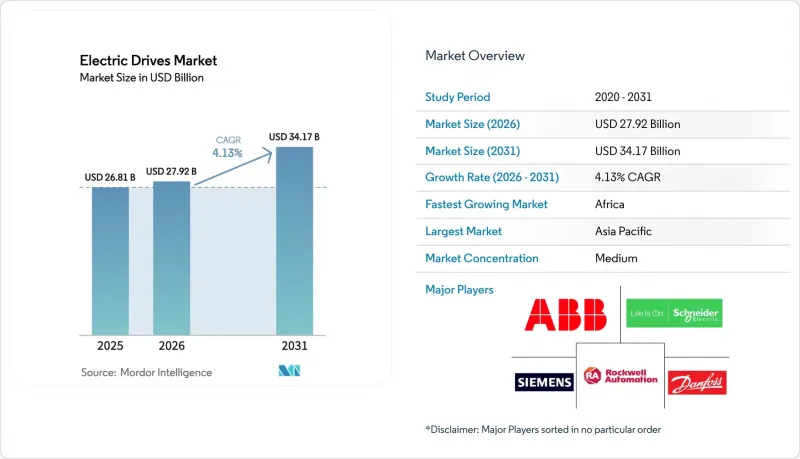
根據 Mordor Intelligence 估計,到 2026 年,電動車市值將達到 279.2 億美元,高於 2025 年的 268.1 億美元,預計到 2031 年將達到 341.7 億美元。
預計 2026 年至 2031 年的複合年成長率為 4.13%。
本報告按產品類型(交流變頻器、直流驅動器、伺服驅動器)、電壓(低電壓驅動器、中壓驅動器)、額定功率(250kW以下、251-500kW、500kW以上)、終端用戶產業(石油天然氣、水和污水處理、化學和石化、食品飲料、發電、以上)、終端用戶產業(石油天然氣、水和廢水處理、化學和石化、食品飲料、發電、以上)、市場預測以美元計價。
全球電動驅動市場趨勢及洞察
全球及各國均有嚴格的能源效率法規。
美國、歐洲和中國的新法規提高了馬達的最低能效標準,實際上強制要求高能耗工廠採用變頻驅動器。產業審計顯示,馬達消耗的電力消耗量的70%之多,而更換恆速啟動器可顯著降低碳排放和成本。各國政府目前正將稅收優惠和津貼計畫與檢驗的驅動器維修掛鉤,為認證產品創造了可預測的需求。供應商也積極回應,將能源評估軟體與驅動器捆綁銷售,以量化證明三年內即可實現投資回報。因此,在政策支持下,電動驅動器市場正在形成永續的升級週期。
電動車生產線擴建需要高精度驅動裝置
在電動車工廠中,電池組裝、馬達繞線和品管控制站的重複精度要求低於0.1毫米,這使得伺服驅動器成為生產線設計的核心。汽車原始設備製造商(OEM)已在電氣化領域投資超過1000億美元,新建工廠(待開發區)從一開始就將先進的運動控制組件納入其設計規範。即使在內燃機工廠的現有設施維修(棕地)中,傳統的輸送機也正在被伺服驅動的軟性單元所取代。伺服供應商正在增加整合安全功能和分散式I/O,以簡化與機器人的整合,從而加速即插即用的部署。持續的資金流入正在鞏固電動驅動市場作為電動車投資主要受益者的地位。
與固定速度替代方案相比,初始資本投入較高
變頻器的成本可能是接觸器啟動器的三到五倍,這使得資本投資成為融資緊張的工廠的一大障礙。雖然不到三年的投資回收期對精明的營運商來說頗具吸引力,但許多公司仍然推遲升級,尤其是在電費補貼的情況下。這種反對意見在15kW以下的功率範圍內尤其明顯,因為該功率範圍內的絕對成本節約有限,而盈虧平衡期卻很長。儘管驅動器租賃和能源即服務(EaaS)等資金籌措方案正在興起,但除北美和西歐以外,這些方案的應用仍然有限。未來,半導體價格的下降和電力公司的獎勵可能會降低這些門檻,並擴大對電動驅動器的潛在需求。
細分市場分析
到2025年,交流變頻器將佔據馬達驅動市場70.62%的主導佔有率。這反映了其在泵浦、風扇和輸送機線等領域的廣泛應用,而這些應用正是全球工廠自動化的基礎。標準化的介面、成熟的零件供應鏈以及安裝人員的廣泛熟悉度正在推動市場需求,尤其是在食品加工和供水事業,可靠性比尖端性能更為重要。在整個預測期內,隨著電力公司提高離心設備的能源效率目標,馬達驅動市場預計將繼續依賴交流電平台進行基礎馬達控制。伺服驅動器仍是成長最快的細分市場,到2031年將維持4.25%的複合年成長率,這得益於離散製造工廠在電池、醫療設備組裝中對亞微米級定位的需求。伺服器供應商目前正在將整合安全功能和單電纜網路整合到產品中,提供與同質化交流驅動器截然不同的高級產品。
電動驅動市場正受益於技術融合,伺服演算法被引入高階交流電機組件,模糊了傳統產品線和電動產品線之間的界限,同時為中端用戶保持了有吸引力的成本優勢。直流驅動器曾一度在金屬和採礦領域備受青睞,但如今隨著現代交流向量控制能夠以更低的維護成本實現相近的扭矩精度,直流驅動器的市場佔有率正在下降。然而,一些軋延運營商仍然指定使用直流電機,以兼容舊有系統,從而產生了雖不大但持續的替換需求。將交流、伺服和直流軸整合到單一機架中的多驅動平台正日益受到關注,尤其是那些優先考慮跨運動類別統一編程的工具機製造商的原始設備製造商 (OEM)。這種融合為主要供應商帶來了生命週期業務收益,並鞏固了整個電動驅動市場的適度集中度。
到2025年,低壓系統(1kV以下)將佔總收入的62.98%,為大多數工廠泵浦、壓縮機和物料輸送線提供支援。由於安裝簡單、易於取得的塑殼保護裝置以及技術人員技能的普及,低壓系統擁有較低的總體擁有成本,從而保證了電力驅動市場在標準製造領域仍將以低壓為主。然而,成長主要集中在中壓設備,預計到2031年,隨著重工業營運商將大型馬達升級為變速運行,中壓設備將以4.62%的複合年成長率成長。
中壓工程通常出現在液化天然氣、水泥和海水淡化廠擴建棕地產能,或投資待開發區案時,這些工程的泵浦和壓縮機輸出功率超過2兆瓦。營運商青睞這些解決方案,因為與並聯運行多個低壓馬達相比,它們能夠提高功率因數並降低電纜損耗。亞兩電平逆變器拓樸結構、碳化矽元件和再生功能如今已成為高階中壓機組的差異化優勢,幫助供應商獲得更高的利潤率。諧波抑制和併網輔助模式等併網功能與礦業和偏遠油田新興的微電網計畫相契合,提升了電網的韌性。因此,電力驅動市場呈現兩極化:商品化的低壓產品維持著市場規模,而技術先進的中壓機組則創造了不成比例的高額利潤。
區域分析
2025年,亞太地區仍將以45.10%的市佔率維持全球電動驅動市場最大佔有率。這主要得益於中國2024年500億美元的自動化相關支出,以及印度在獎勵推動下工廠建設的成長。中國企業持續以變速電機組件取代傳統起動電機,以滿足國家最新的能源強度法規要求;同時,長三角電池超級工廠Delta中伺服的應用也在加速推進。印度的生產連結獎勵計畫計劃(PLI)促進了白色家電的本地化生產,並提振了鈑金沖壓機和射出成型伺服的需求。日本和韓國持續保持技術領先地位,為協作機器人單元和半導體製造廠採購高性能人工智慧驅動馬達。同時,東南亞國家正從實驗性自動化單元轉型為大規模生產線。這些發展共同鞏固了亞太地區在電動驅動市場的主導地位。
在北美,隨著現有工廠(棕地)維修驅動裝置以符合美國能源局(DOE) 的電機法規並利用電力公司提供的需量反應補貼,替換需求持續成長。汽車產業向五大湖區周邊地區的回流刺激了伺服的新訂單,凸顯了離散製造業領域電動驅動市場的規模。在加拿大採礦業,隨著鉀肥和鎳產量的增加,中壓伺服馬達組件正在被引入;與此同時,墨西哥一家一級需量反應零件供應商正在為其變速箱殼體加工中心指定使用具有整合安全功能的伺服。此外,預測性維護雲端平台的趨勢正在推進,這促進了國內軟體生態系統的發展,並確保數位服務能夠整合到硬體出貨中。
歐洲是一個成熟且創新主導的市場,工業4.0藍圖和歐洲綠色交易進一步加速了變速技術的應用。德國自動化出口商正在尋求同步磁阻驅動器以降低磁性材料帶來的風險;義大利機械OEM廠商正在整合網路安全增強型韌體以保護智慧財產權;北歐的加工廠正在採用再生驅動來增強電網的可再生能源比例。非洲儘管目前市場規模較小,但其成長率最高,到2031年年複合成長率(CAGR)將達到5.26%,這主要得益於南非礦山運輸卡車的電氣化以及奈及利亞水泥壓機中壓逆變器的引入。歐洲製造商將勞力密集生產流程轉移到北非,也推動了伺服系統在當地的應用。這些趨勢共同作用,正在使區域收入來源多元化,並穩定電動驅動市場的長期成長軌跡。
其他好處
- Excel格式的市場預測(ME)表
- 3個月的分析師支持
目錄
第1章:引言
- 研究假設和市場定義
- 調查範圍
第2章:調查方法
第3章執行摘要
第4章 市場狀況
- 市場概覽
- 宏觀經濟因素的影響
- 市場促進因素
- 製程製造和離散製造場所的快速工業化
- 全球及各國均有嚴格的能源效率法規。
- 電動車生產線擴建需要高精度驅動裝置
- 數位化維修-現有設備節能變頻驅動器
- 人工智慧驅動的預測性維護可減少驅動系統停機時間。
- 過渡到不含稀土元素的拓樸結構(軸向磁通型、開關磁阻型)
- 市場限制因素
- 與固定速度替代方案相比,初始資本投入較高
- 對惡劣運作環境和高諧波環境下的可靠性存在擔憂。
- 電力電子元件和磁鐵供應鏈的波動
- 連網智慧硬碟的網路安全漏洞
- 工業生態系分析
- 監理情勢
- 技術展望
- 波特五力分析
第5章 市場規模與成長預測
- 依產品
- 交流變頻器
- 直流驅動器
- 伺服驅動器
- 透過電壓
- 低壓驅動
- 中壓驅動
- 按類型分類的額定輸出
- 小於250千瓦
- 251~500kW
- 超過500千瓦
- 按最終用戶行業分類
- 石油和天然氣
- 水和污水處理
- 化工/石油化工
- 飲食
- 發電
- HVAC
- 紙漿和造紙
- 各行業
- 其他
- 按地區
- 北美洲
- 美國
- 加拿大
- 墨西哥
- 南美洲
- 巴西
- 阿根廷
- 其他南美國家
- 歐洲
- 德國
- 義大利
- 英國
- 法國
- 西班牙
- 其他歐洲國家
- 亞太地區
- 中國
- 日本
- 印度
- 韓國
- 其他亞太國家
- 中東
- 沙烏地阿拉伯
- 阿拉伯聯合大公國
- 土耳其
- 其他中東國家
- 非洲
- 南非
- 奈及利亞
- 其他非洲地區
- 北美洲
第6章 競爭情勢
- 市場集中度
- 策略趨勢
- 市佔率分析
- 公司簡介
- ABB Ltd.
- Siemens AG
- Danfoss A/S
- Rockwell Automation Inc.
- Schneider Electric SE
- Yaskawa Electric Corporation
- Mitsubishi Electric Corporation
- Nidec Corporation
- SEW-EURODRIVE GmbH and Co KG
- TMEIC Corporation
- WEG SA
- Hitachi Ltd.
- Fuji Electric Co. Ltd.
- Eaton Corporation plc
- Emerson Electric Co.
- Toshiba International Corporation Inc.
- Parker Hannifin Corporation
- Regal Rexnord Corporation
- Johnson Electric Holdings Limited
- Bonfiglioli Riduttori SpA
第7章 市場機會與未來展望
According to Mordor Intelligence, electric drives market size in 2026 is estimated at USD 27.92 billion, growing from 2025 value of USD 26.81 billion with 2031 projections showing USD 34.17 billion, growing at 4.13% CAGR over 2026-2031.
This report is Segmented by Product (AC Drives, DC Drives, and Servo Drives), Voltage (Low-Voltage Drive, and Medium-Voltage Drive), Power Rating (Less Than 250 KW, 251-500 KW, and More Than 500 KW), End-User Industry (Oil and Gas, Water and Wastewater, Chemical and Petrochemical, Food and Beverage, Power Generation, HVAC, and More), and Geography. The Market Forecasts are Provided in Terms of Value (USD).
Global Electric Drives Market Trends and Insights
Stringent Global and National Energy-Efficiency Mandates
New U.S., European and Chinese rules elevate minimum motor efficiency levels, effectively compelling variable-frequency drive adoption in energy-intensive plants. Industrial audits show motors consuming up to 70% of manufacturing electricity, so replacing fixed-speed starters yields sizable carbon and cost savings. Governments now link tax incentives and grant programs to verified drive retrofits, creating predictable demand for certified products. Vendors respond by packaging drives with energy-assessment software that quantifies payback in under three years. As a result, the electric drives market gains a durable replacement cycle anchored in policy enforcement.
Acceleration of E-Mobility Production Lines Needing High-Precision Drives
Battery assembly, motor winding and quality-control stations in electric-vehicle plants require sub-0.1 millimeter repeatability, placing servo drives at the heart of line design Automotive OEMs have committed more than USD 100 billion toward electrification, and each greenfield factory specifies advanced motion packages from day one. Brownfield retrofits of internal-combustion plants also replace legacy conveyors with servo-based flexible cells. Servo vendors add integrated safety and decentralized I/O to simplify robot collaboration, accelerating plug-and-play deployment. This continuous capital flow cements the electric drives market as a primary beneficiary of e-mobility investment.
High Initial Capex Versus Fixed-Speed Alternatives
Variable-frequency drives cost three to five times more than contactor starters, making capex a hurdle in cash-constrained plants. Payback periods under three years appeal to financially savvy operators, yet many still defer upgrades when electricity is subsidized. The objection is acute in sub-15 kW ranges where absolute savings are modest, extending breakeven timelines. Financing options such as drive-leasing or energy-as-a-service are emerging but remain scarce outside North America and Western Europe. Over time, falling semiconductor prices and utility incentives may ease the barrier, widening addressable demand in the electric drives market.
Other drivers and restraints analyzed in the detailed report include:
- Digital Retrofits - Variable-Speed Drives for Brownfield Energy Savings
- AI-Enabled Predictive Maintenance Reducing Downtime of Drive Systems
- Cyber-Security Vulnerabilities in Network-Connected Smart Drives
For complete list of drivers and restraints, kindly check the Table Of Contents.
Segment Analysis
AC drives held a dominant 70.62% electric drives market share in 2025, reflecting their versatility in pumps, fans and conveyor lines that underpin global factory automation. Standardized interfaces, mature component supply chains and broad installer familiarity sustain demand, particularly in food processing and water utilities where reliability trumps cutting-edge performance. Over the forecast horizon, the electric drives market will continue to rely on AC platforms for baseline motor control as utilities tighten efficiency targets in centrifugal equipment. Servo drives remain the fastest-growing niche with a 4.25% CAGR through 2031 thanks to discrete manufacturing plants that require sub-micrometer positioning in battery, electronics and medical-device assembly. Servo vendors now bundle integrated safety functions and one-cable networks, distinguishing their premium offerings from commoditized AC units.
The electric drives market benefits from a technology crossover as servo algorithms migrate into high-end AC packages, blurring historic product lines while keeping cost curves attractive for mid-tier users. DC drives, once favored in metals and mining, now occupy shrinking pockets because modern AC vector control replicates their torque fidelity at lower maintenance cost. Yet some rolling-mill operators still specify DC units for legacy compatibility, providing a modest replacement stream. Multi-drive platforms that combine AC, servo and DC axes in a single rack are gaining attention, especially among machine-builder OEMs that value unified programming across motion classes. This convergence supports life-cycle service revenues for top suppliers, reinforcing moderate concentration in the broader electric drives market.
Low-voltage systems below 1 kV accounted for 62.98% of 2025 revenue, underpinning most factory pumps, compressors and material-handling lines. Installation simplicity, ready availability of molded-case protection gear and widespread technician skill sets keep total ownership cost low, ensuring that the electric drives market retains a low-voltage core in standard manufacturing. Growth nonetheless skews toward medium-voltage equipment, which is projected to advance at a 4.62% CAGR through 2031 as heavy-industry operators upgrade large motors to variable-speed duty.
Medium-voltage projects typically surface during brownfield capacity expansions or greenfield investments in LNG, cement and desalination plants, where pumps or compressors exceed 2 MW. Operators favor these solutions for improved power factor and reduced cable losses relative to running multiple low-voltage motors in parallel. Quasi-two-level inverter topologies, silicon-carbide devices and regenerative capabilities now differentiate premium medium-voltage packages, helping suppliers justify higher margins. Utility-interactive features such as harmonic mitigation and grid-support modes align with nascent microgrid programs in mining and remote oilfields, adding resilience value. As a result, the electric drives market sees a bifurcation: commoditized low-voltage volumes sustain scale while technologically sophisticated medium-voltage units generate disproportionate profit pools.
Complete Report Scope:
- By Product
- AC Drives
- DC Drives
- Servo Drives
- By Voltage
- Low-Voltage Drive
- Medium-Voltage Drive
- By Power Rating
- Less than 250 kW
- 251-500 kW
- Above 500 kW
- By End-User Industry
- Oil and Gas
- Water and Wastewater
- Chemical and Petrochemical
- Food and Beverage
- Power Generation
- HVAC
- Pulp and Paper
- Discrete Industries
- Other End-User Industries
- By Geography
- North America
- United States
- Canada
- Mexico
- South America
- Brazil
- Argentina
- Rest of South America
- Europe
- Germany
- Italy
- United Kingdom
- France
- Spain
- Rest of Europe
- Asia Pacific
- China
- Japan
- India
- South Korea
- Rest of Asia Pacific
- Middle East
- Saudi Arabia
- United Arab Emirates
- Turkey
- Rest of Middle East
- Africa
- South Africa
- Nigeria
- Rest of Africa
- North America
Geography Analysis
Asia Pacific retained the largest share of the electric drives market in 2025 at 45.10%, sustained by China's USD 50 billion 2024 automation spend and India's incentive-backed factory build-out. Chinese enterprises continue to replace legacy starters with variable-speed packages to satisfy the country's latest energy-intensity mandate, while servo adoption accelerates in battery-gigafactory clusters along the Yangtze River Delta. India's Production Linked Incentive scheme drives localized manufacturing of whitegoods, spurring mid-range servo demand in sheet-metal presses and injection-molding machines. Japan and South Korea remain technology front runners, purchasing premium AI-enabled drives for collaborative robot cells and semiconductor fabs, whereas Southeast Asian nations advance from pilot automation cells to full production lines. These combined activities cement regional primacy in the electric drives market.
North America delivers steady replacement demand as brownfield plants retrofit drives to meet U.S. DOE motor rules and leverage utility rebates for demand-response. Automotive reshoring initiatives around the Great Lakes trigger fresh servo orders, underscoring the electric drives market size within discrete manufacturing. Canada's mining sector deploys medium-voltage packages in potash and nickel expansions, while Mexico's tier-one automotive suppliers specify safety-integrated servos for transmission-housing machining centers. A parallel trend toward predictive-maintenance cloud platforms favors domestic software ecosystems, ensuring that digital services layer atop hardware shipments.
Europe represents a mature yet innovation-driven arena where Industry 4.0 roadmaps and the European Green Deal reinforce variable-speed penetration. German automation exporters demand synchronous-reluctance drives to trim magnet material risk, Italian machinery OEMs embed cyber-secure firmware to protect intellectual property, and Nordic process plants adopt regenerative drives to bolster renewable-heavy grids. Africa, although holding a smaller base today, records the fastest 5.26% CAGR to 2031 as South African mines electrify haul trucks and Nigerian cement presses install medium-voltage inverters. European manufacturers relocating labor-intensive stages to North Africa also lift localized servo uptake. Collectively, these patterns diversify regional revenue streams, stabilizing the long-term trajectory of the electric drives market.
- ABB Ltd.
- Siemens AG
- Danfoss A/S
- Rockwell Automation Inc.
- Schneider Electric SE
- Yaskawa Electric Corporation
- Mitsubishi Electric Corporation
- Nidec Corporation
- SEW-EURODRIVE GmbH and Co KG
- TMEIC Corporation
- WEG S.A.
- Hitachi Ltd.
- Fuji Electric Co. Ltd.
- Eaton Corporation plc
- Emerson Electric Co.
- Toshiba International Corporation Inc.
- Parker Hannifin Corporation
- Regal Rexnord Corporation
- Johnson Electric Holdings Limited
- Bonfiglioli Riduttori S.p.A.
Additional Benefits:
- The market estimate (ME) sheet in Excel format
- 3 months of analyst support
TABLE OF CONTENTS
1 INTRODUCTION
- 1.1 Study Assumptions and Market Definition
- 1.2 Scope of the Study
2 RESEARCH METHODOLOGY
3 EXECUTIVE SUMMARY
4 MARKET LANDSCAPE
- 4.1 Market Overview
- 4.2 Impact of Macroeconomic Factors
- 4.3 Market Drivers
- 4.3.1 Rapid industrialisation in process and discrete manufacturing hubs
- 4.3.2 Stringent global and national energy-efficiency mandates
- 4.3.3 Acceleration of e-mobility production lines needing high-precision drives
- 4.3.4 Digital retrofits - variable-speed drives for brownfield energy savings
- 4.3.5 AI-enabled predictive maintenance reducing downtime of drive systems
- 4.3.6 Shift toward rare-earth-free topologies (axial-flux, switched-reluctance)
- 4.4 Market Restraints
- 4.4.1 High initial capex versus fixed-speed alternatives
- 4.4.2 Reliability concerns in harsh-duty, high-harmonic environments
- 4.4.3 Supply-chain volatility for power-electronic components and magnets
- 4.4.4 Cyber-security vulnerabilities in network-connected smart drives
- 4.5 Industry Ecosystem Analysis
- 4.6 Regulatory Landscape
- 4.7 Technological Outlook
- 4.8 Porter's Five Forces Analysis
- 4.8.1 Bargaining Power of Suppliers
- 4.8.2 Bargaining Power of Buyers
- 4.8.3 Threat of New Entrants
- 4.8.4 Threat of Substitutes
- 4.8.5 Intensity of Competitive Rivalry
5 MARKET SIZE AND GROWTH FORECASTS (VALUE)
- 5.1 By Product
- 5.1.1 AC Drives
- 5.1.2 DC Drives
- 5.1.3 Servo Drives
- 5.2 By Voltage
- 5.2.1 Low-Voltage Drive
- 5.2.2 Medium-Voltage Drive
- 5.3 By Power Rating
- 5.3.1 Less than 250 kW
- 5.3.2 251-500 kW
- 5.3.3 Above 500 kW
- 5.4 By End-User Industry
- 5.4.1 Oil and Gas
- 5.4.2 Water and Wastewater
- 5.4.3 Chemical and Petrochemical
- 5.4.4 Food and Beverage
- 5.4.5 Power Generation
- 5.4.6 HVAC
- 5.4.7 Pulp and Paper
- 5.4.8 Discrete Industries
- 5.4.9 Other End-User Industries
- 5.5 By Geography
- 5.5.1 North America
- 5.5.1.1 United States
- 5.5.1.2 Canada
- 5.5.1.3 Mexico
- 5.5.2 South America
- 5.5.2.1 Brazil
- 5.5.2.2 Argentina
- 5.5.2.3 Rest of South America
- 5.5.3 Europe
- 5.5.3.1 Germany
- 5.5.3.2 Italy
- 5.5.3.3 United Kingdom
- 5.5.3.4 France
- 5.5.3.5 Spain
- 5.5.3.6 Rest of Europe
- 5.5.4 Asia Pacific
- 5.5.4.1 China
- 5.5.4.2 Japan
- 5.5.4.3 India
- 5.5.4.4 South Korea
- 5.5.4.5 Rest of Asia Pacific
- 5.5.5 Middle East
- 5.5.5.1 Saudi Arabia
- 5.5.5.2 United Arab Emirates
- 5.5.5.3 Turkey
- 5.5.5.4 Rest of Middle East
- 5.5.6 Africa
- 5.5.6.1 South Africa
- 5.5.6.2 Nigeria
- 5.5.6.3 Rest of Africa
- 5.5.1 North America
6 COMPETITIVE LANDSCAPE
- 6.1 Market Concentration
- 6.2 Strategic Moves
- 6.3 Market Share Analysis
- 6.4 Company Profiles (includes Global level overview, Market level overview, Core segments, Financials as available, Strategic Information, Market Rank/Share for key companies, Products and Services, and Recent Developments)
- 6.4.1 ABB Ltd.
- 6.4.2 Siemens AG
- 6.4.3 Danfoss A/S
- 6.4.4 Rockwell Automation Inc.
- 6.4.5 Schneider Electric SE
- 6.4.6 Yaskawa Electric Corporation
- 6.4.7 Mitsubishi Electric Corporation
- 6.4.8 Nidec Corporation
- 6.4.9 SEW-EURODRIVE GmbH and Co KG
- 6.4.10 TMEIC Corporation
- 6.4.11 WEG S.A.
- 6.4.12 Hitachi Ltd.
- 6.4.13 Fuji Electric Co. Ltd.
- 6.4.14 Eaton Corporation plc
- 6.4.15 Emerson Electric Co.
- 6.4.16 Toshiba International Corporation Inc.
- 6.4.17 Parker Hannifin Corporation
- 6.4.18 Regal Rexnord Corporation
- 6.4.19 Johnson Electric Holdings Limited
- 6.4.20 Bonfiglioli Riduttori S.p.A.
7 MARKET OPPORTUNITIES AND FUTURE OUTLOOK
- 7.1 White-Space and Unmet-Need Assessment

 亞太地區電動驅動市場:市場佔有率分析、產業趨勢與統計及成長預測(2026-2031)交流電驅動:市場佔有率分析、產業趨勢與統計資料、成長預測(2026-2031 年)低壓馬達驅動:市場佔有率分析、產業趨勢與統計、成長預測(2026-2031年)
 2034年全球電動驅動單元市場預測-按組件、驅動系統、電壓架構、推進方式、架構類型、銷售管道和地區分類的分析
 電動裝置市場規模、佔有率和成長分析:按組件、驅動系統配置、系統電壓配置、終端用戶產業和地區分類-2026-2033年產業預測
 OEM電動驅動單元市場機會、成長要素、產業趨勢分析及2026-2035年預測
 電氣和機械驅動裝置市場:2026-2032年全球市場預測(按驅動系統、額定功率、速度範圍、最終用戶產業、應用和控制系統分類)
 BEV電動裝置的全球市場中東和非洲的電動式驅動:市場佔有率分析、產業趨勢和成長預測(2025-2030)全球直流 (DC) 電力驅動市場:市場佔有率分析、產業趨勢與統計、成長預測(2025-2030 年)