


 |
市場調查報告書
商品編碼
2124534
非洲玻璃瓶與容器:市場佔有率分析、產業趨勢與統計、成長預測(2026-2031 年)Africa Glass Bottles And Containers - Market Share Analysis, Industry Trends & Statistics, Growth Forecasts (2026 - 2031) |
||||||

※ 本網頁內容可能與最新版本有所差異。詳細情況請與我們聯繫。
根據 Mordor Intelligence 預測,非洲玻璃瓶和容器市場規模將從 2025 年的 473 萬噸和 2026 年的 499 萬噸成長到 2031 年的 636 萬噸,2026 年至 2031 年的年複合成長率(CAGR)為 4.97%。
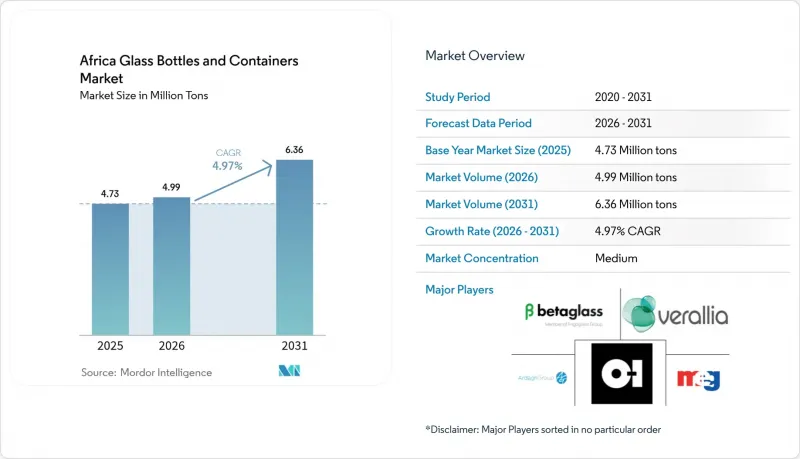
本報告按最終用戶(飲料、食品、化妝品及個人護理用品等)、顏色(燧石色、琥珀色、綠色等)和地區(埃及、奈及利亞、肯亞等)進行細分。市場預測以數量(噸)為單位。
非洲玻璃瓶和容器市場的趨勢和洞察。
飲料消費量增加,高檔包裝的需求也隨之成長
非洲對品牌啤酒、烈酒和碳酸飲料的需求正在加速成長,這一成長動能正以遠超人口成長率的速度推動高價值玻璃製品的需求成長。東非啤酒廠在2024-2025會計年度回收了超過1700萬個可回收玻璃瓶,這表明儘管PET在水和果汁領域佔據主導地位,但可重複使用的玻璃容器仍然是啤酒經濟的核心。像肯亞的Procera Gin這樣的精釀烈酒生產商現在指定使用壓紋、網版印刷和定製瓶蓋,這促使加工商轉向小批量生產,以獲得更高的單位利潤率。在西非,Beta Glass累計,2025會計年度上半年銷售額為782億奈拉(9,740萬美元),證實了飲料填充商的穩定需求。隨著中產階級的成熟和消費更加優質化,預計此因素將使基準複合年成長率提高約1.2個百分點。
推動制定食品級和可回收包裝材料的相關法規
世界各國政府都在收緊廢棄物處理和安全標準,市場環境也正朝著可無限循環利用的玻璃方向發展。肯亞2024年實施的「生產者延伸責任制」(EPR)法規對每件玻璃製品徵收150肯亞先令的進口課稅,並強制要求生產商實施回收計畫。這有效地保護了國產玻璃免受低成本進口產品的衝擊。南非的可行性研究表明,引入1蘭特的押金可以將回收率提高到90%,並使約30.5萬至47.7萬噸廢棄物免於掩埋。非洲聯盟的「2024-2034年循環經濟行動計畫」設定了30%的回收率目標,這增強了製造商擴大玻璃廢棄物處理基礎設施的信心。預計這些措施將使複合年成長率提高0.9個百分點,其中肯亞和南非的初期階段預計將出現最顯著的成長,因為這兩個國家的法規已經有效實施。
PET和鋁製輕質容器的普及
更便宜、更輕的塑膠和罐裝產品正在軟性飲料、礦泉水和入門級葡萄酒市場佔據越來越大的佔有率。可口可樂希臘瓶裝公司已在拉各斯開設了PET加工廠,該加工廠每年可加工13,000噸食品級rPET,這進一步鞏固了品牌所有者在外帶管道對一次性塑膠包裝的偏好。國際鋁業協會最近的一項調查顯示,玻璃在單位成本和排放量方面均表現最差,促使飲料製造商採取多元化策略,開發多種包裝形式。到2023年,盒中袋包裝將佔南非國內葡萄酒包裝的49.4%,凸顯了替代玻璃容器的壓力日益增加。預計這些因素將在短期內使複合年成長率下降0.8個百分點。
細分市場分析
預計到2025年,飲料將佔總銷售額的72.12%,鞏固南非在玻璃瓶和容器市場的主導地位。啤酒是最大的子類別,而頂級烈酒和葡萄酒的單位利潤率更高,尤其是在南非以出口為導向的西開普省。東非啤酒公司在2024-2025會計年度回收了超過1700萬個可重複使用的瓶子,這表明可重複填充的循環系統已經建立,該系統優先使用玻璃而非一次性產品。非酒精飲料品牌仍依賴PET來包裝低價產品,但羅紋玻璃仍然是高檔果汁包裝的主流選擇。
預計到2031年,化妝品和個人護理市場將以5.88%的年均成長率成長,成為所有應用領域中成長最快的市場。可支配收入的增加、線上美容市場的快速發展以及消費者對香水和精華液玻璃瓶的奢華認知,都是推動市場需求成長的主要因素。阿拉伯製藥玻璃公司運作三座熔爐,每天為製藥和美容行業的客戶生產125萬個容器,展現了其在該地區供應品質認證產品的能力。在全球專業公司Gellesheimer出售其模壓玻璃業務後,當地加工商將此視為填補產能缺口、縮短前置作業時間的良機。
其他好處:
- Excel格式的市場預測(ME)表
- 3個月的分析師支持
目錄
第1章:引言
- 市場分析與定義的前提條件
- 分析範圍
第2章 分析方法
第3章執行摘要
第4章 市場狀況
- 市場概覽
- 市場促進因素
- 飲料消費量增加,高檔包裝的需求也隨之成長
- 旨在推廣食品包裝材料可回收的監管措施。
- 都市區中產階級的壯大帶動了啤酒和軟性飲料的銷售量。
- 非洲大陸自由貿易區推動了非洲內部玻璃包裝產品的貿易。
- 精釀酒精飲料和手工烈酒的繁榮(對高階玻璃器皿的短期需求)
- 歐盟碳排放交易體系(CBAM)對低碳出口包裝施加的壓力
- 市場限制因素
- PET和鋁製輕質容器的普及
- 高昂的能源投入成本和電力可靠性成本
- 低效率的回收網路限制了食品玻璃屑的供應。
- 外匯波動和堿灰進口關稅
- 產業供應鏈分析
- 非洲容器玻璃熔爐的生產能力和位置
- 工廠位置及投產年份
- 生產能力
- 爐子的種類
- 玻璃的顏色
- 貨櫃玻璃的進出口資料:涵蓋主要進出口目的地。
- 進口量和進口額(2022-2025年)
- 出口量/出口額(2022-2025年)
- 波特五力分析
- 原料分析
- 玻璃包裝回收趨勢
- 玻璃包裝供需分析
第5章:預測市場規模與成長率
- 最終用戶
- 飲料
- 酒精飲料
- 啤酒
- 葡萄酒
- 烈酒
- 其他酒精飲料(蘋果酒和其他發酵飲料)
- 非酒精性
- 汁
- 碳酸飲料(CSD)
- 乳製品飲料
- 其他非酒精飲料
- 酒精飲料
- 食品(果醬、果凍、橘子醬、蜂蜜、香腸/調味品、油脂、醃菜)
- 化妝品和個人護理
- 藥品(不包括管瓶和安瓿)
- 香水
- 飲料
- 按顏色
- 綠色的
- 琥珀色
- 燧石(透明)
- 其他顏色
- 國家
- 埃及
- 奈及利亞
- 肯亞
- 摩洛哥
- 南非
- 其他非洲國家
第6章 競爭情勢
- 市場集中度
- 策略舉措和趨勢
- 各公司企業市場占有率分析(基於最新產能)
- 公司簡介
- Ardagh Group SA
- Beta Glass PLC
- Consol Glass Pty Ltd
- OI Glass, Inc.
- Verallia Packaging SAS
- Isanti Glass 1(Pty)Ltd
- Kandil Glass
- Middle East Glass Manufacturing Company SAE
- Saverglass SAS
- African Glass Limited
- The National Company for Glass and Crystal SAE
- Gerresheimer AG
- Arab Pharmaceutical Glass Company SAE
- Dalgen Packaging CC
- Nampak Limited
- United Glass Containers Company(UGC)
- Societe d'Exploitation de Verreries au Maroc(SEVAM)
第7章 市場機會與未來展望
According to Mordor Intelligence, the Africa glass bottles and Containers Market size is projected to expand from 4.73 Million tons in 2025 and 4.99 Million tons in 2026 to 6.36 Million tons by 2031, registering a CAGR of 4.97% between 2026 to 2031.
This report is Segmented by End-User (Beverages, Food, Cosmetics and Personal Care, and More), Color (Flint, Amber, Green, and More), and Geography (Egypt, Nigeria, Kenya, and More). The Market Forecasts are Provided in Terms of Volume (Tons).
Africa Glass Bottles And Containers Market Trends and Insights
Rising Beverage Consumption and Premium-Packaging Demand
Africa's accelerating thirst for branded beer, spirits, and carbonated soft drinks is lifting high-value glass demand far faster than headline population growth. East African Breweries recovered more than 17 million returnable bottles in fiscal 2024-2025, evidence that refillable glass stays core to beer economics even as PET advances in water and juice. Craft distillers such as Kenya's Procera Gin now specify embossing, screen-printing, and bespoke closures, pushing converters toward shorter production runs with higher unit margins. In West Africa, Beta Glass booked NGN 78.2 billion (USD 97.4 million) first-half 2025 revenue, underscoring steady pull-through from beverage fillers. As middle-income cohorts mature and premiumize consumption, this driver is expected to add about 1.2 percentage points to the baseline CAGR.
Regulatory Push For Food-grade, Recyclable Packaging
Governments are tightening disposal and safety standards, tilting the playing field toward infinitely recyclable glass. Kenya's 2024 EPR rules introduced a KSh 150 import levy on each glass item and mandated producers to take-back schemes, effectively shielding local output from low-cost imports. A South African feasibility study showed that a ZAR 1 deposit can raise collection to 90%, diverting roughly 305,000-477,000 tons from landfills. The African Union's 2024-2034 Circular Economy Action Plan fixes a 30% recycling target, giving manufacturers confidence to scale cullet infrastructure. These steps are forecast to lift the CAGR by 0.9 percentage points, with the sharpest early gains in Kenya and South Africa, where enforcement is already visible.
Proliferation of PET and aluminium lightweight formats
Cheaper, lighter plastics and cans are capturing share in soft drinks, water, and entry-level wine. Coca-Cola Hellenic Bottling Company opened a Lagos PET hub capable of converting 13,000 tons annually into food-grade rPET, intensifying brand owner preference for single-trip plastic in on-the-go channels. A recent International Aluminium Institute study placed glass at the top of the cost and emissions ladder per unit, reinforcing beverage firms' multiformat hedging. Bag-in-box already accounted for 49.4% of South African domestic wine packaging in 2023, underscoring the pressure on glass displacement. Collectively, these forces are expected to dilute CAGR by 0.8 percentage points over the near term.
Other drivers and restraints analyzed in the detailed report include:
- Urban Middle-class Expansion Boosting Beer And CSD Volumes
- AfCFTA-driven Intra-Africa Trade In Glass-packaged Goods
- High Energy-input And Power-reliability Costs
For complete list of drivers and restraints, kindly check the Table Of Contents.
Segment Analysis
Beverages accounted for 72.12% of 2025 volume, anchoring the Africa glass bottles and containers market leadership stack. Beer is the single largest sub-category, but premium spirits and wine sustain higher unit margins, especially in South Africa's export-focused Western Cape. East African Breweries' recovery of more than 17 million returnable bottles in fiscal 2024-2025 signals the entrenched dominance of refillable loops that favor glass over disposables. Non-alcoholic brands still lean on PET for value lines, though fluted glass remains the packaging of choice for premium juices.
Cosmetics and personal care is projected to grow at 5.88% through 2031, the fastest among all uses. Rising disposable income, strong adoption of online beauty, and the cachet of glass in fragrance and serums underpin demand. Arab Pharmaceutical Glass Company operates three furnaces, producing 1.25 million containers a day for pharma and beauty clients, demonstrating that quality-certified supply is available in-region. With global specialist Gerresheimer divesting its moulded-glass unit, regional converters see an opportunity to fill capability gaps and shorten lead times.
Complete Report Scope:
- By End-user
- Beverages
- Alcoholic
- Beer
- Wine
- Spirits
- Other Alcoholic Beverages (Cider and Other Fermented Drinks)
- Non-Alcoholic
- Juices
- Carbonated Drinks (CSDs)
- Dairy Product Based Drinks
- Other Non-Alcoholic Beverages
- Alcoholic
- Food (Jam, Jelly, Marmalades, Honey, Sausages and Condiments, Oil, Pickles)
- Cosmetics and Personal Care
- Pharmaceuticals (excluding Vials and Ampoules)
- Perfumery
- Beverages
- By Color
- Green
- Amber
- Flint
- Other Colors
- By Country
- Egypt
- Nigeria
- Kenya
- Morocco
- South Africa
- Rest of Africa
List of Companies Covered in this Report:
- Ardagh Group S.A.
- Beta Glass PLC
- Consol Glass Pty Ltd
- O-I Glass, Inc.
- Verallia Packaging S.A.S.
- Isanti Glass 1 (Pty) Ltd
- Kandil Glass
- Middle East Glass Manufacturing Company S.A.E.
- Saverglass SAS
- African Glass Limited
- The National Company for Glass and Crystal S.A.E.
- Gerresheimer AG
- Arab Pharmaceutical Glass Company S.A.E.
- Dalgen Packaging CC
- Nampak Limited
- United Glass Containers Company (UGC)
- Societe d'Exploitation de Verreries au Maroc (SEVAM)
Additional Benefits:
- The market estimate (ME) sheet in Excel format
- 3 months of analyst support
TABLE OF CONTENTS
1 INTRODUCTION
- 1.1 Study Assumptions and Market Definition
- 1.2 Scope of the Study
2 RESEARCH METHODOLOGY
3 EXECUTIVE SUMMARY
4 MARKET LANDSCAPE
- 4.1 Market Overview
- 4.2 Market Drivers
- 4.2.1 Rising Beverage Consumption and Premium-Packaging Demand
- 4.2.2 Regulatory Push for Food-grade, Recyclable Packaging
- 4.2.3 Urban Middle-class Expansion Boosting Beer and CSD Volumes
- 4.2.4 AfCFTA-driven Intra-Africa Trade in Glass-packaged Goods
- 4.2.5 Craft Alcohol and Artisan Spirits Boom (Short-run Premium Glass)
- 4.2.6 EU CBAM Pressure on Low-carbon Export Packaging
- 4.3 Market Restraints
- 4.3.1 Proliferation of PET and Aluminium Lightweight Formats
- 4.3.2 High Energy-input and Power-reliability Costs
- 4.3.3 Limited Food-grade Cullet Availability Due to Inefficient Collection Networks
- 4.3.4 Currency Volatility and Soda-ash Import Tariffs
- 4.4 Industry Supply-Chain Analysis
- 4.5 Container Glass Furnace Capacity and Locations in Africa
- 4.5.1 Plant Locations and Year of Commencement
- 4.5.2 Production Capacities
- 4.5.3 Types of Furnaces
- 4.5.4 Color of Glass Produced
- 4.6 Export-Import Data of Container Glass - Covering Key Import and Export Destinations
- 4.6.1 Import Volume and Value, 2022-2025
- 4.6.2 Export Volume and Value, 2022-2025
- 4.7 Porter's Five Forces Analysis
- 4.7.1 Threat of New Entrants
- 4.7.2 Bargaining Power of Suppliers
- 4.7.3 Bargaining Power of Buyers
- 4.7.4 Threat of Substitutes
- 4.7.5 Competitive Rivalry
- 4.8 Raw Material Analysis
- 4.9 Recycling Trends for Glass Packaging
- 4.10 Demand vs Supply Analysis for Glass Packaging
5 MARKET SIZE AND GROWTH FORECASTS (VOLUME)
- 5.1 By End-user
- 5.1.1 Beverages
- 5.1.1.1 Alcoholic
- 5.1.1.1.1 Beer
- 5.1.1.1.2 Wine
- 5.1.1.1.3 Spirits
- 5.1.1.1.4 Other Alcoholic Beverages (Cider and Other Fermented Drinks)
- 5.1.1.2 Non-Alcoholic
- 5.1.1.2.1 Juices
- 5.1.1.2.2 Carbonated Drinks (CSDs)
- 5.1.1.2.3 Dairy Product Based Drinks
- 5.1.1.2.4 Other Non-Alcoholic Beverages
- 5.1.1.1 Alcoholic
- 5.1.2 Food (Jam, Jelly, Marmalades, Honey, Sausages and Condiments, Oil, Pickles)
- 5.1.3 Cosmetics and Personal Care
- 5.1.4 Pharmaceuticals (excluding Vials and Ampoules)
- 5.1.5 Perfumery
- 5.1.1 Beverages
- 5.2 By Color
- 5.2.1 Green
- 5.2.2 Amber
- 5.2.3 Flint
- 5.2.4 Other Colors
- 5.3 By Country
- 5.3.1 Egypt
- 5.3.2 Nigeria
- 5.3.3 Kenya
- 5.3.4 Morocco
- 5.3.5 South Africa
- 5.3.6 Rest of Africa
6 COMPETITIVE LANDSCAPE
- 6.1 Market Concentration
- 6.2 Strategic Moves and Developments
- 6.3 Company Market Share Analysis, (Based on Latest Production Capacity)
- 6.4 Company Profiles (includes Global Level Overview, Market Level Overview, Core Segments, Financials as available, Strategic Information, Market Rank/Share, Products and Services, Recent Developments)
- 6.4.1 Ardagh Group S.A.
- 6.4.2 Beta Glass PLC
- 6.4.3 Consol Glass Pty Ltd
- 6.4.4 O-I Glass, Inc.
- 6.4.5 Verallia Packaging S.A.S.
- 6.4.6 Isanti Glass 1 (Pty) Ltd
- 6.4.7 Kandil Glass
- 6.4.8 Middle East Glass Manufacturing Company S.A.E.
- 6.4.9 Saverglass SAS
- 6.4.10 African Glass Limited
- 6.4.11 The National Company for Glass and Crystal S.A.E.
- 6.4.12 Gerresheimer AG
- 6.4.13 Arab Pharmaceutical Glass Company S.A.E.
- 6.4.14 Dalgen Packaging CC
- 6.4.15 Nampak Limited
- 6.4.16 United Glass Containers Company (UGC)
- 6.4.17 Societe d'Exploitation de Verreries au Maroc (SEVAM)
7 MARKET OPPORTUNITIES AND FUTURE OUTLOOK
- 7.1 White-space and Unmet-Need Assessment

 亞太地區玻璃瓶和容器:市場佔有率分析、行業趨勢和統計數據以及成長預測(2026-2031 年)玻璃瓶和容器:市場佔有率分析、行業趨勢和統計數據、成長預測(2026-2031)歐洲玻璃瓶和容器:市場佔有率分析、行業趨勢和統計數據以及成長預測(2026-2031 年)北美玻璃瓶和容器:市場佔有率分析、行業趨勢和統計數據以及成長預測(2026-2031 年)
 玻璃瓶和容器市場規模、佔有率和成長分析(按產品、應用、顏色、最終用途產業和地區分類)—產業預測(2026-2033 年)
 2025-2029年全球玻璃瓶與容器市場英國玻璃瓶和容器:市場佔有率分析、行業趨勢和成長預測(2025-2030 年)中東和非洲玻璃瓶和容器市場佔有率分析、行業趨勢、統計數據和成長預測(2025-2030)拉丁美洲玻璃瓶和容器:市場佔有率分析、行業趨勢和成長預測(2025-2030)
 玻璃瓶及容器市場機會、成長動力、產業趨勢分析及 2025 - 2034 年預測