


 |
市場調查報告書
商品編碼
2121976
玻璃瓶和容器:市場佔有率分析、行業趨勢和統計數據、成長預測(2026-2031)Glass Bottles And Containers - Market Share Analysis, Industry Trends & Statistics, Growth Forecasts (2026 - 2031) |
||||||

※ 本網頁內容可能與最新版本有所差異。詳細情況請與我們聯繫。
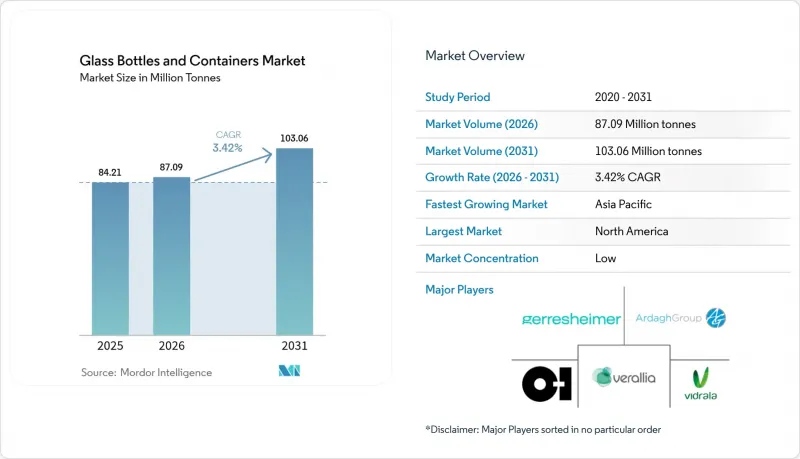
根據 Mordor Intelligence 預測,玻璃瓶和容器的市場規模預計將從 2025 年的 8,421 萬噸成長到 2026 年的 8,709 萬噸,並將從 2026 年到 2031 年以 3.42% 的複合年成長率成長,到 2031 年達到 1.031 年達到 1.0306 億噸。
本報告按最終用戶(飲料[酒精飲料(啤酒、葡萄酒、烈酒等)和非酒精飲料(碳酸飲料(CSD)、乳製品飲料等)]、食品[果醬和果凍、調味品和醬料等]、化妝品和個人護理用品、其他)、顏色(燧石色、琥珀色、綠色、其他)和地區進行細分。市場預測以數量(噸)為單位。
全球玻璃瓶及容器市場趨勢及洞察
塑膠禁令正在推動可回收玻璃包裝的普及。
加州SB 54法案規定,到2032年一次性塑膠包裝的使用量必須減少65%。法國從2025年1月起禁止使用發泡聚苯乙烯食品容器,迫使品牌商轉向玻璃包裝。歐盟正在審議的雙酚A法規進一步加速了食品接觸產業的轉型。玻璃包裝形成了一個無限閉合迴路,並擁有完善的上門回收系統,這使得加工商能夠在承擔設備升級成本的同時,獲得新的市場需求。大型零售商店的飲料和調味品重新採用玻璃容器,便是這種轉變的明顯體現。雖然玻璃廢料的供應暫時緊張,但混合熔爐和輕量化技術的引入將在一定程度上緩解利潤率的壓力,預計在整個預測期內,市場需求將持續成長。
高階美妝市場的「玻璃化」趨勢正在推動瓶罐的生產量成長。
高階護膚和香水品牌正擴大採用玻璃瓶包裝,以彰顯其卓越品質和環保理念。 Veralia 的「Vista」瓶身採用 100% 回收消費品 (PCR) 材料製成,與使用原生材料生產相比,能耗降低了 40%,這表明循環經濟與高階美學可以兼得。壓紋、漸層色和可重複填充設計增強了產品在商店的差異化,也使其定價更具合理性。由於包裝成本在美妝產業的零售價格中所佔比例較小,因此品牌能夠比大眾市場飲料更容易承擔單位成本的增加。這一趨勢正在全球蔓延,尤其在北美和西歐地區更為顯著,從而推動了對客製化模具和小批量生產的長期需求。
能源價格波動威脅著熔爐的獲利能力。
2024年,英國電價飆升至歷史新高,迫使玻璃製造商在尖峰時段時段關閉生產線。由於能源成本約佔生產成本的18%,價格波動可能導致利潤率下降的速度超過市場價格調整的速度。碳定價體系進一步限制了石化燃料的消耗,加速了對混合反應器和現場可再生能源的資本投資。相較之下,儘管OI Glass獲得了1.25億美元的聯邦脫碳資金,但其小規模的本地工廠面臨融資壓力,這可能會限制短期供應。
區域分析
預計到2025年,北美將佔據全球玻璃包裝市場55.18%的佔有率。這主要歸功於其成熟的家庭垃圾收集系統以及企業永續發展目標,這些目標鼓勵使用高比例的玻璃屑玻璃。玻璃包裝協會提出的2030年達到50%回收率的藍圖,為長期穩定的原料供應提供了保障。然而,能源價格波動以及rPET在高價值飲料領域的滲透率不斷提高,正在抑制玻璃銷售量的成長,因此,企業的策略重點正轉向頂級烈酒和美容護理產品。
歐洲的碎玻璃產量落後於北美,但歐盟高達80.8%的回收率使其受益匪淺,有助於保障玻璃屑並降低熔爐的能源需求。 Ardagh和Verallia正在投資建造電輔助和氫氣相容的熔爐,以應對碳價波動,同時維持產量水準。然而,不斷上漲的電價和環境稅正在擠壓短期利潤空間,促使企業加強在基於可再生能源的共用微電網和跨境玻璃屑貿易方面的合作。
亞太地區是成長最快的地區,預計到2031年將以4.76%的複合年成長率成長,迅速縮小玻璃包裝市場的差距。印度和中國正在新建設的製藥廠,需要無菌管瓶;而韓國和日本則進口優質化妝品玻璃用於高階護膚品。 OI Glass在哥倫比亞錫帕基拉投資1.2億美元升級工廠,顯示製造商正在新興地區採用世界一流的技術來滿足市場需求,同時遵守ESG(環境、社會和治理)要求。東南亞部分地區玻璃屑,限制了再生材料的使用,使其在成本上與歐美同行相比處於劣勢。儘管如此,收入的成長和循環經濟法規的推進預計將在長期內推動強勁的需求。
其他好處:
- Excel格式的市場預測(ME)表
- 3個月的分析師支持
目錄
第1章:引言
- 研究假設和市場定義
- 調查範圍
第2章:調查方法
第3章執行摘要
第4章 市場狀況
- 市場概覽
- 市場促進因素
- 禁止使用塑膠的運動正在推動可回收玻璃包裝的轉變。
- 高階美容產業「玻璃化」趨勢正在推動瓶罐包裝產品的銷售。
- 製藥業灌裝和表面處理工程的擴展正在推動對玻璃管瓶的需求上升。
- 精釀酒的蓬勃發展帶動了對客製化玻璃容器的需求。
- 外商直接投資資助的混合熔爐擴大了環保玻璃的生產能力。
- ESG合規性正在推動出口市場轉向高玻璃屑玻璃。
- 市場限制因素
- 能源價格波動正在威脅冶煉爐的獲利能力。
- 在對物流較敏感的通路中,rPET 瓶的採用正在對玻璃瓶的市場佔有率造成壓力。
- 玻璃屑收集基礎設施不足限制了再生材料的利用。
- 長途運輸過程中因破損造成的損失正在減少玻璃的使用。
- 產業供應鏈分析
- 全球容器用玻璃熔爐產能及位置
- 工廠位置及投產年份
- 生產能力
- 爐子的種類
- 玻璃的顏色
- 貨櫃玻璃的進出口資料-涵蓋主要進出口目的地。
- 2021年至2024年進口量及進口額
- 2021年至2024年出口量及出口額
- 波特五力分析
- 原料分析
- 玻璃包裝回收趨勢
- 玻璃包裝供需分析
第5章 市場規模與成長預測
- 最終用戶
- 飲料
- 酒精飲料
- 啤酒
- 葡萄酒
- 烈酒
- 其他酒精飲料(蘋果酒和其他發酵飲料)
- 非酒精性
- 汁
- 碳酸飲料(CSD)
- 乳製品飲料
- 其他非酒精飲料
- 酒精飲料
- 食品(果醬、果凍、橘子醬、蜂蜜、香腸和調味品、食用油、醃菜)
- 化妝品和個人護理
- 藥品(不包括管瓶和安瓿)
- 香水
- 飲料
- 按顏色
- 綠色的
- 琥珀色
- 燧石
- 其他顏色
- 按地區
- 北美洲
- 美國
- 加拿大
- 墨西哥
- 南美洲
- 巴西
- 阿根廷
- 其他南美國家
- 歐洲
- 英國
- 德國
- 法國
- 義大利
- 西班牙
- 俄羅斯
- 其他歐洲國家
- 亞太地區
- 中國
- 日本
- 印度
- 韓國
- 澳洲
- 其他亞太國家
- 中東和非洲
- 中東
- 阿拉伯聯合大公國
- 沙烏地阿拉伯
- 土耳其
- 其他中東國家
- 非洲
- 南非
- 奈及利亞
- 其他非洲國家
- 中東
- 北美洲
第6章 競爭情勢
- 市場集中度
- 策略舉措和趨勢
- 各公司企業市場占有率分析(基於最新產能)
- 公司簡介
- OI Glass, Inc.
- Verallia SA
- Ardagh Group SA
- Vidrala SA
- Vetropack Holding AG
- Gerresheimer AG
- SGD SA
- Stoelzle Oberglas GmbH
- Wiegand-Glas Holding GmbH
- Hindusthan National Glass & Industries Limited
- Piramal Glass Private Limited
- Nihon Yamamura Glass Co., Ltd.
- Sisecam
- Compagnie de Saint-Gobain SA(Packaging division)
- Heinz-Glas GmbH & Co. KGaA
- Vitro, SAB de CV
- BA Glass BV
- Ciner Glass Holdings Limited
第7章 市場機會與未來展望
According to Mordor Intelligence, the glass bottles and Containers market size is expected to grow from 84.21 million tonnes in 2025 to 87.09 million tonnes in 2026 and is forecast to reach 103.06 million tonnes by 2031 at 3.42% CAGR over 2026-2031.
This report is Segmented by End-User (Beverages [Alcoholic {Beer, Wine, Spirits, and More}, and Non-Alcoholic {Carbonated Drinks (CSDs), Dairy Product Based Drinks, and More}], Food [Jam and Jelly, Condiments and Sauces, and More], Cosmetics and Personal Care, and More), Color (Flint, Amber, Green, and More) and Geography. The Market Forecasts are Provided in Terms of Volume (Tonnes).
Global Glass Bottles And Containers Market Trends and Insights
Plastic Bans Drive Shift to Recyclable Glass Packaging
California's SB 54 mandates a 65% cut in single-use plastic packaging by 2032, while France has barred expanded polystyrene food containers from January 2025, propelling brand owners to switch to glass. The European Union's pending bisphenol-A restrictions further reinforce conversion in food contact segments. Because glass maintains an endless closed loop and established curb-side collection, converters are capturing new volumes even as they absorb retooling costs. The ripple effect is evident in beverage and condiment lines moving back to glass at big-box retailers. Though cullet supply tightens temporarily, hybrid furnaces and lightweighting partially offset margin compression, paving a sustained uplift through the forecast horizon.
Prestige Beauty "Glassification" Trend Lifts Jar and Bottle Volumes
Luxury skincare and fragrance brands increasingly adopt glass to signal premium quality and environmental stewardship. Verallia's 100% post-consumer-recycled (PCR) Vista bottles cut energy use by 40% versus virgin production, proving that circularity can coexist with high-end aesthetics.Embossing, color gradations, and refillable designs amplify shelf differentiation and justify higher price points. Since packaging cost is a small share of retail value in beauty, brands absorb higher unit costs more easily than mass-market beverages. The trend scales globally but is most pronounced in North America and Western Europe, reinforcing long-tail demand for custom molds and short production runs.
Energy Price Volatility Threatens Furnace Economics
Electricity prices in the United Kingdom spiked to record levels in 2024, compelling glassmakers to idle lines during peak tariffs. Energy constitutes roughly 18% of production costs, so volatility can erase margins faster than price adjustments reach the market. Carbon-pricing schemes further penalize fossil-fuel consumption, intensifying capital commitments toward hybrid furnaces and on-site renewables. In contrast, O-I Glass secured USD 125 million in federal funding for decarbonization, but smaller regional plants face liquidity strains, potentially curbing short-term supply.
Other drivers and restraints analyzed in the detailed report include:
- Pharma Fill-Finish Expansion Boosts Demand for Glass Vials
- Craft Alcohol Boom Spurs Custom Glass Container Demand
- rPET Bottle Adoption Undercuts Glass in Logistics-Sensitive Channels
For complete list of drivers and restraints, kindly check the Table Of Contents.
Geography Analysis
North America captured 55.18% of the container glass packaging market in 2025, leveraging mature curbside collection and corporate sustainability goals that encourage high-cullet recipes. The Glass Packaging Institute's roadmap to reach a 50% recycling rate by 2030 underpins the long-term feedstock base. Yet energy-price swings and growing rPET penetration in value beverages temper volume gains, shifting strategic emphasis toward premium spirits and beauty care.
Europe trails but benefits from the EU's 80.8% recycling rate, which secures cullet and lowers furnace energy demand. Ardagh and Verallia are investing in electric-boost and hydrogen-ready furnaces to hedge carbon-pricing exposure while maintaining output. However, power-price stress and environmental levies suppress near-term margins, sparking collaboration on shared renewable micro-grids and cross-border cullet trade.
Asia Pacific is the fastest-growing region, expanding 4.76% CAGR through 2031 and rapidly closing the gap in the container glass packaging market. India and China build greenfield pharmaceutical plants that require sterile vials, while South Korea and Japan import premium cosmetic glass for luxury skincare. O-I Glass's USD 120 million upgrade in Zipaquira, Colombia, signals how producers replicate best-in-class technology in emerging regions to capture demand while aligning with ESG mandates. Limited cullet infrastructure in parts of Southeast Asia constrains recycled content, creating cost penalties versus Western peers; nevertheless, rising incomes and regulatory push for circularity promise robust long-term demand.
- O-I Glass, Inc.
- Verallia S.A.
- Ardagh Group S.A.
- Vidrala S.A.
- Vetropack Holding AG
- Gerresheimer AG
- SGD S.A.
- Stoelzle Oberglas GmbH
- Wiegand-Glas Holding GmbH
- Hindusthan National Glass & Industries Limited
- Piramal Glass Private Limited
- Nihon Yamamura Glass Co., Ltd.
- Sisecam
- Compagnie de Saint-Gobain S.A. (Packaging division)
- Heinz-Glas GmbH & Co. KGaA
- Vitro, S.A.B. de C.V.
- BA Glass B.V.
- Ciner Glass Holdings Limited
Additional Benefits:
- The market estimate (ME) sheet in Excel format
- 3 months of analyst support
TABLE OF CONTENTS
1 INTRODUCTION
- 1.1 Study Assumptions and Market Definition
- 1.2 Scope of the Study
2 RESEARCH METHODOLOGY
3 EXECUTIVE SUMMARY
4 MARKET LANDSCAPE
- 4.1 Market Overview
- 4.2 Market Drivers
- 4.2.1 Plastic Bans Drive Shift to Recyclable Glass Packaging
- 4.2.2 Prestige Beauty "Glassification" Trend Lifts Jar and Bottle Volumes
- 4.2.3 Pharma Fill-Finish Expansion Boosts Demand for Glass Vials
- 4.2.4 Craft Alcohol Boom Spurs Custom Glass Container Demand
- 4.2.5 FDI-Funded Hybrid Furnaces Expand Green Glass Capacity
- 4.2.6 ESG Compliance Spurs Shift to High-Cullet Glass for Export Markets
- 4.3 Market Restraints
- 4.3.1 Energy Price Volatility Threatens Furnace Economics
- 4.3.2 rPET Bottle Adoption Undercuts Glass in Logistics-Sensitive Channels
- 4.3.3 Weak Cullet Collection Infrastructure Limits Recycled Content
- 4.3.4 Breakage Losses in Long-Haul Shipping Discourage Glass Use
- 4.4 Industry Supply-Chain Analysis
- 4.5 Container Glass Furnace Capacity and Locations in Global
- 4.5.1 Plant Locations and Year of Commencement
- 4.5.2 Production Capacities
- 4.5.3 Types of Furnaces
- 4.5.4 Color of Glass Produced
- 4.6 Export-Import Data of Container Glass - Covering Key Import and Export Destinations
- 4.6.1 Import Volume and Value, 2021-2024
- 4.6.2 Export Volume and Value, 2021-2024
- 4.7 Porter's Five Forces Analysis
- 4.7.1 Threat of New Entrants
- 4.7.2 Bargaining Power of Suppliers
- 4.7.3 Bargaining Power of Buyers
- 4.7.4 Threat of Substitutes
- 4.7.5 Competitive Rivalry
- 4.8 Raw Material Analysis
- 4.9 Recycling Trends for Glass Packaging
- 4.10 Demand vs Supply Analysis for Glass Packaging
5 MARKET SIZE AND GROWTH FORECASTS (VOLUME)
- 5.1 By End-user
- 5.1.1 Beverages
- 5.1.1.1 Alcoholic
- 5.1.1.1.1 Beer
- 5.1.1.1.2 Wine
- 5.1.1.1.3 Spirits
- 5.1.1.1.4 Other Alcoholic Beverages (Cider and Other Fermented Drinks)
- 5.1.1.2 Non-Alcoholic
- 5.1.1.2.1 Juices
- 5.1.1.2.2 Carbonated Drinks (CSDs)
- 5.1.1.2.3 Dairy Product Based Drinks
- 5.1.1.2.4 Other Non-Alcoholic Beverages
- 5.1.1.1 Alcoholic
- 5.1.2 Food (Jam, Jelly, Marmalades, Honey, Sausages and Condiments, Oil, Pickles)
- 5.1.3 Cosmetics and Personal Care
- 5.1.4 Pharmaceuticals (excluding Vials and Ampoules)
- 5.1.5 Perfumery
- 5.1.1 Beverages
- 5.2 By Color
- 5.2.1 Green
- 5.2.2 Amber
- 5.2.3 Flint
- 5.2.4 Other Colors
- 5.3 By Geography
- 5.3.1 North America
- 5.3.1.1 United States
- 5.3.1.2 Canada
- 5.3.1.3 Mexico
- 5.3.2 South America
- 5.3.2.1 Brazil
- 5.3.2.2 Argentina
- 5.3.2.3 Rest of South America
- 5.3.3 Europe
- 5.3.3.1 United Kingdom
- 5.3.3.2 Germany
- 5.3.3.3 France
- 5.3.3.4 Italy
- 5.3.3.5 Spain
- 5.3.3.6 Russia
- 5.3.3.7 Rest of Europe
- 5.3.4 Asia Pacific
- 5.3.4.1 China
- 5.3.4.2 Japan
- 5.3.4.3 India
- 5.3.4.4 South Korea
- 5.3.4.5 Australia
- 5.3.4.6 Rest of Asia Pacific
- 5.3.5 Middle East and Africa
- 5.3.5.1 Middle East
- 5.3.5.1.1 United Arab Emirates
- 5.3.5.1.2 Saudi Arabia
- 5.3.5.1.3 Turkey
- 5.3.5.1.4 Rest of Middle East
- 5.3.5.2 Africa
- 5.3.5.2.1 South Africa
- 5.3.5.2.2 Nigeria
- 5.3.5.2.3 Rest of Africa
- 5.3.5.1 Middle East
- 5.3.1 North America
6 COMPETITIVE LANDSCAPE
- 6.1 Market Concentration
- 6.2 Strategic Moves and Developments
- 6.3 Company Market Share Analysis, (Based on Latest Production Capacity)
- 6.4 Company Profiles (includes Global level Overview, Market level overview, Core Segments, Financials as available, Strategic Information, Market Rank/Share for key companies, Products and Services, and Recent Developments)
- 6.4.1 O-I Glass, Inc.
- 6.4.2 Verallia S.A.
- 6.4.3 Ardagh Group S.A.
- 6.4.4 Vidrala S.A.
- 6.4.5 Vetropack Holding AG
- 6.4.6 Gerresheimer AG
- 6.4.7 SGD S.A.
- 6.4.8 Stoelzle Oberglas GmbH
- 6.4.9 Wiegand-Glas Holding GmbH
- 6.4.10 Hindusthan National Glass & Industries Limited
- 6.4.11 Piramal Glass Private Limited
- 6.4.12 Nihon Yamamura Glass Co., Ltd.
- 6.4.13 Sisecam
- 6.4.14 Compagnie de Saint-Gobain S.A. (Packaging division)
- 6.4.15 Heinz-Glas GmbH & Co. KGaA
- 6.4.16 Vitro, S.A.B. de C.V.
- 6.4.17 BA Glass B.V.
- 6.4.18 Ciner Glass Holdings Limited
7 MARKET OPPORTUNITIES AND FUTURE OUTLOOK
- 7.1 White-space and Unmet-Need Assessment

 亞太地區玻璃瓶和容器:市場佔有率分析、行業趨勢和統計數據以及成長預測(2026-2031 年)非洲玻璃瓶與容器:市場佔有率分析、產業趨勢與統計、成長預測(2026-2031 年)歐洲玻璃瓶和容器:市場佔有率分析、行業趨勢和統計數據以及成長預測(2026-2031 年)北美玻璃瓶和容器:市場佔有率分析、行業趨勢和統計數據以及成長預測(2026-2031 年)
 玻璃瓶和容器市場規模、佔有率和成長分析(按產品、應用、顏色、最終用途產業和地區分類)—產業預測(2026-2033 年)
 2025-2029年全球玻璃瓶與容器市場英國玻璃瓶和容器:市場佔有率分析、行業趨勢和成長預測(2025-2030 年)中東和非洲玻璃瓶和容器市場佔有率分析、行業趨勢、統計數據和成長預測(2025-2030)拉丁美洲玻璃瓶和容器:市場佔有率分析、行業趨勢和成長預測(2025-2030)
 玻璃瓶及容器市場機會、成長動力、產業趨勢分析及 2025 - 2034 年預測