


 |
市場調查報告書
商品編碼
2120812
北美玻璃瓶和容器:市場佔有率分析、行業趨勢和統計數據以及成長預測(2026-2031 年)North America Glass Bottles And Containers - Market Share Analysis, Industry Trends & Statistics, Growth Forecasts (2026 - 2031) |
||||||

※ 本網頁內容可能與最新版本有所差異。詳細情況請與我們聯繫。
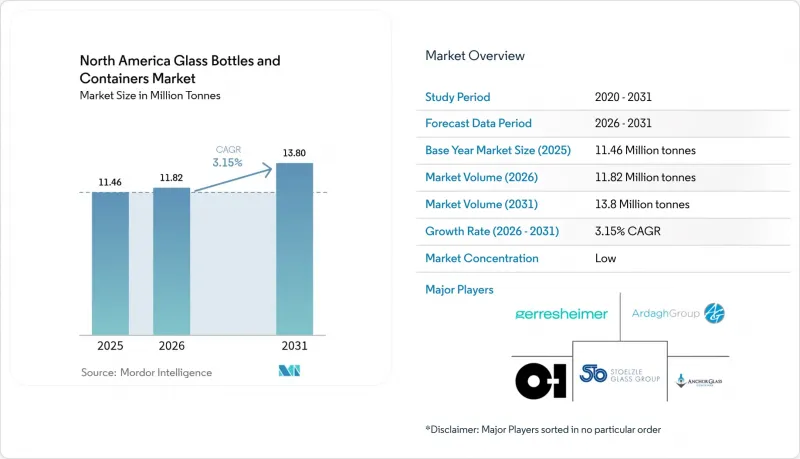
據 Mordor Intelligence 稱,北美玻璃瓶和容器市場預計到 2026 年將達到 1,182 萬噸,高於 2025 年的 1,146 萬噸,預計到 2031 年將達到 1,380 萬噸。
預計從 2026 年到 2031 年,其複合年成長率將達到 3.15%。
本報告按最終用戶(飲料[酒精飲料(啤酒、葡萄酒、烈酒和其他酒精飲料)和非酒精飲料(碳酸飲料、乳製品飲料等)]、食品[果醬和果凍、調味品和醬料等]、化妝品和個人護理用品以及其他)和顏色(燧石色、琥珀色及其他)進行細分。市場預測以噸為單位。
北美玻璃瓶和容器市場的趨勢和洞察
電子商務的成長正在推動對耐用、高階包裝的需求。
預計2024年至2029年間,美國線上零售交易量將激增53%,品牌商正日益尋求能夠經受多階段運輸考驗並維持產品美觀的堅固解決方案。玻璃瓶恰好滿足了這兩項要求。它們不僅能承受擠壓,還能創造獨特的「開啟」體驗,進而提升直銷模式的消費者忠誠度。如今,訂閱盒中常見的化妝品、手工調味品和特色飲品,都開始採用客製化的保護內襯,並搭配輕質玻璃容器,以最大限度地減少破損。履約中心也擴大採用針對標準250毫升和500毫升瓶型客製化的自動化填充生產線,從而降低處理成本。隨著末端配送網路中溫控服務的日益完善,冷鏈飲料經銷商無需依賴多層塑膠即可保持其高階定位。最佳化的物流與消費者意識的提升,鞏固了玻璃在北美玻璃瓶及容器市場的標準地位。
精釀飲品的蓬勃發展帶動了對客製化玻璃瓶的需求。
光是在美國,2024年就新增了300多家釀酒廠和250多家精釀啤酒廠,每家都強調其獨特的地域特色和商店差異化。壓印的標誌、不規則的瓶肩形狀和軟木塞瓶頸已成為標誌性特徵,在品嚐室中創造了溢價。過去需要50萬件以上產量才能獲利的客製化模具,如今只需5萬件即可經濟高效地生產,這得益於模組化模具和3D砂型鑄造技術。加拿大蘋果酒生產商也緊跟著這個前置作業時間,進口彩色燧石玻璃和琥珀色玻璃的混合產品,兼具紫外線防護功能和清澈透明的吸引力。肯塔基州、密蘇裡州和安大略省的區域玻璃工廠受益於更短的交貨週期,這不僅減少了運輸排放,也加強了他們對永續性的承諾。所有這些因素共同提升了北美玻璃瓶和容器市場中客製化形狀產品的附加價值。
回收基礎設施的缺乏限制了玻璃屑的供應。
玻璃回收率差異巨大,從奧勒岡州的73%到伊利諾伊州的8%不等,這限制了可靠的再生原料來源。農村城鎮往往缺乏足夠的回收點,迫使運輸商將混色玻璃屑掩埋。戰略材料公司(Strategic Materials Inc.)經營42家加工廠,但其業務範圍仍未涵蓋美國一半以上的縣。隨著玻璃屑供應的減少,批量配方不得不重新使用原生鈉鈣玻璃,導致燃料消耗增加15%,碳排放性能下降。太平洋西北地區等資源豐富的地區的製造商比中西部地區的同行每噸成本高出15美元,這進一步加劇了北美玻璃瓶和容器市場的區域不平衡。
細分市場分析
2025年,飲料製造商的銷售額佔北美玻璃瓶及容器市場的61.02%。這主要得益於精釀啤酒、頂級烈酒和機能飲料的成熟消費。針對酒精飲料包裝中使用塑膠的法規進一步鞏固了玻璃作為維持風味和傳遞品牌傳承的首選包裝的地位。由於SKU(庫存單位)的增加抵消了主流啤酒銷售量成長放緩的影響,預計該細分市場將保持穩定的個位數低成長。由於採用了先前僅用於烈酒的波紋瓶頸設計和壓花工藝,高階調酒飲料和即飲雞尾酒的平均售價有所上漲。化妝品和個人護理產業雖然市場規模較小,但預計到2031年將維持3.6%的複合年成長率,超過北美玻璃瓶及容器市場所有其他終端用途的成長速度。高階護膚品牌專注於使用厚實的罐子,以營造奢華感和可重複使用性,而奢侈品百貨商店中設立的補充裝站則鼓勵顧客再次光顧。
製藥業的需求受益於FDA 2024年發布的綜合指南,該指南簡化了I型硼矽酸管瓶的檢驗流程。因此,合約研發生產機構(CDMO)正在擴大其管瓶產品種類,從而促進醫用玻璃的生產。食品業,包括高檔果醬、蘸醬和冷壓,透過使用透明玻璃瓶來凸顯產品的天然紋理和工藝,保持著利基市場的成長。總體而言,這些產業多元化的需求成長支撐著北美玻璃瓶和容器市場規模的長期穩定。
其他好處:
- Excel格式的市場預測(ME)表
- 3個月的分析師支持
目錄
第1章:引言
- 研究假設和市場定義
- 調查範圍
第2章:調查方法
第3章執行摘要
第4章 市場狀況
- 市場概覽
- 市場促進因素
- 電子商務的成長正在推動對耐用、優質包裝的需求。
- 精釀飲料的蓬勃發展帶動了對客製化玻璃瓶的需求。
- 由於玻璃具有永續性和優異的可回收性,因此人們選擇玻璃而不是塑膠。
- 生產者責任延伸制度(EPR)正在促進玻璃製品的普及。
- 壓花和藝術化的表面處理有助於打造差異化品牌。
- 消費者對更健康包裝的需求正在推動玻璃容器的普及。
- 市場限制因素
- 由於缺乏回收基礎設施,玻璃屑的供應有限。
- 重量和搬運易碎性推高了最後一公里配送成本。
- 塑膠和金屬包裝材料在批量生產的商品中仍然佔據主導地位。
- 高爐能源需求增加,加劇碳排放風險。
- 產業供應鏈分析
- 北美容器玻璃熔爐的生產能力和位置
- 工廠位置及投產年份
- 生產能力
- 爐子的種類
- 玻璃的顏色
- 貨櫃玻璃的進出口資料-涵蓋主要進出口目的地。
- 2021年至2024年進口量及進口額
- 2021年至2024年出口量及出口額
- 波特五力分析
- 原料分析
- 玻璃包裝回收趨勢
- 玻璃包裝供需分析
第5章 市場規模與成長預測
- 最終用戶
- 飲料
- 酒精飲料
- 啤酒
- 葡萄酒
- 烈酒
- 其他酒精飲料(蘋果酒和其他發酵飲料)
- 不含酒精的飲料
- 汁
- 碳酸飲料(CSD)
- 乳製品飲料
- 其他非酒精飲料
- 酒精飲料
- 食品(果醬、果凍、橘子醬、蜂蜜、香腸和調味品、食用油、醃菜)
- 化妝品和個人護理
- 藥品(不包括管瓶和安瓿)
- 香水
- 飲料
- 按顏色
- 綠色的
- 琥珀色
- 燧石
- 其他顏色
- 國家
- 美國
- 加拿大
- 墨西哥
第6章 競爭情勢
- 市場集中度
- 策略舉措和趨勢
- 各公司企業市場占有率分析(基於最新產能)
- 公司簡介
- OI Glass, Inc.
- Ardagh Group SA
- Anchor Glass Container Corporation
- Gerresheimer AG
- Stoelzle Glass Group
- Berlin Packaging LLC
- TricorBraun Inc.
- Kaufman Container
- O.Berk Company, LLC
- MJS Packaging
- Burch Bottle & Packaging, Inc.
- General Bottle Supply
- Pacific Vial Manufacturing Inc.
- North Mountain Supply
- Silver Spur Corporation
- Glassnow, Inc.
- Love Bottle LLC
- Vitro Packaging LLC
- Gallo Glass Company
- The Cary Company
第7章 市場機會與未來展望
According to Mordor Intelligence, North America glass bottles and Containers Market size in 2026 is estimated at 11.82 million tonnes, growing from 2025 value of 11.46 million tonnes with 2031 projections showing 13.8 million tonnes, growing at 3.15% CAGR over 2026-2031.
This report is Segmented by End-User (Beverages [Alcoholic {Beer, Wine, Spirits, Other Alcoholic Beverages}, and Non-Alcoholic {Carbonated Drinks (CSDs), Dairy Product Based Drinks, and More}], Food [Jam and Jelly, Condiments and Sauces, and More], Cosmetics and Personal Care, and More), Color (Flint, Amber, and More). The Market Forecasts are Provided in Terms of Volume (Tonnes).
North America Glass Bottles And Containers Market Trends and Insights
E-commerce growth drives demand for durable, premium packaging
U.S. online retail volume is expected to jump 53% between 2024 and 2029, compelling brands to seek rigid solutions that survive multi-stage shipping while preserving product aesthetics. Glass bottles satisfy both requirements; they resist compression forces and create a signature "unboxing" moment that strengthens direct-to-consumer loyalty. Cosmetics, artisanal condiments, and niche beverages, all common in subscription boxes, now specify custom protective inserts that pair with lightweight glass formats to minimize breakage. Fulfillment centers increasingly incorporate automated void-fill lines calibrated for standard 250-mL and 500-mL bottle footprints, lowering handling costs. As last-mile networks refine temperature-controlled services, cold-chain beverage sellers can maintain premium positioning without resorting to multilayer plastics. Together, logistics optimization and consumer perception cement glass as the go-to vessel within the North America glass bottles and containers market.
Craft beverage boom fuels demand for custom glass bottles
The United States added more than 300 distilleries and 250 microbreweries in 2024 alone, each emphasizing localized identity and shelf differentiation. Embossed logos, non-uniform shoulder profiles, and cork-finish necks have become hallmark cues that command pricing premiums in tasting rooms. Custom molds, once viable only above 500,000-unit runs, are now economical at 50,000 units thanks to modular tooling and 3-D sand-printing of blanks. Canadian cideries echo the trend, importing colored flint/amber hybrids that blend UV protection with see-through appeal. Regional glasshouses in Kentucky, Missouri, and Ontario benefit from short lead times, cutting freight emissions and reinforcing sustainability stories. These factors combine to lift value throughput for customized formats inside the North America glass bottles and containers market.
Recycling infrastructure gaps limit cullet availability
Glass collection varies from Oregon's 73% to Illinois's 8%, constraining a reliable secondary feedstock stream. Rural towns often lack drop-off depots, forcing haulers to landfill mixed-color cullet. Strategic Materials Inc. runs 42 processing plants, yet still covers fewer than half of the U.S. counties. When cullet supply dips, batch recipes revert to virgin soda-lime, raising fuel use by 15% and eroding carbon credentials. Manufacturers in well-served corridors like the Pacific Northwest enjoy cost advantages of USD 15 per ton over Midwest peers, exacerbating regional imbalances inside the North America glass bottles and containers market.
Other drivers and restraints analyzed in the detailed report include:
- Sustainability push and recyclability favor glass over plastic
- Extended Producer Responsibility programs promote glass adoption
- Weight and fragility increase last-mile delivery costs
For complete list of drivers and restraints, kindly check the Table Of Contents.
Segment Analysis
Sales to beverage producers represented 61.02% of the North America glass bottles and containers market in 2025, thanks to entrenched craft-beer, premium-spirits, and functional-drink consumption. Regulatory limits on plastics in alcoholic packaging further entrench glass as the default for flavor preservation and brand heritage storytelling. The segment is projected to chart stable low-single-digit gains as SKU proliferation offsets plateauing mainstream beer volumes. Premium mixers and ready-to-drink cocktails tap fluted neck designs and embossing cues previously reserved for spirits, elevating average selling prices. Cosmetics and personal care, while having a smaller base, are forecast to post a 3.6% CAGR through 2031, outpacing all other end-uses within the North America glass bottles and containers market. Luxury skincare labels emphasize thick-walled jars that convey heft and reusability; refill stations in prestige department stores spur repeat visits.
Pharmaceutical demand benefits from the FDA's 2024 consolidated guidance, which streamlines validation for Type I borosilicate vials. Contract development and manufacturing organizations (CDMOs) therefore broaden vial portfolios, lifting medical-grade glass production. Food segments such as gourmet jams, dipping sauces, and cold-pressed oils sustain niche growth, leveraging transparent glass to showcase natural textures and reinforce artisanal positioning. Collectively, diversified uptake across these verticals underpins long-term stability for the North America glass bottles and containers market size.
Complete Report Scope:
- By End-user
- Beverages
- Alcoholic
- Beer
- Wine
- Spirits
- Other Alcoholic Beverages (Cider and Other Fermented Drinks)
- Non-Alcoholic
- Juices
- Carbonated Drinks (CSDs)
- Dairy Product Based Drinks
- Other Non-Alcoholic Beverages
- Alcoholic
- Food (Jam, Jelly, Marmalades, Honey, Sausages and Condiments, Oil, Pickles)
- Cosmetics and Personal Care
- Pharmaceuticals (excluding Vials and Ampoules)
- Perfumery
- Beverages
- By Color
- Green
- Amber
- Flint
- Other Colors
- By Country
- United States
- Canada
- Mexico
List of Companies Covered in this Report:
- O-I Glass, Inc.
- Ardagh Group S.A.
- Anchor Glass Container Corporation
- Gerresheimer AG
- Stoelzle Glass Group
- Berlin Packaging LLC
- TricorBraun Inc.
- Kaufman Container
- O.Berk Company, LLC
- MJS Packaging
- Burch Bottle & Packaging, Inc.
- General Bottle Supply
- Pacific Vial Manufacturing Inc.
- North Mountain Supply
- Silver Spur Corporation
- Glassnow, Inc.
- Love Bottle LLC
- Vitro Packaging LLC
- Gallo Glass Company
- The Cary Company
Additional Benefits:
- The market estimate (ME) sheet in Excel format
- 3 months of analyst support
TABLE OF CONTENTS
1 INTRODUCTION
- 1.1 Study Assumptions and Market Definition
- 1.2 Scope of the Study
2 RESEARCH METHODOLOGY
3 EXECUTIVE SUMMARY
4 MARKET LANDSCAPE
- 4.1 Market Overview
- 4.2 Market Drivers
- 4.2.1 E-Commerce Growth Drives Demand for Durable, Premium Packaging
- 4.2.2 Craft Beverage Boom Fuels Demand for Custom Glass Bottles
- 4.2.3 Sustainability Push and Recyclability Favor Glass Over Plastic
- 4.2.4 Extended Producer Responsibility (EPR) Programs Promote Glass Adoption
- 4.2.5 Embossing and Artistic Finishes Enhance Brand Differentiation
- 4.2.6 Consumer Shift Toward Healthier Packaging Fuels Glass Preference
- 4.3 Market Restraints
- 4.3.1 Recycling Infrastructure Gaps Limit Cullet Availability
- 4.3.2 Weight and Fragility Increase Last-Mile Delivery Costs
- 4.3.3 Plastic and Metal Packaging Continue to Dominate Mass SKUs
- 4.3.4 High Furnace Energy Requirements Raise Carbon Exposure
- 4.4 Industry Supply-Chain Analysis
- 4.5 Container Glass Furnace Capacity and Locations in North America
- 4.5.1 Plant Locations and Year of Commencement
- 4.5.2 Production Capacities
- 4.5.3 Types of Furnaces
- 4.5.4 Color of Glass Produced
- 4.6 Export-Import Data of Container Glass - Covering Key Import and Export Destinations
- 4.6.1 Import Volume and Value, 2021-2024
- 4.6.2 Export Volume and Value, 2021-2024
- 4.7 Porter's Five Forces Analysis
- 4.7.1 Threat of New Entrants
- 4.7.2 Bargaining Power of Suppliers
- 4.7.3 Bargaining Power of Buyers
- 4.7.4 Threat of Substitutes
- 4.7.5 Competitive Rivalry
- 4.8 Raw Material Analysis
- 4.9 Recycling Trends for Glass Packaging
- 4.10 Demand vs Supply Analysis for Glass Packaging
5 MARKET SIZE AND GROWTH FORECASTS (VOLUME)
- 5.1 By End-user
- 5.1.1 Beverages
- 5.1.1.1 Alcoholic
- 5.1.1.1.1 Beer
- 5.1.1.1.2 Wine
- 5.1.1.1.3 Spirits
- 5.1.1.1.4 Other Alcoholic Beverages (Cider and Other Fermented Drinks)
- 5.1.1.2 Non-Alcoholic
- 5.1.1.2.1 Juices
- 5.1.1.2.2 Carbonated Drinks (CSDs)
- 5.1.1.2.3 Dairy Product Based Drinks
- 5.1.1.2.4 Other Non-Alcoholic Beverages
- 5.1.1.1 Alcoholic
- 5.1.2 Food (Jam, Jelly, Marmalades, Honey, Sausages and Condiments, Oil, Pickles)
- 5.1.3 Cosmetics and Personal Care
- 5.1.4 Pharmaceuticals (excluding Vials and Ampoules)
- 5.1.5 Perfumery
- 5.1.1 Beverages
- 5.2 By Color
- 5.2.1 Green
- 5.2.2 Amber
- 5.2.3 Flint
- 5.2.4 Other Colors
- 5.3 By Country
- 5.3.1 United States
- 5.3.2 Canada
- 5.3.3 Mexico
6 COMPETITIVE LANDSCAPE
- 6.1 Market Concentration
- 6.2 Strategic Moves and Developments
- 6.3 Company Market Share Analysis, (Based on Latest Production Capacity)
- 6.4 Company Profiles (includes Global level Overview, Market level overview, Core Segments, Financials as available, Strategic Information, Market Rank/Share for key companies, Products and Services, and Recent Developments)
- 6.4.1 O-I Glass, Inc.
- 6.4.2 Ardagh Group S.A.
- 6.4.3 Anchor Glass Container Corporation
- 6.4.4 Gerresheimer AG
- 6.4.5 Stoelzle Glass Group
- 6.4.6 Berlin Packaging LLC
- 6.4.7 TricorBraun Inc.
- 6.4.8 Kaufman Container
- 6.4.9 O.Berk Company, LLC
- 6.4.10 MJS Packaging
- 6.4.11 Burch Bottle & Packaging, Inc.
- 6.4.12 General Bottle Supply
- 6.4.13 Pacific Vial Manufacturing Inc.
- 6.4.14 North Mountain Supply
- 6.4.15 Silver Spur Corporation
- 6.4.16 Glassnow, Inc.
- 6.4.17 Love Bottle LLC
- 6.4.18 Vitro Packaging LLC
- 6.4.19 Gallo Glass Company
- 6.4.20 The Cary Company
7 MARKET OPPORTUNITIES AND FUTURE OUTLOOK
- 7.1 White-space and Unmet-Need Assessment

 亞太地區玻璃瓶和容器:市場佔有率分析、行業趨勢和統計數據以及成長預測(2026-2031 年)非洲玻璃瓶與容器:市場佔有率分析、產業趨勢與統計、成長預測(2026-2031 年)玻璃瓶和容器:市場佔有率分析、行業趨勢和統計數據、成長預測(2026-2031)歐洲玻璃瓶和容器:市場佔有率分析、行業趨勢和統計數據以及成長預測(2026-2031 年)
 玻璃瓶和容器市場規模、佔有率和成長分析(按產品、應用、顏色、最終用途產業和地區分類)—產業預測(2026-2033 年)
 2025-2029年全球玻璃瓶與容器市場英國玻璃瓶和容器:市場佔有率分析、行業趨勢和成長預測(2025-2030 年)中東和非洲玻璃瓶和容器市場佔有率分析、行業趨勢、統計數據和成長預測(2025-2030)拉丁美洲玻璃瓶和容器:市場佔有率分析、行業趨勢和成長預測(2025-2030)
 玻璃瓶及容器市場機會、成長動力、產業趨勢分析及 2025 - 2034 年預測