

 |
市場調查報告書
商品編碼
2123453
生質能源:市場佔有率分析、產業趨勢與統計、成長預測(2026-2031)Bioenergy - Market Share Analysis, Industry Trends & Statistics, Growth Forecasts (2026 - 2031) |
||||||

※ 本網頁內容可能與最新版本有所差異。詳細情況請與我們聯繫。
據 Mordor Intelligence 稱,2026 年生質能源市場規模估計為 164.78 吉瓦,高於 2025 年的 157.5 吉瓦,預計到 2031 年將達到 206.59 吉瓦。
預計從 2026 年到 2031 年,其複合年成長率將達到 4.62%。
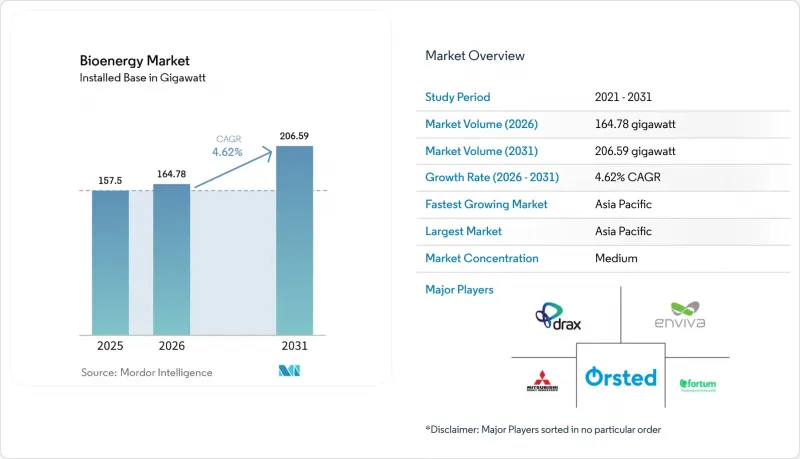
本報告按類型(固體生質能、沼氣、可再生廢棄物、其他)、原料(農業殘餘物、林業殘餘物等)、技術(燃燒、氣化、厭氧消化等)、應用(火力發電、運輸燃料等)、最終用戶(電力公司、商業和工業等)以及地區(北美、歐洲、亞太地區等)進行分類。
全球生質能源市場趨勢與洞察
淨零排放目標和可再生能源使用
實現碳中和的強制性路徑目前已涵蓋全球超過80%的GDP,並正在提振長期需求。此外,歐盟到2040年實現淨排放量減少90%的目標、美國《通貨膨脹控制法案》對先進燃料的資助以及印度20%的乙醇混合燃料目標也起到了推動作用。廣泛的強制性要求包括ReFuelEU(歐盟永續航空燃料計畫),該計畫要求到2050年實現70%的永續航空燃料使用;以及英國法規,該法規要求從2025年起實現2%的永續航空燃料使用。這種多行業需求推動了生質能源市場的發展,使其能夠同時涉足電力、暖氣和交通運輸領域。強勁的銷售前景使開發商能夠簽訂15-20年的合約並延長貸款期限。由於間歇性再生能源來源難以承擔穩定供應的義務,跨產業需求仍然是明顯的競爭優勢。
豐富的低成本農業和林業殘餘物
根據美國能源局最新發布的《十億噸報告》,永續原料的潛在產量超過每年十億噸,遠遠超過目前的消耗量。光是印度每年就產生1.8億噸廢棄物,預計到2030年,原料需求將增加50%。地緣政治格局的變化凸顯了資源風險的不對稱性。由於對俄羅斯和白俄羅斯產品實施制裁,歐洲木片供應趨緊,基準價格已達到多年來的最高水準。因此,原料產地與加工地點之間的地理位置接近性已成為影響專案總成本的重要因素。一些公司授權使用新一代預處理系統,將玉米秸稈、稻草和棕櫚殘渣轉化為可直接取代燃料,這表明物流主導的價值創造往往比資源的絕對豐富程度更為重要。
資本密集度高且資金籌措困難
単一の先進的なバイオレフィナリーを建設するには、20億米ドル以上の股本と借入資金が必要となる場合があり、FID(最終投資決定)前の資金籌措プロセスは数年を要するものです。長期のオフテイク契約によって市場価格リスクは軽減されますが、多くの開發中國家では、信用補完の枠組みがまだ整備されきっていないため、該地貨幣建ての借入には依然として制約があります。バイオマスによる熱電併給プラントの投資コストは、1kWあたり3,410ユーロから5,970ユーロの範囲にあり、ガス火力発電の代替案に比べて大幅に高くなっています。そのため、スポンサー企業は、電力会社、EPC(設計,調達,建設)企業、原料集荷業者との合弁事業を通じて、リスクを分散させるケースが増えています。現在、大企業が資金籌措の主導役を担っていますが、小規模な開発業者は、特に排碳權による収益がまだ資金籌措に活用できない状況では、依然として大きな障壁に直面しています。
細分市場分析
固體生質能仍是最大的驅動力,得益於數十年來對顆粒廠、殘渣處理設施和可靠燃燒裝置的投資,到2025年,它將供應全球67.25%的生質能源。從林產品到特種作物,成熟的供應鏈為各大主要地區的燃料供應提供了保障。然而,沼氣目前是成長最快的能源。在更先進的厭氧消化技術和更嚴格的新廢棄物回收法規的支持下,預計到2031年,沼氣產量將以每年10.1%的速度成長。德國最新的生質能計畫特別重視柔軟性的沼氣設施,以確保即使在初始補貼結束後也能持續向電網供電。都市固態廢棄物的氣化和掩埋氣體的回收也正在加速發展,而藻類燃料等早期方案目前仍處於實驗室階段。總而言之,這些變化表明,市場正在從簡單的燃燒和煮沸系統轉向更清潔、更高價值的工藝,從而從每噸有機物中提取更多價值。
原料供給の大部分は木材チップや製材所の残材が占めており、2025年には林業残渣のシェアが39.70%に達する見込みです。長年にわたる伐採の慣行とペレットの物流体制により、この供給源は信頼性が高く、価格競争力にも優れています。一方、農産物残渣は最も急速にシェアを伸ばしており、作物の廢棄物を畑で腐らせたり燃やしたりするのではなく、エネルギーに変換することを奨励する政策により、年率8.55%のペースで拡大しています。米国「10億トン報告書」によると、未利用のバイオマスは10億トンを超え、その多くはトウモロコシの茎、小麦わら、籾殻などであり、回収を待っている状態です。エネルギー専用作物や選別済みの都市ごみが多様性を加えていますが、欧州で最近発生した木材チップの不足は、地政学的な要因が、確立されたサプライチェーンでさえも揺るがす可能性があることを示しています。この現実により、生産者はより厳格な認証と完全なトレーサビリティの確保を迫られており、これにより買い手は各積荷の産地と永續性の両方を信頼できるようになります。
區域分析
到2025年,亞太地區不僅將佔據最大的區域佔有率(43.30%),還將保持最高的年成長率(5.95%)。印度計劃在2020年代中期將其生質燃料使用量提高兩倍,這得益於其豐富的作物殘渣資源和明確的政府目標。中國正在開發涵蓋電力、天然氣和液體燃料的綜合生質能項目。日本和韓國高度依賴進口和先進技術,而東南亞則正在利用棕櫚油和稻米廢棄物來滿足國內需求並出口。它們的通用在於能源安全,即在降低石油進口成本的同時,將當地廢棄物轉化為當地能源。
由於數十年來氣候目標、上網電價補貼和永續性標準的協調一致,歐洲在2025年仍維持著29.70%的生質能源市場佔有率。德國新的生質能一攬子計畫、法國的發電容量競標以及荷蘭計畫中的生物能源碳捕獲與封存(BECCS)補貼,都是政策框架一致性得以維持投資動能的典範。然而,隨著土地利用限制日益凸顯、木片進口限制收緊以及相互衝突的生態學優先事項對進一步大規模森林砍伐構成挑戰,成長速度正在放緩。因此,市場參與企業正將目光轉向高附加價值的細分領域,例如負排放發電和透過高效轉化系統最佳化利用有限原料的工業供熱項目。
北美在生物燃料生產能力方面位居全球第三,但在先進生質燃料創新方面卻處於主導。憑藉其玉米和大豆供應鏈以及聯邦政府的生產和混合補貼,美國在全球乙醇和可再生柴油產量中佔據了相當大的佔有率。隨著永續航空燃料(SAF)項目儲備的不斷成長,美國在航空燃料脫碳領域始終處於領先地位。加拿大利用其豐富的林業資源和省級無污染燃料標準,並經常透過與原住民社區的夥伴關係,吸引大規模的氣化和可再生天然氣(RNG)設施。在墨西哥,新的法規為在甘蔗糖廠引入甘蔗渣汽電共生系統創造了機會。然而,短期進展的速度將取決於政策的清晰度。
其他好處:
- Excel格式的市場預測(ME)表
- 3個月的分析師支持
目錄
第1章:引言
- 研究假設和市場定義
- 調查範圍
第2章:調查方法
第3章執行摘要
第4章 市場狀況
- 市場概覽
- 市場促進因素
- 淨零排放目標和強制性可再生能源
- 豐富且低成本的農業和林業殘餘物
- 技術主導的先進生質能源平準化能源成本下降
- 生物能源碳捕獲與封存(BECCS)獎勵與負排放收入來源
- 工業部門對可調節綠色熱能和電力的需求
- 生物來源二氧化碳權額度的貨幣化
- 市場限制因素
- 資本密集度高且資金籌措壁壘高
- 原料物流系統和成本的分散化
- 間接土地利用變化和永續性標準的收緊
- 低成本電池儲能系統的競爭正在削弱基本負載的價值。
- 供應鏈分析
- 監理情勢
- 技術趨勢與創新
- 波特五力模型
第5章 市場規模與成長預測
- 按類型
- 固體生質能
- 沼氣
- 可再生廢棄物
- 其他類型
- 按原料
- 農業殘餘物
- 林業剩餘物
- 能源作物
- 一般廢棄物
- 透過技術
- 燃燒
- 氣化
- 快速熱解
- 厭氧消化
- 發酵
- 其他技術
- 透過使用
- 發電
- 熱量產生
- 運輸燃料
- 熱電聯產(CHP)
- 最終用戶
- 電力公司
- 商業和工業用途
- 住宅
- 按地區
- 北美洲
- 美國
- 加拿大
- 墨西哥
- 歐洲
- 德國
- 法國
- 英國
- 義大利
- 瑞典
- 芬蘭
- 其他歐洲國家
- 亞太地區
- 中國
- 印度
- 日本
- 韓國
- 東南亞國協
- 澳洲和紐西蘭
- 其他亞太國家
- 南美洲
- 巴西
- 智利
- 哥倫比亞
- 烏拉圭
- 其他南美國家
- 中東和非洲
- 南非
- 衣索比亞
- 蘇丹
- 其他中東和非洲國家
- 北美洲
第6章 競爭情勢
- 市場集中度
- 策略性措施(併購、合資、資金籌措、購電協議)
- 市場佔有率分析(主要公司的市場排名和市場佔有率)
- 公司簡介
- Mitsubishi Heavy Industries Ltd
- MVV Energie AG
- A2A SpA
- Hitachi Zosen Corp
- BTG Biomass Technology Group
- Babcock & Wilcox Volund AS
- Biomass Engineering Ltd
- Orsted AS
- Enerkem
- Fortum Oyj
- Drax Group plc
- Enviva Inc.
- Veolia Environment SA
- Vattenfall AB
- Abengoa SA
- BIOENERGY DevCo
- Valmet Oyj
- Andritz AG
- Green Plains Inc.
- Anaergia Inc.
- Pacific BioEnergy Corp
第7章 市場機會與未來展望
According to Mordor Intelligence, bioenergy market size in 2026 is estimated at 164.78 gigawatt, growing from 2025 value of 157.5 gigawatt with 2031 projections showing 206.59 gigawatt, growing at 4.62% CAGR over 2026-2031.
This report is Segmented by Type (Solid Biomass, Biogas, Renewable Waste, and Other Types), Feedstock (Agricultural Residues, Forestry Residues, and More), Technology (Combustion, Gasification, Anaerobic Digestion, and More), Application (Heat Generation, Transportation Fuel, and More), End-User (Power Utilities, Commercial and Industrial, and More), and Geography (North America, Europe, Asia-Pacific, and More).
Global Bioenergy Market Trends and Insights
Net-zero targets & renewable-energy mandates
Mandatory carbon-neutrality trajectories now cover more than 80% of global GDP, with the EU's 90% net-emissions-reduction goal for 2040, the US Inflation Reduction Act's funding tranches for advanced fuels, and India's 20% ethanol blending target converging to lift long-term demand. Broad-based mandates extend to ReFuelEU's 70% sustainable aviation fuel requirement by 2050 and the UK's 2% sustainable aviation fuel obligation from 2025. The resulting multi-sector pull allows the bioenergy market to tap into electricity, heating, and transport segments simultaneously. Strong offtake visibility enables developers to structure 15- to 20-year contracts and improve debt tenors. The cross-industry appeal remains a clear competitive edge where intermittent renewable sources struggle to shoulder firm-capacity obligations.
Abundant low-cost agricultural & forestry residues
The US Department of Energy's latest Billion-Ton Report shows that sustainable feedstock potential exceeds 1 billion t annually, dwarfing current consumption. India alone produces 180 million t of residues each year, with projected feedstock demand growth of 50% by 2030. Evolving geopolitics underline resource-risk asymmetry: Europe's wood-chip supply tightened after sanctions on Russian and Belarusian products, sending benchmark prices to multi-year highs. Consequently, proximity between feedstock clusters and processing hubs now dictates a meaningful share of total project cost. Companies licensing next-generation preprocessing systems to convert corn stover, rice straw, and palm residues into drop-in fuels illustrate how logistics-driven value creation often outranks absolute resource abundance.
High capital intensity & financing hurdles
A single advanced biorefinery can require more than USD 2 billion in equity and debt, making pre-FID capital stacking a multiyear process. Although long-term offtake agreements mitigate merchant-price risks, nascent credit-enhancement frameworks in many developing economies still restrict local-currency debt. Investment costs for combined heat-and-power biomass plants range between EUR 3,410 and EUR 5,970 per kW, significantly higher than those for gas-fired alternatives. Therefore, sponsors increasingly syndicate risk through joint ventures with utilities, EPCs, and feedstock aggregators. Large corporates now anchor equity rounds, but smaller developers continue to face sizable hurdles, especially when carbon-credit revenue is not yet bankable.
Other drivers and restraints analyzed in the detailed report include:
- Technology-driven LCOE decline for advanced bioenergy
- BECCS incentives & negative-emissions revenue streams
- Fragmented feedstock logistics & costs
For complete list of drivers and restraints, kindly check the Table Of Contents.
Segment Analysis
Solid biomass still does most of the heavy lifting, supplying 67.25% of global bioenergy in 2025 thanks to decades of investments in pellet mills, residue-handling equipment, and dependable combustion plants. A mature supply chain, from forestry by-products to purpose-grown crops, keeps fuel flowing in every major region. Yet the fastest mover right now is biogas. Backed by better anaerobic-digestion technology and tough new waste-recycling rules, biogas output is set to grow 10.1% a year through 2031. Germany's latest biomass program even singles out flexible biogas units so they can keep supporting the grid once their first subsidies expire. Municipal solid-waste gasification and landfill-gas capture add more momentum, while early-stage options, such as algae fuels, remain in the lab for now. Together, these shifts show the market tilting from simple burn-and-boil systems toward cleaner, higher-value processes that squeeze more out of every ton of organic material.
Wood chips and sawmill scraps dominate feedstock supply, giving forestry residues a 39.70% share in 2025. Long-standing harvest routines and pellet logistics make this stream reliable and price-competitive. Farm residues, however, are gaining ground the quickest, expanding at an annual rate of 8.55% as policies favor turning crop waste into energy rather than leaving it to rot or burn in the field. The U.S. Billion-Ton Report points to more than 1 billion tons of untapped biomass, much of it corn stalks, wheat straw, and rice husks, waiting to be collected. Dedicated energy crops and sorted municipal waste add diversity, though Europe's recent wood-chip shortage shows how geopolitics can rattle even well-established supply chains. That reality is pushing producers toward stricter certification and full traceability so buyers can trust both the origin and the sustainability of every load.
Complete Report Scope:
- By Type
- Solid Biomass
- Biogas
- Renewable Waste
- Other Types
- By Feedstock
- Agricultural Residues
- Forestry Residues
- Energy Crops
- Municipal Solid Waste
- By Technology
- Combustion
- Gasification
- Fast Pyrolysis
- Anaerobic Digestion
- Fermentation
- Other Technologies
- By Application
- Electricity Generation
- Heat Generation
- Transportation Fuel
- Combined Heat & Power (CHP)
- By End-user
- Power Utilities
- Commercial and Industrial
- Residential
- By Geography
- North America
- United States
- Canada
- Mexico
- Europe
- Germany
- France
- United Kingdom
- Italy
- Sweden
- Finland
- Rest of Europe
- Asia Pacific
- China
- India
- Japan
- South Korea
- ASEAN Countries
- Australia and New Zealand
- Rest of Asia Pacific
- South America
- Brazil
- Chile
- Colombia
- Uruguay
- Rest of South America
- Middle East and Africa
- South Africa
- Ethiopia
- Sudan
- Rest of Middle East and Africa
- North America
Geography Analysis
The Asia-Pacific region not only holds the largest regional share of 43.30% in 2025, but is also the fastest-growing, at a rate of 5.95% per year. India plans to triple biofuel use by the mid-2020s, backed by a vast pool of crop residues and clear government targets. China is rolling out full-suite biomass projects covering power, gas, and liquid fuels. Japan and South Korea rely more heavily on imports and advanced technologies, whereas Southeast Asia utilizes palm and rice waste for both domestic use and exports. The common thread is energy security: turning local waste into local energy while reducing the oil import bill.
Europe maintained a commanding 29.70% share of the bioenergy market in 2025, thanks to a decades-long alignment between climate ambition, feed-in tariffs, and sustainability criteria. Germany's new biomass package, France's capacity auctions, and the Netherlands' incoming BECCS subsidy exemplify cohesive policy frameworks that maintain investment momentum. Yet growth is moderating as land-use constraints take effect, wood-chip imports become more stringent, and competing ecological priorities challenge further large-scale forest harvesting. Market participants, therefore, pivot toward higher-value niches, including negative-emission power and industrial heat projects that optimize limited feedstock through high-efficiency conversion systems.
North America holds third place in terms of capacity, yet leads in advanced biofuel innovation. The United States accounts for the lion's share of global ethanol and renewable-diesel volumes, leveraging its corn and soy supply chains alongside federal production and blending credits. A growing pipeline of SAF projects positions the country to remain at the forefront of aviation-fuel decarbonization. Canada leverages vast forestry resources and provincial clean-fuel standards to attract large-scale gasification and RNG facilities, often in partnership with First Nations. Mexico's emerging mandates create opportunities for retrofitting sugarcane mills with bagasse cogeneration, although policy clarity will determine near-term pace.
- Mitsubishi Heavy Industries Ltd
- MVV Energie AG
- A2A SpA
- Hitachi Zosen Corp
- BTG Biomass Technology Group
- Babcock & Wilcox Volund AS
- Biomass Engineering Ltd
- ?rsted AS
- Enerkem
- Fortum Oyj
- Drax Group plc
- Enviva Inc.
- Veolia Environment SA
- Vattenfall AB
- Abengoa SA
- BIOENERGY DevCo
- Valmet Oyj
- Andritz AG
- Green Plains Inc.
- Anaergia Inc.
- Pacific BioEnergy Corp
Additional Benefits:
- The market estimate (ME) sheet in Excel format
- 3 months of analyst support
TABLE OF CONTENTS
1 Introduction
- 1.1 Study Assumptions & Market Definition
- 1.2 Scope of the Study
2 Research Methodology
3 Executive Summary
4 Market Landscape
- 4.1 Market Overview
- 4.2 Market Drivers
- 4.2.1 Net-zero targets & renewable energy mandates
- 4.2.2 Abundant low-cost agricultural & forestry residues
- 4.2.3 Technology-driven LCOE decline for advanced bioenergy
- 4.2.4 BECCS incentives & negative-emissions revenue streams
- 4.2.5 Industrial off-take demand for dispatchable green heat/power
- 4.2.6 Monetisation of biogenic-CO? credits
- 4.3 Market Restraints
- 4.3.1 High capital intensity & financing hurdles
- 4.3.2 Fragmented feed-stock logistics & costs
- 4.3.3 Stricter ILUC & sustainability criteria
- 4.3.4 Competing low-cost battery storage eroding baseload value
- 4.4 Supply-Chain Analysis
- 4.5 Regulatory Landscape
- 4.6 Technological Outlook & Innovations
- 4.7 Porter's Five Forces
- 4.7.1 Bargaining Power of Suppliers
- 4.7.2 Bargaining Power of Consumers
- 4.7.3 Threat of New Entrants
- 4.7.4 Threat of Substitutes
- 4.7.5 Intensity of Competitive Rivalry
5 Market Size & Growth Forecasts
- 5.1 By Type
- 5.1.1 Solid Biomass
- 5.1.2 Biogas
- 5.1.3 Renewable Waste
- 5.1.4 Other Types
- 5.2 By Feedstock
- 5.2.1 Agricultural Residues
- 5.2.2 Forestry Residues
- 5.2.3 Energy Crops
- 5.2.4 Municipal Solid Waste
- 5.3 By Technology
- 5.3.1 Combustion
- 5.3.2 Gasification
- 5.3.3 Fast Pyrolysis
- 5.3.4 Anaerobic Digestion
- 5.3.5 Fermentation
- 5.3.6 Other Technologies
- 5.4 By Application
- 5.4.1 Electricity Generation
- 5.4.2 Heat Generation
- 5.4.3 Transportation Fuel
- 5.4.4 Combined Heat & Power (CHP)
- 5.5 By End-user
- 5.5.1 Power Utilities
- 5.5.2 Commercial and Industrial
- 5.5.3 Residential
- 5.6 By Geography
- 5.6.1 North America
- 5.6.1.1 United States
- 5.6.1.2 Canada
- 5.6.1.3 Mexico
- 5.6.2 Europe
- 5.6.2.1 Germany
- 5.6.2.2 France
- 5.6.2.3 United Kingdom
- 5.6.2.4 Italy
- 5.6.2.5 Sweden
- 5.6.2.6 Finland
- 5.6.2.7 Rest of Europe
- 5.6.3 Asia Pacific
- 5.6.3.1 China
- 5.6.3.2 India
- 5.6.3.3 Japan
- 5.6.3.4 South Korea
- 5.6.3.5 ASEAN Countries
- 5.6.3.6 Australia and New Zealand
- 5.6.3.7 Rest of Asia Pacific
- 5.6.4 South America
- 5.6.4.1 Brazil
- 5.6.4.2 Chile
- 5.6.4.3 Colombia
- 5.6.4.4 Uruguay
- 5.6.4.5 Rest of South America
- 5.6.5 Middle East and Africa
- 5.6.5.1 South Africa
- 5.6.5.2 Ethiopia
- 5.6.5.3 Sudan
- 5.6.5.4 Rest of Middle East and Africa
- 5.6.1 North America
6 Competitive Landscape
- 6.1 Market Concentration
- 6.2 Strategic Moves (M&A, JVs, Funding, PPAs)
- 6.3 Market Share Analysis (Market Rank/Share for key companies)
- 6.4 Company Profiles (includes Global-level Overview, Market-level Overview, Core Segments, Financials, Strategic Information, Products & Services, Recent Developments)
- 6.4.1 Mitsubishi Heavy Industries Ltd
- 6.4.2 MVV Energie AG
- 6.4.3 A2A SpA
- 6.4.4 Hitachi Zosen Corp
- 6.4.5 BTG Biomass Technology Group
- 6.4.6 Babcock & Wilcox Volund AS
- 6.4.7 Biomass Engineering Ltd
- 6.4.8 ?rsted AS
- 6.4.9 Enerkem
- 6.4.10 Fortum Oyj
- 6.4.11 Drax Group plc
- 6.4.12 Enviva Inc.
- 6.4.13 Veolia Environment SA
- 6.4.14 Vattenfall AB
- 6.4.15 Abengoa SA
- 6.4.16 BIOENERGY DevCo
- 6.4.17 Valmet Oyj
- 6.4.18 Andritz AG
- 6.4.19 Green Plains Inc.
- 6.4.20 Anaergia Inc.
- 6.4.21 Pacific BioEnergy Corp
7 Market Opportunities & Future Outlook
- 7.1 White-space & Unmet-Need Assessment

 歐洲生質能源:市場佔有率分析、產業趨勢與統計及成長預測(2026-2031 年)
 生質能源市場:預測至2034年-全球原料、生質能源類型、轉化技術、應用、最終用戶、技術發展歷程、通路、設施規模、來源和區域分析
 生質能源市場機會、成長要素、產業趨勢分析及2026-2035年預測。生質能源市場及碳捕獲預測至2034年-全球原料、碳捕獲方法、技術、應用、終端用戶及區域分析
 生質能源市場報告:按產品類型、原料、應用和地區分類,2026-2034年
 生物熱電聯產市場規模、佔有率、成長及全球產業分析:按類型、應用和地區分類的洞察,2026-2034 年預測
 2026年全球生質能源市場報告
 生質能源市場分析及至2035年預測(含碳捕集與封存):依類型、產品、服務、技術、組件、應用、製程、最終用戶、安裝類型、解決方案分類
 生質能源市場-全球產業規模、佔有率、趨勢、機會及預測(依產品類型、原料、技術、應用、地區及競爭格局分類,2021-2031年)生質能源與捕碳封存市場-全球產業規模、佔有率、趨勢、機會及預測(按應用、技術、能源類型、地區和競爭格局分類,2021-2031年)