

 |
市場調查報告書
商品編碼
2071237
生質能源市場機會、成長要素、產業趨勢分析及2026-2035年預測。Bioenergy Market Opportunity, Growth Drivers, Industry Trend Analysis, and Forecast 2026 - 2035 |
||||||
全球生質能源市場預計到 2025 年價值 1,510 億美元,年複合成長率為 7.7%,到 2035 年將達到 3,180 億美元。
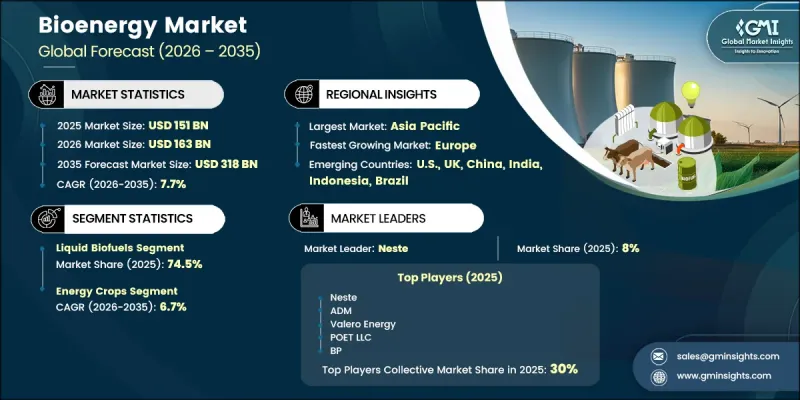
市場成長的驅動力在於生質燃料生產方式正從傳統方法轉向先進的廢棄物生質能源技術轉變,而這項轉變正在影響整個產業的投資重點、原料籌資策略和競爭格局。區域市場趨勢差異顯著,亞太地區保持最大的銷售佔有率,而歐洲則由於政策框架、永續性發展舉措和資源可用性的差異,繼續保持著最強勁的成長勢頭。各國政府和企業制定的長期脫碳目標仍是推動產業擴張的主要動力。生質能源在可再生能源領域佔據著獨特的地位,因為它能夠提供可調節的電力、工業熱能和交通燃料。此外,生質能資源在多個地區的廣泛分佈也為市場的長期發展提供了支持。然而,原料供應仍然容易受到季節性波動、地理限制和終端用戶需求競爭的影響,這些因素都會影響生產的經濟效益。對永續資源利用和土地管理實踐的日益關注,將繼續影響全球生質能源市場的原料籌資策略。
| 市場範圍 | |
|---|---|
| 開始年份 | 2025 |
| 預測期 | 2026-2035 |
| 初始市場規模 | 1510億美元 |
| 預測金額 | 3180億美元 |
| 複合年成長率 | 7.7% |
液體生質燃料市佔率佔比高達74.5%,預計到2035年將以8%的複合年成長率成長。此類別涵蓋了多種可再生燃料技術,應用於現有和新興能源領域。先進燃料生產技術投資的增加、轉化效率的提高以及運輸領域對低碳能源解決方案日益成長的需求,都將持續推動該領域的成長。在液體生質燃料類別中,具有高永續性評級的可再生燃料替代品預計將在預測期內帶來最強勁的成長機會。
預計到2025年,能源作物市佔率將達到51.1%,並在2035年之前以6.7%的複合年成長率成長。該領域的主導地位反映了專用原料種植和加工基礎設施的廣泛發展,這些基礎設施為大規模生質能源生產提供了支持。持續投資於提高農業生產力、最佳化原料利用和先進的生質能轉化技術,預計將進一步提升該領域對市場成長的貢獻。此外,加大力度提高原料產量和資源利用效率,將有助於確保基於能源作物的生質能源生產的長期永續性。
預計到2025年,北美生質能源市佔率將達到22%,並在2035年之前以7%的複合年成長率成長。該地區在全球生質燃料生產中繼續發揮重要作用,並持續吸引整體先進可再生燃料技術的巨額投資。北美各地的市場參與企業正透過降低碳排放強度、提高永續性和提升營運效率來脫穎而出。有利的法律規範、持續的基礎設施投資以及對可再生能源解決方案日益成長的需求,預計將在未來幾年內支撐該地區的市場擴張。
目錄
第1章:調查方法和範圍
第2章執行摘要
第3章 行業洞察
- 產業生態系分析
- 原物料供應及採購分析
- 生產能力評估
- 供應鏈韌性與風險因素
- 配電網路分析
- 監理情勢
- 影響產業的因素
- 促進因素
- 脫碳目標與淨零排放目標
- 生質原料供應充足
- 支持政策、補貼和混合義務
- 產業潛在風險與挑戰
- 高資本密集度與技術商業化風險
- 促進因素
- 成長潛力分析
- 波特的分析
- PESTLE分析
- 價格趨勢分析(美元兌歐元)
- 按類型
- 按地區
- 人工智慧和生成式人工智慧對市場的影響
- 利用人工智慧最佳化生產
- 預測性維護和故障檢測
- 新機會與趨勢
- 投資分析及未來展望
- 永續發展措施與工業4.0的融合
第4章 競爭情勢
- 介紹
- 企業市佔率分析:按地區分類
- 北美洲
- 歐洲
- 亞太地區
- 中東和非洲
- 拉丁美洲
- 主要進展
- 重要合作夥伴關係和合作
- 主要併購活動
- 產品創新和新產品發布
- 市場擴大策略
- 競爭定位矩陣
第5章 市場規模及預測:依類型分類,2022-2035年
- 液體生質燃料
- 固體生質能
- 沼氣/生物甲烷
- 其他
第6章 市場規模及預測:依原料分類,2022-2035年
- 能源作物
- 林業殘餘物
- 農業殘餘物
- 有機廢棄物
- 其他
第7章 市場規模及預測:依技術分類,2022-2035年
- 熱化學
- 生物化學
- 化學過程
- 其他
第8章 市場規模及預測:依應用領域分類,2022-2035年
- 發電
- 熱量產生
- 運輸燃料
- 熱電聯產
- 其他
第9章 市場規模及預測:依最終用途分類,2022-2035年
- 電力公司
- 產業
- 住宅
- 商業
- 運輸
- 其他
第10章 市場規模及預測:依地區分類,2022-2035年
- 北美洲
- 美國
- 加拿大
- 墨西哥
- 歐洲
- 德國
- 英國
- 法國
- 荷蘭
- 義大利
- 亞太地區
- 中國
- 印度
- 日本
- 印尼
- 澳洲
- 中東和非洲
- 沙烏地阿拉伯
- UAE
- 南非
- 拉丁美洲
- 巴西
- 阿根廷
第11章:公司簡介
- ADM
- Alto Ingredients
- BP Bioenergy
- Cargill
- Chevron REG
- CropEnergies
- Drax Group
- Enviva Inc.
- Fortum
- Green Plains
- Neste
- Orsted Group
- Petrobras Biocombustivel
- POET LLC
- Raizen
- RWE
- TotalEnergies
- Valero Energy
- Verbio AG
- Wilmar International
The Global Bioenergy Market was valued at USD 151 billion in 2025 and is estimated to grow at a CAGR of 7.7% to reach USD 318 billion by 2035.
Market growth is driven by the ongoing shift from conventional biofuel production methods toward advanced and waste-based bioenergy technologies, a transformation that is influencing investment priorities, feedstock sourcing strategies, and competitive dynamics throughout the industry. Regional market performance varies considerably, with Asia Pacific maintaining the largest revenue share while Europe continues to demonstrate the strongest growth trajectory due to differing policy frameworks, sustainability initiatives, and resource availability. Long-term decarbonization objectives established by governments and corporations remain a major catalyst for industry expansion. Bioenergy occupies a unique position within the renewable energy landscape because it can deliver dispatchable electricity, industrial heat, and transportation fuels. In addition, the broad availability of biomass resources across multiple regions supports long-term market development. However, feedstock supply remains subject to seasonal fluctuations, geographic limitations, and competing end-use demands that can affect production economics. The increasing focus on sustainable resource utilization and land management practices continues to influence feedstock procurement strategies across the global bioenergy market.
| Market Scope | |
|---|---|
| Start Year | 2025 |
| Forecast Year | 2026-2035 |
| Start Value | $151 Billion |
| Forecast Value | $318 Billion |
| CAGR | 7.7% |
The liquid biofuels segment accounted for 74.5% share and is projected to grow at a CAGR of 8% through 2035. This category includes a diverse range of renewable fuel technologies that serve both established and emerging energy applications. The segment continues to benefit from increasing investments in advanced fuel production technologies, improved conversion efficiencies, and rising demand for lower-carbon transportation energy solutions. Among liquid biofuel categories, renewable fuel alternatives with enhanced sustainability profiles are expected to generate the strongest revenue growth opportunities during the forecast period.
The energy crops segment accounted for 51.1% share in 2025 and is anticipated to grow at a CAGR of 6.7% through 2035. The segment's leading position reflects the extensive development of dedicated feedstock cultivation and processing infrastructure that supports large-scale bioenergy production. Continued investments in agricultural productivity, feedstock optimization, and advanced biomass conversion technologies are expected to strengthen the segment's contribution to market growth. In addition, increasing efforts to improve feedstock yields and resource efficiency are supporting the long-term viability of energy crop-based bioenergy production.
North America Bioenergy Market held 22% share in 2025 and is projected to grow at a CAGR of 7% through 2035. The region remains a key contributor to global biofuel production and continues to attract significant investment across advanced renewable fuel technologies. Market participants throughout North America are increasingly differentiating themselves through lower carbon intensity profiles, enhanced sustainability performance, and operational efficiency improvements. Supportive regulatory frameworks, ongoing infrastructure investments, and growing demand for renewable energy solutions are expected to sustain regional market expansion over the coming years.
Major companies operating in the global bioenergy market include Neste, ADM, POET LLC, Drax Group, and Raizen. Companies active in the bioenergy market are implementing a range of strategic initiatives to strengthen their market position and expand their global footprint. Key strategies include increasing investments in advanced biofuel technologies, expanding production capacity, and enhancing feedstock diversification to improve supply security. Industry participants are also pursuing strategic partnerships, joint ventures, and long-term supply agreements to strengthen value chain integration and secure access to critical resources. Investments in research and development remain a priority as companies seek to improve conversion efficiency, reduce production costs, and develop next-generation renewable fuel solutions. Many organizations are further focusing on sustainability certifications, carbon reduction initiatives, and digital technologies to enhance operational performance.
Table of Contents
Chapter 1 Methodology & Scope
- 1.1 Research approach
- 1.2 Quality commitments
- 1.2.1 GMI AI policy & data integrity commitment
- 1.2.1.1 Source consistency protocol
- 1.2.1 GMI AI policy & data integrity commitment
- 1.3 Research trail & confidence scoring
- 1.3.1 Research trail components
- 1.3.2 Scoring components
- 1.4 Data collection
- 1.4.1 Partial list of primary sources
- 1.5 Data mining sources
- 1.5.1 Paid sources
- 1.5.1.1 Sources, by region
- 1.5.1 Paid sources
- 1.6 Base estimates and calculations
- 1.6.1 Base year calculation for any one approach
- 1.7 Market estimates & forecasts parameters
- 1.8 Forecast model
- 1.8.1 Quantified market impact analysis
- 1.8.1.1 Mathematical impact of growth parameters on forecast
- 1.8.1 Quantified market impact analysis
- 1.9 Research transparency addendum
- 1.9.1 Source attribution framework
- 1.9.2 Quality assurance metrics
- 1.9.3 Our commitment to trust
- 1.10 Market definitions
Chapter 2 Executive Summary
- 2.1 Industry synopsis, 2022 - 2035
- 2.1.1 Business trends
- 2.1.2 Type trends
- 2.1.3 Feedstock trends
- 2.1.4 Technology trends
- 2.1.5 Application trends
- 2.1.6 End use trends
- 2.1.7 Regional trends
Chapter 3 Industry Insights
- 3.1 Industry ecosystem analysis
- 3.1.1 Raw material availability & sourcing analysis
- 3.1.2 Production capacity assessment
- 3.1.3 Supply chain resilience & risk factors
- 3.1.4 Distribution network analysis
- 3.2 Regulatory landscape
- 3.3 Industry impact forces
- 3.3.1 Growth drivers
- 3.3.1.1 Decarbonization goals and net-zero targets
- 3.3.1.2 Abundant availability of biomass feedstock
- 3.3.1.3 Supportive policies, subsidies, and blending mandates
- 3.3.2 Industry pitfalls & challenges
- 3.3.2.1 High capital intensity and technology commercialization risk
- 3.3.1 Growth drivers
- 3.4 Growth potential analysis
- 3.5 Porter's analysis
- 3.5.1 Bargaining power of suppliers
- 3.5.2 Bargaining power of buyers
- 3.5.3 Threat of new entrants
- 3.5.4 Threat of substitutes
- 3.6 PESTEL analysis
- 3.6.1 Political factors
- 3.6.2 Economic factors
- 3.6.3 Social factors
- 3.6.4 Technological factors
- 3.6.5 Legal factors
- 3.6.6 Environmental factors
- 3.7 Price trend analysis (USD/EJ) (Driven by primary research)
- 3.7.1 By type
- 3.7.2 By region
- 3.8 Impact of AI & generative AI on the market
- 3.8.1 AI-Driven production optimization
- 3.8.2 Predictive maintenance & fault detection
- 3.9 Emerging opportunities & trends
- 3.10 Investment analysis & future prospects
- 3.11 Sustainability initiatives & industry 4.0 integration
Chapter 4 Competitive Landscape, 2026
- 4.1 Introduction
- 4.2 Company market share analysis, by region, 2025
- 4.2.1 North America
- 4.2.2 Europe
- 4.2.3 Asia Pacific
- 4.2.4 Middle East & Africa
- 4.2.5 Latin America
- 4.3 Key developments
- 4.3.1 Key partnerships & collaborations
- 4.3.2 Major M&A activities
- 4.3.3 Product innovations & launches
- 4.3.4 Market expansion strategies
- 4.4 Competitive positioning matrix
Chapter 5 Market Size and Forecast, By Type, 2022 - 2035 (EJ & USD Million)
- 5.1 Key trends
- 5.2 Liquid biofuels
- 5.3 Solid biomass
- 5.4 Biogas/biomethane
- 5.5 Others
Chapter 6 Market Size and Forecast, By Feedstock, 2022 - 2035 (EJ & USD Million)
- 6.1 Key trends
- 6.2 Energy crops
- 6.3 Forest residues
- 6.4 Agricultural residues
- 6.5 Organic waste
- 6.6 Others
Chapter 7 Market Size and Forecast, By Technology, 2022 - 2035 (EJ & USD Million)
- 7.1 Key trends
- 7.2 Thermochemical
- 7.3 Biochemical
- 7.4 Chemical processes
- 7.5 Others
Chapter 8 Market Size and Forecast, By Application, 2022 - 2035 (EJ & USD Million)
- 8.1 Key trends
- 8.2 Power generation
- 8.3 Heat generation
- 8.4 Transportation fuels
- 8.5 Combined heat & power
- 8.6 Others
Chapter 9 Market Size and Forecast, By End use, 2022 - 2035 (EJ & USD Million)
- 9.1 Key trends
- 9.2 Power utilities
- 9.3 Industrial
- 9.4 Residential
- 9.5 Commercial
- 9.6 Transportation
- 9.7 Others
Chapter 10 Market Size and Forecast, By Region, 2022 - 2035 (EJ & USD Million)
- 10.1 Key trends
- 10.2 North America
- 10.2.1 U.S.
- 10.2.2 Canada
- 10.2.3 Mexico
- 10.3 Europe
- 10.3.1 Germany
- 10.3.2 UK
- 10.3.3 France
- 10.3.4 Netherlands
- 10.3.5 Italy
- 10.4 Asia Pacific
- 10.4.1 China
- 10.4.2 India
- 10.4.3 Japan
- 10.4.4 Indonesia
- 10.4.5 Australia
- 10.5 Middle East & Africa
- 10.5.1 Saudi Arabia
- 10.5.2 UAE
- 10.5.3 South Africa
- 10.6 Latin America
- 10.6.1 Brazil
- 10.6.2 Argentina
Chapter 11 Company Profiles
- 11.1 ADM
- 11.2 Alto Ingredients
- 11.3 BP Bioenergy
- 11.4 Cargill
- 11.5 Chevron REG
- 11.6 CropEnergies
- 11.7 Drax Group
- 11.8 Enviva Inc.
- 11.9 Fortum
- 11.10 Green Plains
- 11.11 Neste
- 11.12 Orsted Group
- 11.13 Petrobras Biocombustivel
- 11.14 POET LLC
- 11.15 Raizen
- 11.16 RWE
- 11.17 TotalEnergies
- 11.18 Valero Energy
- 11.19 Verbio AG
- 11.20 Wilmar International
 生質能源市場報告:按產品類型、原料、應用和地區分類,2026-2034年
 生物熱電聯產市場規模、佔有率、成長及全球產業分析:按類型、應用和地區分類的洞察,2026-2034 年預測
 2026年全球生質能源市場報告
 生質能源市場分析及至2035年預測(含碳捕集與封存):依類型、產品、服務、技術、組件、應用、製程、最終用戶、安裝類型、解決方案分類
 生質能源市場-全球產業規模、佔有率、趨勢、機會及預測(依產品類型、原料、技術、應用、地區及競爭格局分類,2021-2031年)生質能源與捕碳封存市場-全球產業規模、佔有率、趨勢、機會及預測(按應用、技術、能源類型、地區和競爭格局分類,2021-2031年)
 生質能源市場規模、佔有率和成長分析(按產品類型、原料、技術、應用和地區分類)-2026-2033年產業預測
 生物能源市場:依產品類型、原料、技術、應用、國家及地區分類-全球產業分析、市場規模、市場佔有率及2025-2032年預測
 2032 年碳捕獲生質能源市場預測:按原料、捕獲方法、儲存方法、技術、最終用戶和地區進行的全球分析
 全球生質能源市場