


 |
市場調查報告書
商品編碼
2116514
歐洲生質能源:市場佔有率分析、產業趨勢與統計及成長預測(2026-2031 年)Europe Bioenergy - Market Share Analysis, Industry Trends & Statistics, Growth Forecasts (2026 - 2031) |
||||||

※ 本網頁內容可能與最新版本有所差異。詳細情況請與我們聯繫。
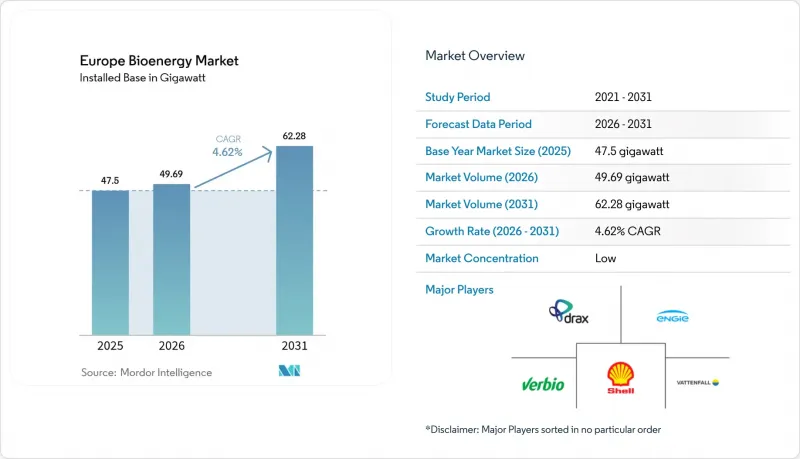
據 Mordor Intelligence 稱,2025 年歐洲生質能源市場價值為 47.5 吉瓦,預計到 2031 年將達到 62.28 吉瓦,而 2026 年為 49.69 吉瓦,預測期(2026-2031 年)的複合成長率為 4.62%。
本報告按類型(固體生質能、沼氣、可再生廢棄物、其他)、原料(農業殘餘物、林業殘餘物等)、技術(燃燒、厭氧消化等)、應用(發電、運輸燃料等)、最終用戶(電力公司、商業和工業、住宅)和地區(德國、英國、西班牙等)進行分類。
歐洲生質能源市場的趨勢與洞察
歐盟可再生能源指令III 2030年目標
第三號指令要求成員國到2030年將可再生能源佔比提高到42.5%,並在運輸、供熱和工業領域設定了具有約束力的子目標。這將有助於在電力供應不足的領域實現永續生質能能和生物甲烷的多年穩定供應。
各國生質熱能利用促進措施
德國2024年生質能一攬子計畫提高了汽電共生(CHP)的採購價格,並放寬了氣體純化的監管規定。同時,芬蘭用於區域供熱的生質能可免徵碳排放稅,從而維持了燃料轉化的經濟可行性,促進了林業殘餘物的利用。
永續原料和間接土地利用變化限制
農作物衍生燃料在運輸能源中的佔比上限為 7%,迫使買家轉向價格更高的殘渣,並需要更嚴格、更昂貴的認證程序。
細分市場分析
由於熱電聯產(CHP)技術的廣泛應用,預計到2025年,固體生質能將在歐洲生質能源市場維持58.52%的佔有率。然而,由於歐盟木材法規(EUDR)下行政程序的增加以及部分區域供熱運營商試點實施熱泵維修,其成長速度正在放緩。沼氣預計將以6.44%的複合年成長率快速成長至2031年,厭氧消化技術可將牲畜糞便、作物殘渣和食物廢棄物轉化為可直接連接電網的沼氣,並透過超過1200個連接點進行供應。在一些地區,可再生廢棄物的流量也在增加,因為廢棄物處理收入可以抵消原料成本,從而增強了工廠現金流的穩定性。
林業殘餘物仍佔最大佔有率,達41.12%,但面臨與可追溯性相關的額外費用負擔。農業殘餘物成長最快,複合年成長率達6.02%,這得益於機械化顯著降低了收整合本,並避免了間接土地利用變化(ILUC)的處罰。由於嚴格的土地利用監管,能源作物仍處於小眾市場,而歐盟掩埋規避法規下,城市固態廢棄物中的有機物含量正在增加。機械化和物流技術的進步已使農業殘餘物的收整合本降低了高達30%,即使在歐盟垃圾掩埋規避附加費的影響下,其價格也足以與進口顆粒燃料相媲美。
依賴森林殘餘物會給企業帶來負擔,例如每噸需支付約15-25歐元的歐盟森林退化條例(EUDR)實質審查費。但輪作系統利用當地農場和現有糧食倉儲基礎設施,建構了一體化的供應鏈。此外,隨著循環經濟法規要求市政當局避免掩埋生物來源廢棄物,有機廢棄物和城市廢棄物的市場佔有率也不斷擴大,這些原料被送往厭氧消化池。能源作物和藻類仍處於試驗階段,但相關研發項目已獲得資助,用於實現海洋資源和永續航空燃料(SAF)原料的多樣化。
其他好處:
- Excel格式的市場預測(ME)表
- 3個月的分析師支持
目錄
第1章:引言
- 研究假設和市場定義
- 調查範圍
第2章:調查方法
第3章執行摘要
第4章 市場狀況
- 市場概覽
- 市場促進因素
- 歐盟可再生能源指令III 2030年目標
- 國家生質能熱能利用促進體系
- 歐盟350億立方米生物甲烷藍圖
- 本公司承諾全年 365 天、每天 24 小時供應可再生熱能。
- 從燃煤發電廠轉型
- 生物能源碳捕獲與封存(BECCS)負排放帶來的收入來源
- 市場限制因素
- 永續原料和間接土地利用變化限制
- 顆粒進口物流和成本的波動
- 歐盟《零毀林法規》(EUDR)的負擔
- 電動車的廣泛普及正在削弱對液體生質燃料的長期需求。
- 供應鏈分析
- 監理情勢
- 技術展望
- 波特五力模型
第5章 市場規模與成長預測
- 按類型
- 固體生質能
- 沼氣
- 可再生廢棄物
- 其他類型
- 按原料
- 農業殘餘物
- 林業剩餘物
- 能源作物
- 一般廢棄物
- 透過技術
- 燃燒
- 氣化
- 快速熱解
- 厭氧消化
- 發酵
- 其他技術
- 透過使用
- 發電
- 熱量產生
- 運輸燃料
- 熱電聯產(CHP)
- 最終用戶
- 電力公司
- 商業和工業用途
- 住宅
- 國家
- 德國
- 英國
- 法國
- 義大利
- 西班牙
- 芬蘭
- 土耳其
- 其他歐洲國家
第6章 競爭情勢
- 市場集中度
- 策略性措施(併購、合資、資金籌措、購電協議)
- 市場佔有率分析(主要公司的市場排名和佔有率)
- 公司簡介
- Shell plc
- BP plc
- Drax Group plc
- ENGIE SA
- Verbio SE
- Vattenfall AB
- Neste Oyj
- TotalEnergies SE
- Bunge Ltd
- Air Liquide SA
- Greenergy International Ltd
- Abengoa Bioenergia SA
- Acciona Energia SA
- Harvest Energy Ltd
- CM Biomass Partners A/S
- Verbund AG
- Veolia Environnement SA
- Fortum Oyj
- Statkraft AS
- Ence Energia y Celulosa SA
第7章 市場機會與未來展望
According to Mordor Intelligence, the Europe bioenergy market size was valued at 47.5 gigawatt in 2025 and estimated to grow from 49.69 gigawatt in 2026 to reach 62.28 gigawatt by 2031, at a CAGR of 4.62% during the forecast period (2026-2031).
This report is Segmented by Type (Solid Biomass, Biogas, Renewable Waste, and Other Types), Feedstock (Agricultural Residues, Forestry Residues, and More), Technology (Combustion, Anaerobic Digestion, and More), Application (Electricity Generation, Transportation Fuel, and More), End-User (Power Utilities, Commercial and Industrial, and Residential), and Geography (Germany, United Kingdom, Spain, and More).
Europe Bioenergy Market Trends and Insights
EU Renewable Energy Directive III 2030 targets
Directive III obliges member states to reach a 42.5 % renewable-energy share by 2030 and sets binding transport, heat, and industry sub-targets, underpinning multi-year offtake for sustainable biomass and biomethane in sectors where electrification lags.
National biomass-heat incentive schemes
Germany's 2024 biomass package improved CHP feed-in tariffs and cut red tape for biogas upgrading, while Finland exempts district-heat biomass from carbon tax, sustaining fuel-switch economics that favor forestry residues.
Sustainable feedstock & ILUC caps
Crop-based fuels are capped at 7 % of transport energy, pushing buyers toward pricier residues and making certification paperwork more rigorous and costly.
Other drivers and restraints analyzed in the detailed report include:
- EU-wide 35 bcm biomethane roadmap
- Corporate 24/7 renewable-heat sourcing pledges
- EU Deforestation-Free Regulation burden
For complete list of drivers and restraints, kindly check the Table Of Contents.
Segment Analysis
Solid biomass retains 58.52 % of Europe bioenergy market size in 2025 thanks to CHP ubiquity. Growth, however, moderates as EUDR increases paperwork and as some district-heat operators test heat-pump retrofits. Biogas races ahead at a 6.44 % CAGR through 2031 as anaerobic digestion converts manure, crop residues, and food waste into grid-grade gas injected via over 1,200 connection points. Renewable-waste streams also rise where tipping-fee income offsets feedstock costs, enhancing plant cash flow resilience.
Forestry residues maintain the lion's share at 41.12 % but face traceability surcharges. Agricultural residues climb fastest at 6.02 % CAGR after mechanization slashes collection cost, while avoiding ILUC penalties. Energy crops remain niche due to land-use scrutiny, and municipal-solid-waste organics expand under EU landfill-diversion rules. Mechanization and logistics advances have trimmed agricultural-residue collection costs by up to 30%, opening price parity with imported pellets even before EUDR surcharge impacts.
Forest-residue dependence exposes operators to EUDR due-diligence fees estimated at EUR 15-25 per tonne, while sequential crops leverage local farms and existing grain-storage infrastructure for integrated supply. Organic and municipal waste streams also gain share under circular-economy legislation that obliges municipalities to divert biogenic waste from landfill, funneling feedstock into anaerobic digesters. Energy crops and algae remain in pilot phases but attract R&D subsidies for maritime and SAF feedstock diversification.
Complete Report Scope:
- By Type
- Solid Biomass
- Biogas
- Renewable Waste
- Other Types
- By Feedstock
- Agricultural Residues
- Forestry Residues
- Energy Crops
- Municipal Solid Waste
- By Technology
- Combustion
- Gasification
- Fast Pyrolysis
- Anaerobic Digestion
- Fermentation
- Other Technologies
- By Application
- Electricity Generation
- Heat Generation
- Transportation Fuel
- Combined Heat and Power (CHP)
- By End-user
- Power Utilities
- Commercial and Industrial
- Residential
- By Country
- Germany
- United Kingdom
- France
- Italy
- Spain
- Finland
- Turkey
- Rest of Europe
List of Companies Covered in this Report:
- Shell plc
- BP plc
- Drax Group plc
- ENGIE SA
- Verbio SE
- Vattenfall AB
- Neste Oyj
- TotalEnergies SE
- Bunge Ltd
- Air Liquide SA
- Greenergy International Ltd
- Abengoa Bioenergia SA
- Acciona Energia SA
- Harvest Energy Ltd
- CM Biomass Partners A/S
- Verbund AG
- Veolia Environnement SA
- Fortum Oyj
- Statkraft AS
- Ence Energia y Celulosa SA
Additional Benefits:
- The market estimate (ME) sheet in Excel format
- 3 months of analyst support
TABLE OF CONTENTS
1 Introduction
- 1.1 Study Assumptions & Market Definition
- 1.2 Scope of the Study
2 Research Methodology
3 Executive Summary
4 Market Landscape
- 4.1 Market Overview
- 4.2 Market Drivers
- 4.2.1 EU Renewable Energy Directive III 2030 targets
- 4.2.2 National biomass-heat incentive schemes
- 4.2.3 EU-wide 35 bcm biomethane roadmap
- 4.2.4 Corporate 24/7 renewable-heat sourcing pledges
- 4.2.5 Coal-to-biomass power-plant conversions
- 4.2.6 BECCS negative-emission revenue streams
- 4.3 Market Restraints
- 4.3.1 Sustainable feedstock & ILUC caps
- 4.3.2 Pellet-import logistics & cost volatility
- 4.3.3 EU Deforestation-Free Regulation (EUDR) burden
- 4.3.4 EV uptake diluting long-term liquid-biofuel demand
- 4.4 Supply-Chain Analysis
- 4.5 Regulatory Landscape
- 4.6 Technological Outlook
- 4.7 Porter's Five Forces
- 4.7.1 Bargaining Power - Suppliers
- 4.7.2 Bargaining Power - Buyers
- 4.7.3 Threat of New Entrants
- 4.7.4 Threat of Substitutes
- 4.7.5 Competitive Rivalry
5 Market Size & Growth Forecasts
- 5.1 By Type
- 5.1.1 Solid Biomass
- 5.1.2 Biogas
- 5.1.3 Renewable Waste
- 5.1.4 Other Types
- 5.2 By Feedstock
- 5.2.1 Agricultural Residues
- 5.2.2 Forestry Residues
- 5.2.3 Energy Crops
- 5.2.4 Municipal Solid Waste
- 5.3 By Technology
- 5.3.1 Combustion
- 5.3.2 Gasification
- 5.3.3 Fast Pyrolysis
- 5.3.4 Anaerobic Digestion
- 5.3.5 Fermentation
- 5.3.6 Other Technologies
- 5.4 By Application
- 5.4.1 Electricity Generation
- 5.4.2 Heat Generation
- 5.4.3 Transportation Fuel
- 5.4.4 Combined Heat and Power (CHP)
- 5.5 By End-user
- 5.5.1 Power Utilities
- 5.5.2 Commercial and Industrial
- 5.5.3 Residential
- 5.6 By Country
- 5.6.1 Germany
- 5.6.2 United Kingdom
- 5.6.3 France
- 5.6.4 Italy
- 5.6.5 Spain
- 5.6.6 Finland
- 5.6.7 Turkey
- 5.6.8 Rest of Europe
6 Competitive Landscape
- 6.1 Market Concentration
- 6.2 Strategic Moves (M&A, JVs, Funding, PPAs)
- 6.3 Market Share Analysis (Market Rank/Share for key companies)
- 6.4 Company Profiles (includes Global-level Overview, Market-level Overview, Core Segments, Financials, Strategic Information, Products & Services, Recent Developments)
- 6.4.1 Shell plc
- 6.4.2 BP plc
- 6.4.3 Drax Group plc
- 6.4.4 ENGIE SA
- 6.4.5 Verbio SE
- 6.4.6 Vattenfall AB
- 6.4.7 Neste Oyj
- 6.4.8 TotalEnergies SE
- 6.4.9 Bunge Ltd
- 6.4.10 Air Liquide SA
- 6.4.11 Greenergy International Ltd
- 6.4.12 Abengoa Bioenergia SA
- 6.4.13 Acciona Energia SA
- 6.4.14 Harvest Energy Ltd
- 6.4.15 CM Biomass Partners A/S
- 6.4.16 Verbund AG
- 6.4.17 Veolia Environnement SA
- 6.4.18 Fortum Oyj
- 6.4.19 Statkraft AS
- 6.4.20 Ence Energia y Celulosa SA
7 Market Opportunities & Future Outlook
- 7.1 White-space & Unmet-Need Assessment

 生質能源市場及捕碳封存(CCS):依儲存方式、原料、技術、最終用途、國家及地區分類-產業分析、市場規模、市場佔有率及預測(2026-2033 年)
 生質能源:市場佔有率分析、產業趨勢與統計、成長預測(2026-2031)
 生質能源市場:預測至2034年-全球原料、生質能源類型、轉化技術、應用、最終用戶、技術發展歷程、通路、設施規模、來源和區域分析
 生質能源市場機會、成長要素、產業趨勢分析及2026-2035年預測。生質能源市場及碳捕獲預測至2034年-全球原料、碳捕獲方法、技術、應用、終端用戶及區域分析
 生質能源市場報告:按產品類型、原料、應用和地區分類,2026-2034年
 生物熱電聯產市場規模、佔有率、成長及全球產業分析:按類型、應用和地區分類的洞察,2026-2034 年預測
 2026年全球生質能源市場報告
 生質能源市場分析及至2035年預測(含碳捕集與封存):依類型、產品、服務、技術、組件、應用、製程、最終用戶、安裝類型、解決方案分類
 生質能源市場-全球產業規模、佔有率、趨勢、機會及預測(依產品類型、原料、技術、應用、地區及競爭格局分類,2021-2031年)