


 |
市場調查報告書
商品編碼
2123300
印度設施管理:市場佔有率分析、產業趨勢與統計、成長預測(2026-2031)India Facility Management - Market Share Analysis, Industry Trends & Statistics, Growth Forecasts (2026 - 2031) |
||||||

※ 本網頁內容可能與最新版本有所差異。詳細情況請與我們聯繫。
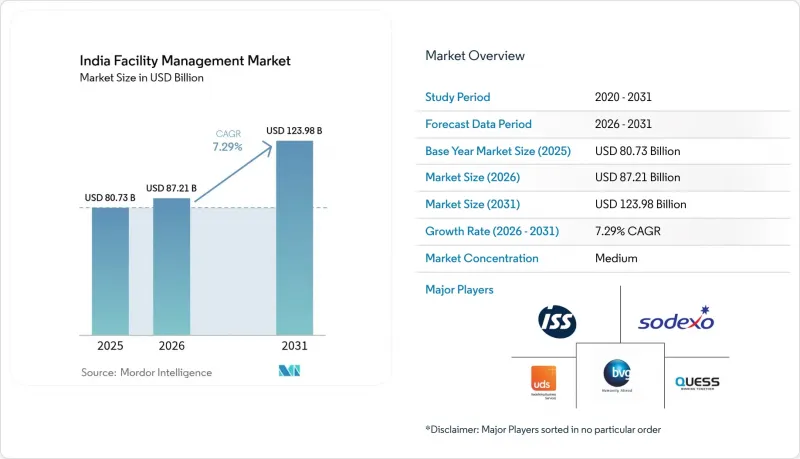
據 Mordor Intelligence 稱,印度設施管理市場規模預計將從 2026 年的 872.1 億美元成長到 2031 年的 1239.8 億美元,預計 2026 年至 2031 年的複合年成長率將達到 7.29%。
本報告依服務類型(硬性服務[資產管理等]、軟性服務[辦公室支援、保全等])、交付方式(內部營運、外包[單一設施管理、綜合設施管理等])及最終用戶產業(商業、飯店、公共/基礎設施、工業/流程等)分類。市場預測以美元計價。
印度設施管理市場趨勢與洞察
商業不動產的快速擴張
到2025年,開發商已建成超過7,900萬平方英尺的甲級辦公空間,使班加羅爾、海德拉巴和普納的空置率降至13%以下。新建建築規範要求配備智慧電錶、LEED或IGBC認證,以及符合2016年《國家建築標準法案》的消防安全系統。因此,設施管理人員負責最佳化全天候暖通空調系統,定期進行消防審計,並進行預測分析以最大限度地減少停機時間。靈活辦公空間提供者在關鍵細分市場擴大了供給能力,導致每日運轉率波動。這推動了佔用感測器和空間利用率儀錶板的使用。這些趨勢共同促使軟硬體一體化合約成為業主策略的重中之重。提供基於績效收費系統的綜合機械、清潔、保全和能源服務的供應商正在獲得長期租賃合約並實現更高的利潤率。
技術整合、物聯網、人工智慧和自動化
目前,物聯網感測器已在超過5億平方英尺的商業和工業空間中追蹤溫度、振動和電力狀況,並將數據傳輸到雲端平台,以便在故障發生前及時發現異常。人工智慧 (AI) 工具可評估歷史工單和資產遙測數據,從而實現維護干預,將意外停機時間減少高達30%。數位孿生技術可模擬維修和可再生能源部署,為資本投資決策提供支援。印度證券交易委員會 (SEBI) 已要求排名前1000名的上市公司揭露能源使用數據,這導致客戶對即時儀錶板的需求日益成長。能夠將建築管理軟體與企業資源規劃 (ERP) 平台整合的服務供應商將獲得競爭優勢。
人手不足和技能缺口
到2025年,大都會圈的清潔和保全產業的離職率將超過40%。這主要是由於大量員工轉向電子商務和零工經濟平台。技術業的熟練工人短缺問題更為嚴峻。每年從職業訓練機構畢業的暖通空調(HVAC)及建築管理系統(BMS)技術人員不足5萬人,而市場需求卻高達15萬人。因此,服務供應商不得不開設培訓機構和學徒項目,這增加了招募成本,也延長了員工的入職時間。如果合約中沒有自動價格調整條款,10%到12%的薪資成長就會對利潤率造成壓力。一些公司正在試點遠端監控以減少現場人員,但法規和客戶對現場人員的偏好仍然限制了這種方法的推廣規模。
細分市場分析
在印度,硬性服務業的成長速度超過了整體設施管理市場,年複合成長率高達 8.37%,這主要得益於監管合規要求和節能維修。 2016 年《國家建築標準法》強制要求高層建築安裝火災偵測和滅火系統,這推動了老舊建築群的維修計畫。印度能源效率局 (BEE) 的標準建議更換冷卻器並引入變頻驅動器,這可以將能耗降低高達 35%。因此,機構投資者和業主正在部署狀態監測系統,並在印度龐大的設施管理市場的支持下,獲得穩定且持續的回報。
2025年,日常清潔、辦公室支援和保全等軟性服務仍將佔總收入的66.52%。然而,隨著門禁系統和影像分析技術的普及,保全崗亭數量正在減少,保全密度已降至近三分之一,尤其是在新建的甲級辦公室。清潔服務正轉向收入更高的繩索作業和徹底的竣工後清潔。餐飲業正在推進菜單數位化和廢棄物追蹤,以實現健康目標。市場碎片化趨勢持續,規模經濟效益有限,但一些專注於專業消毒和布草滅菌的細分企業正在獲利。
其他好處:
- Excel格式的市場預測(ME)表
- 3個月的分析師支持
目錄
第1章:引言
- 研究假設和市場定義
- 調查範圍
第2章:調查方法
第3章執行摘要
第4章 市場狀況
- 市場概覽
- 目前運轉率
- 主要設施管理業者的盈利指標
- 勞動指標、勞動參與率
- 按服務類型分類的設施管理市場佔有率(%)
- 以硬性服務分類的設施管理市場佔有率(%)
- 按軟服務分類的設施管理市場佔有率(%)
- 主要大都會圈的都市化和人口成長
- 國家基礎設施規劃中的產業特定投資重點
- 與勞動和安全標準相關的監管因素
- 市場促進因素
- 商業不動產的快速擴張
- 技術整合、物聯網、人工智慧和自動化
- 外包趨勢正在加速發展。
- 衛生和健康監管要求
- 二線城市績效型設施管理合約的採用現狀
- 與環境、社會和治理 (ESG) 相關的融資正在促進綠色設施的更新。
- 市場限制因素
- 勞動力短缺和技能缺口
- 營運成本上升給利潤率帶來了壓力。
- 客戶對價格的高度敏感度和多樣化的採購慣例
- 智慧建築的自動化降低了對人工保全的需求。
- 產業價值鏈分析
- 監理情勢
- PESTLE分析
- 波特五力分析
- 宏觀經濟因素對市場的影響
- 投資和資金籌措分析
第5章 市場規模與成長預測
- 按服務類型
- 硬服務
- 資產管理
- 機電及暖通空調服務
- 消防系統和安全
- 其他硬設施管理服務
- 軟服務
- 辦公室支援和安全
- 清潔服務
- 餐飲服務
- 其他軟性設施管理服務
- 硬服務
- 按服務類型
- 內部
- 外包
- 單一設施管理
- 綜合設施管理
- 綜合設施管理
- 按最終用戶行業分類
- 商業的
- 飯店業
- 公共和基礎設施部門
- 醫療保健(公立機構、私立機構)
- 行業與流程
- 其他終端用戶產業
第6章 競爭情勢
- 市場集中度
- 策略趨勢
- 市佔率分析
- 公司簡介
- ISS Facility Management
- Sodexo Facilities Management Services India Pvt. Ltd.
- Quess Corporation
- Updater Services Pvt. Ltd.
- BVG India Ltd.
- Dusters Total Solutions Ltd.
- EFS Facilities Services
- G4S India
- Mortice Group PLC(TenonFM)
- ServiceMax Facility Management Pvt. Ltd.
- Knight Frank India
- Avon Facility Management Services Pvt. Ltd.
- Kleen Tek Solutions
- DTSS Facility Services
- Tenon Facility Management Pvt. Ltd.
- CBRE South Asia Pvt. Ltd.
- JLL Integrated Facilities Management
- Cushman and Wakefield Facilities Services India
- Colliers India
- Johnson Controls India
第7章 市場機會與未來展望
According to Mordor Intelligence, the India facility management market size is expected to increase from USD 87.21 billion in 2026 to reach USD 123.98 billion by 2031, growing at a CAGR of 7.29% over 2026-2031.
This report is Segmented by Service Type (Hard Services [Asset Management, and More], and Soft Services [Office Support and Security, and More]), Offering Type (In-House, and Outsourced [Single FM, Bundled FM, and More]), and End-User Industry (Commercial. Hospitality, Institutional and Public Infrastructure, Industrial and Process, and More). The Market Forecasts are Provided in Terms of Value (USD).
India Facility Management Market Trends and Insights
Rapid Commercial Real Estate Expansion
Developers completed more than 79 million sq ft of Grade A offices during 2025, keeping Bengaluru, Hyderabad and Pune below 13% vacancy. New-build specifications call for smart meters, LEED or IGBC certification and fire-safety systems aligned with the National Building Code 2016. Facility managers therefore handle round-the-clock HVAC optimization, periodic fire-audits and predictive analytics that minimize downtime. Flexible workspace operators added capacity in core micro-markets, creating variable daily occupancy that drives use of occupancy sensors and space-utilization dashboards. Collectively, these trends push bundled hard-and-soft contracts to the forefront of landlord strategy. Providers that can integrate mechanical, cleaning, security and energy services under performance-linked fees win longer tenures and higher margins.
Technology Integration, IoT, AI and Automation
IoT sensors now track temperature, vibration and power in more than 500 million sq ft of commercial and industrial space, feeding cloud platforms that flag anomalies well before failure. Artificial intelligence tools evaluate historical work orders and asset telemetry, enabling maintenance interventions that cut unplanned downtime by up to 30%. Digital twins simulate refurbishments and renewable-energy additions to guide capex decisions. The Securities and Exchange Board of India (SEBI) asked the top 1,000 listed firms to disclose energy-use data, so clients can increasingly demand real-time dashboards. Service providers able to connect building-management software with enterprise resource planning platforms gain competitive insulation.
Labour Shortages and Skill Gaps
Metro attrition in housekeeping and guarding exceeded 40% in 2025 as workers jumped to e-commerce and gig platforms. Technical trades show deeper deficits: vocational institutes graduate fewer than 50,000 HVAC and BMS technicians against 150,000 annual demand. Providers therefore run academies and apprenticeship programs, lifting recruitment costs and elongating ramp-up times. Wage inflation of 10%-12% compresses margins when contracts lack automatic escalation clauses. Some firms pilot remote monitoring to cut site headcount, but regulations and client preferences for physical presence still limit scale.
Other drivers and restraints analyzed in the detailed report include:
- Increasing Outsourcing Trend
- Hygiene and Health Compliance Mandates
- Margin Pressure from Rising Operational Costs
For complete list of drivers and restraints, kindly check the Table Of Contents.
Segment Analysis
Hard services generated faster growth than the overall India facility management market, expanding at an 8.37% CAGR thanks to mandatory compliance and energy-saving retrofits. The National Building Code 2016 obliges fire-detection and suppression in high-rise assets, spurring retrofit programs across older stock. Bureau of Energy Efficiency (BEE) codes encourage chiller replacement and variable-frequency drives that trim consumption by up to 35%. Consequently, institutional landlords deploy condition-based monitoring suites, creating sticky recurring revenue anchored to the India facility management market size.
Soft services still delivered 66.52% of 2025 revenue by virtue of daily cleaning, office support and guarding. However, manned-security posts are falling as access control and video analytics spread, particularly in new Grade A offices, reducing guard density by almost one-third. Cleaning moves toward rope-access facade works and post-construction deep cleans that command premiums. Catering digitizes menus and tracks waste to satisfy wellness targets. Fragmentation persists, constraining economies of scale, but niche operators carve profit in specialized disinfection or linen sterilization.
Complete Report Scope:
- By Service Type
- Hard Services
- Asset Management
- MEP and HVAC Services
- Fire Systems and Safety
- Other Hard Facility Management Services
- Soft Services
- Office Support and Security
- Cleaning Services
- Catering Services
- Other Soft Facility Management Services
- Hard Services
- By Offering Type
- In-house
- Outsourced
- Single Facility Management
- Bundled Facility Management
- Integrated Facility Management
- By End-User Industry
- Commercial
- Hospitality
- Institutional and Public Infrastructure
- Healthcare (Public Facilities, Private Facilities)
- Industrial and Process
- Other End-User Industries
List of Companies Covered in this Report:
- ISS Facility Management
- Sodexo Facilities Management Services India Pvt. Ltd.
- Quess Corporation
- Updater Services Pvt. Ltd.
- BVG India Ltd.
- Dusters Total Solutions Ltd.
- EFS Facilities Services
- G4S India
- Mortice Group PLC (TenonFM)
- ServiceMax Facility Management Pvt. Ltd.
- Knight Frank India
- Avon Facility Management Services Pvt. Ltd.
- Kleen Tek Solutions
- DTSS Facility Services
- Tenon Facility Management Pvt. Ltd.
- CBRE South Asia Pvt. Ltd.
- JLL Integrated Facilities Management
- Cushman and Wakefield Facilities Services India
- Colliers India
- Johnson Controls India
Additional Benefits:
- The market estimate (ME) sheet in Excel format
- 3 months of analyst support
TABLE OF CONTENTS
1 INTRODUCTION
- 1.1 Study Assumptions and Market Definition
- 1.2 Scope of the Study
2 RESEARCH METHODOLOGY
3 EXECUTIVE SUMMARY
4 MARKET LANDSCAPE
- 4.1 Market Overview
- 4.1.1 Current Occupancy Rates
- 4.1.2 Profitability Rates of Major FM Players
- 4.1.3 Workforce Indicators, Labor Participation
- 4.1.4 Facility Management Market Share (%) by Service Type
- 4.1.5 Facility Management Market Share (%) by Hard Services
- 4.1.6 Facility Management Market Share (%) by Soft Services
- 4.1.7 Urbanization and Population Growth in Major Metros
- 4.1.8 Sector Investment Priorities in National Infrastructure Pipeline
- 4.1.9 Regulatory Drivers Specific to Labor and Safety Standards
- 4.2 Market Drivers
- 4.2.1 Rapid Commercial Real Estate Expansion
- 4.2.2 Technology Integration, IoT, AI, and Automation
- 4.2.3 Increasing Outsourcing Trend
- 4.2.4 Hygiene and Health Compliance Mandates
- 4.2.5 Uptake of Outcome-Based FM Contracts in Tier-2 Cities
- 4.2.6 ESG-Linked Lending Driving Green Facility Upgrades
- 4.3 Market Restraints
- 4.3.1 Labor Shortages and Skill Gaps
- 4.3.2 Margin Pressure from Rising Operational Costs
- 4.3.3 High Client Price Sensitivity and Fragmented Procurement Practices
- 4.3.4 Smart-Building Automation Reducing Manned-Guarding Demand
- 4.4 Industry Value Chain Analysis
- 4.5 Regulatory Landscape
- 4.6 PESTEL Analysis
- 4.7 Porter's Five Forces Analysis
- 4.7.1 Bargaining Power of Suppliers
- 4.7.2 Bargaining Power of Buyers
- 4.7.3 Threat of New Entrants
- 4.7.4 Threat of Substitute Services
- 4.7.5 Intensity of Competitive Rivalry
- 4.8 Impact of Macroeconomic Factors on the Market
- 4.9 Investment and Funding Analysis
5 MARKET SIZE AND GROWTH FORECASTS (VALUE)
- 5.1 By Service Type
- 5.1.1 Hard Services
- 5.1.1.1 Asset Management
- 5.1.1.2 MEP and HVAC Services
- 5.1.1.3 Fire Systems and Safety
- 5.1.1.4 Other Hard Facility Management Services
- 5.1.2 Soft Services
- 5.1.2.1 Office Support and Security
- 5.1.2.2 Cleaning Services
- 5.1.2.3 Catering Services
- 5.1.2.4 Other Soft Facility Management Services
- 5.1.1 Hard Services
- 5.2 By Offering Type
- 5.2.1 In-house
- 5.2.2 Outsourced
- 5.2.2.1 Single Facility Management
- 5.2.2.2 Bundled Facility Management
- 5.2.2.3 Integrated Facility Management
- 5.3 By End-User Industry
- 5.3.1 Commercial
- 5.3.2 Hospitality
- 5.3.3 Institutional and Public Infrastructure
- 5.3.4 Healthcare (Public Facilities, Private Facilities)
- 5.3.5 Industrial and Process
- 5.3.6 Other End-User Industries
6 COMPETITIVE LANDSCAPE
- 6.1 Market Concentration
- 6.2 Strategic Moves
- 6.3 Market Share Analysis
- 6.4 Company Profiles (includes Global Level Overview, Market Level Overview, Core Segments, Financials as available, Strategic Information, Market Rank/Share, Products and Services, Recent Developments)
- 6.4.1 ISS Facility Management
- 6.4.2 Sodexo Facilities Management Services India Pvt. Ltd.
- 6.4.3 Quess Corporation
- 6.4.4 Updater Services Pvt. Ltd.
- 6.4.5 BVG India Ltd.
- 6.4.6 Dusters Total Solutions Ltd.
- 6.4.7 EFS Facilities Services
- 6.4.8 G4S India
- 6.4.9 Mortice Group PLC (TenonFM)
- 6.4.10 ServiceMax Facility Management Pvt. Ltd.
- 6.4.11 Knight Frank India
- 6.4.12 Avon Facility Management Services Pvt. Ltd.
- 6.4.13 Kleen Tek Solutions
- 6.4.14 DTSS Facility Services
- 6.4.15 Tenon Facility Management Pvt. Ltd.
- 6.4.16 CBRE South Asia Pvt. Ltd.
- 6.4.17 JLL Integrated Facilities Management
- 6.4.18 Cushman and Wakefield Facilities Services India
- 6.4.19 Colliers India
- 6.4.20 Johnson Controls India
7 MARKET OPPORTUNITIES AND FUTURE OUTLOOK
- 7.1 White-space and Unmet-Need Assessment
- 7.2 Technology-Led Integrated FM (IoT, BMS, AI-Based Predictive Maintenance)
- 7.3 ESG-Compliant FM Solutions Demand
- 7.4 Future Service-Model Shifts, Outcome-Based Contracts
- 7.5 Data-Driven Energy Optimization and Carbon Reporting Services

 2026-2030年全球設施管理市場
 設施管理(FM)軟體:市場佔有率分析、行業趨勢和統計數據以及成長預測(2026-2031 年)北美設施管理:市場佔有率分析、產業趨勢與統計、成長預測(2026-2031 年)亞太地區硬設施管理:市場佔有率分析、產業趨勢與統計及成長預測(2026-2031)硬設施管理:市場佔有率分析、產業趨勢與統計、成長預測(2026-2031 年)日本設施管理:市場佔有率分析、產業趨勢與統計及成長預測(2026-2031)
 Frost Radar™:泰國設施管理,2026 年中國設施管理:市場佔有率分析、產業趨勢與統計、成長預測(2026-2031)印尼設施管理:市場佔有率分析、產業趨勢與統計、成長預測(2026-2031)德國設施管理:市場佔有率分析、產業趨勢與統計、成長預測(2026-2031)