


 |
市場調查報告書
商品編碼
2122914
宅配、速遞和小包裹遞送 (CEP):市場佔有率分析、行業趨勢和統計數據以及成長預測 (2026-2031)Courier, Express, And Parcel (CEP) - Market Share Analysis, Industry Trends & Statistics, Growth Forecasts (2026 - 2031) |
||||||

※ 本網頁內容可能與最新版本有所差異。詳細情況請與我們聯繫。
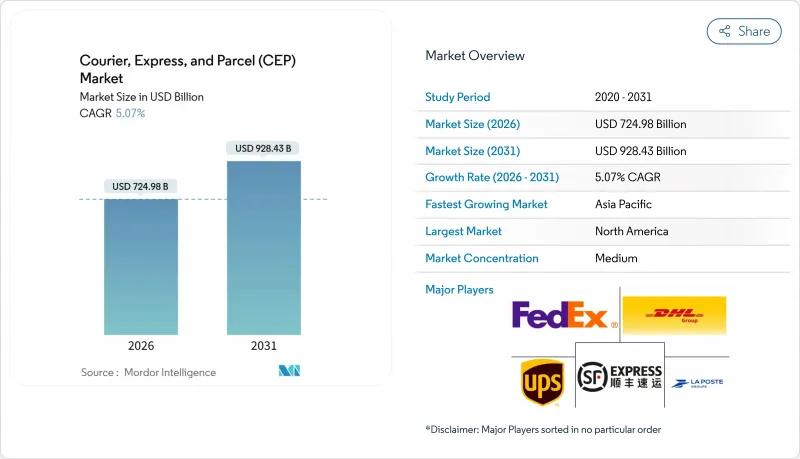
根據 Mordor Intelligence 估計,宅配、速遞和小包裹(CEP) 市場規模在 2026 年將達到 7,249.8 億美元,預計到 2031 年將達到 9,284.3 億美元,在預測期(2026-2031 年)內以 5.07% 的複合年成長率成長。
本報告按目的地(國內、其他)、配送速度(快遞、非快遞)、模式(企業對消費者 (B2C)、其他)、貨物重量(按重量計費、其他)、運輸方式(空運、陸運、其他)、最終用戶行業(電子商務、醫療保健、其他)和地區(歐洲及其他)進行細分。市場預測以美元計價。
全球宅配、速遞與小包裹(CEP) 市場趨勢與洞察
B2C電子商務小包裹處理量呈爆炸性成長
預計2025年,全球線上零售小包裹量將達到1,310億件,到2031年將達到1,780億件。這主要得益於印度、印尼和巴西智慧型手機普及率的提高,推動了與中國的差距不斷縮小。在中國,電子商務佔零售總額的52%。跨境物流的成長速度超過了國內物流,像Temu和Shein這樣的市場繞過了本地分銷網路,在兩週內將訂單從工廠直接運送到聖保羅和拉各斯。為了因應這項挑戰,物流整合商用面積小於5000平方英尺的城市微型倉庫叢集取代了大型樞紐。這使得兩小時內即可送達,提高了每平方公里的小包裹密度,而包裹密度已成為重要的收入來源。社交電商也加劇了物流的壓力;預計到2025年,TikTok Shop在東南亞每天將處理300萬個訂單,這意味著大量輕型小包裹將被送入物流網路,而這些網路此前並不習慣處理如此不均勻的重量分佈。
對當日達和按需配送的期望
目前,全球47個城市的消費者在付款後四小時內即可收到38%的線上訂單。這項服務曾經僅限於熱食和緊急處方快遞。據UPS稱,雖然2023年至2025年間當日達的需求加倍,但消費者願意為此支付額外費用的意願卻下降了31%,這迫使承運商將快遞與陸運相結合,在可以接受延誤的情況下,以維持資產運轉率。亞馬遜Prime等訂閱模式已讓2.1億會員養成了「隔天達」的習慣,承運商正爭相利用即時交通數據最佳化兩小時送達時段,但只有18%的本地業者擁有此類數據,這給利潤率帶來了壓力。零售商正在補貼最後一公里配送速度以提高客戶終身價值(CLV),而這部分成本負擔再次轉嫁給了本已面臨人手不足的宅配網路。
燃油價格波動和附加費上漲
預計2025年布蘭特原油均價將降至每桶84美元,低於2024年每桶92美元的高點。然而,由於承運商在高價位進行避險,噴射機燃料額外費用仍維持在基本快遞費率的11.5%。聯邦快遞透露,額外費用使其收入增加了28億美元,但由於托運人降低了服務水平,貨運量下降了9%。柴油價格的波動迫使每月調整附加費,削弱了托運人的信心,導致運輸方式轉向「延誤的地面運輸」。國際航空運輸協會(IATA)的數據顯示,航空網路仍然脆弱,燃油成本目前佔營運成本的28%,高於2020年的22%。
細分市場分析
預計到2025年,電子商務將佔小包裹運輸總量的37.07%,但在線上滲透率接近飽和的成熟地區,其成長速度目前正在放緩。相較之下,由於細胞和基因療法需要精確的溫度控制(低至-80 度C),醫療保健物流預計將以5.68%的複合年成長率(2026-2031年)成長,這將逐年提升對溫度敏感貨物的宅配、快遞和小包裹市場佔有率。聯邦快遞(FedEx)已營運90個具備即時物聯網監控能力的冷鏈設施,從而獲得40%的價格溢價,並吸引了尋求避免產品損失風險的生物製藥公司。
製造業小包裹佔18%,呈現穩定但溫和的成長;而金融、保險和證券(BFSI)產業則因數位簽章取代紙本文件而萎縮。批發和零售庫存補貨正以3.2%的複合年成長率成長,隨著門市履約中心的功能,直接面對消費者的分銷管道與批發零售之間的界線日益模糊。一級產業和政府相關貨物的運輸仍是規模雖小但穩定的細分市場。總體而言,醫療保健產業正在崛起成為成長動力,抵消了高所得市場電子商務平台成長乏力的影響。
預計2026年至2031年國際航運將以5.36%的複合年成長率成長,但2025年國內航運仍將佔總收入的68.98%。隨著小額貨物(低價值貨物)管制的放鬆,清關時間從5天縮短至36小時,國際物流中宅配、速遞和小包裹遞送的市場規模預計將會擴大。中國市場每年跨境小包裹吞吐量已達21億件,並利用萊比錫和列日的保稅樞紐提升歐盟內部的效率。然而,印度都市區的基礎設施差異以及長達7天的清關等待時間仍然存在,削弱了空運快遞的速度優勢。國內高密度經濟(宅配業者每天完成180次遞送)使其在城市網路中保持成本領先地位,即使面向全球消費者的庫存不斷成長。
在國際航線上,承運商需承擔每件小包裹12至18美元的結構性成本溢價,用於空運、關稅以及向合作郵政業者的遞送。但由於規模經濟和一體化營運商對保稅倉庫的投資,這一差距正在縮小。區域貿易協定,例如東協電子商務協定,減少了繁瑣的文書工作,使亞洲境內的小包裹運輸速度幾乎與國內運輸一樣快。目前,承運商正透過端到端透明度和包含關稅的支付方式等特色功能來提升其跨境遞送服務的差異化優勢,從而吸引了使用Etsy和Shopify等平台的中小型企業的重複業務。隨著海關系統日益數位化,輕型小包裹的需求正在宅配、速遞和小包裹市場進一步成長。先前,由於到達成本計算不透明,輕型包裹一直被人們所忽視。
區域分析
預計到2025年,北美將佔亞馬遜總收入的36.37%,這主要得益於其在90個主要都會區擁有1.6億亞馬遜Prime用戶,他們享受著當日送達服務帶來的便利。該地區擁有龐大的地址資料庫和成熟的州際貨運網路,但2023年至2025年間,最後一公里配送的勞動成本將上漲18%。當日送達服務已擴展至47個城市,但由於消費者不願支付額外費用,承運商難以維持利潤率。加拿大每年18億件的小包裹以及墨西哥與美國跨境貿易的激增,正在推高整個北美大陸的配送密度。
亞太地區預計將以6.72%的複合年成長率(2026-2031年)超越其他所有地區,主要成長動力來自中國2025年1200億件國內小包裹和印度2025年90億件的包裹遞送量。行動錢包普及率在中國達到87%,在印度達到72%,有效降低了貨到付款帶來的摩擦。印尼、越南和菲律賓預計2025年包裹遞送量將總合達60億小包裹,年增28%。在日本和澳洲面臨勞動力短缺的背景下,自動化配送試點計畫正在推進,例如大和運輸的與工資掛鉤的機器人巡檢作業和澳洲郵政的郊區配送機器人。
預計到2025年,歐洲將佔全球銷售額的28%,但由於電子商務滲透率停滯在19%左右,以及根據《包裝廢棄物法規》到2030年強制要求使用90%可回收材料,其複合年成長率僅為4.1%。合規成本和人事費用的上升正擠壓利潤率,而東歐的小包裹量則實現了兩位數成長,這主要得益於德國和荷蘭的跨境出口。中東和非洲受到海關延誤和地址不清晰等問題的限制,但海灣國家航空連通性的改善推動了7%的銷售成長。南美洲佔全球銷售額的5%,主要得益於巴西32億件的小包裹,但由於外匯波動,其成長速度正在放緩。
其他好處
- Excel格式的市場預測(ME)表
- 3個月的分析師支持
目錄
第1章:引言
- 研究假設和市場定義
- 調查範圍
第2章:調查方法
第3章執行摘要
第4章 市場狀況
- 市場概覽
- 人口統計數據
- 按經濟活動分類的GDP構成
- 按經濟活動分類的GDP成長率
- 通貨膨脹
- 經濟表現及概覽
- 電子商務產業的趨勢
- 製造業的發展趨勢
- 運輸和倉儲部門的GDP
- 出口趨勢
- 進口趨勢
- 燃油價格
- 物流績效
- 基礎設施
- 法律規範
- 價值鍊和通路分析
- 市場促進因素
- B2C電子商務小包裹處理量的爆炸性成長。
- 對當日達和按需配送的期望
- 跨境貿易自由化與最低限度門檻
- 分類中心的自動化和物聯網實施
- 雲端運輸和零工經濟配送網路
- 城市整合-市議會發布中心城區發展指令
- 市場限制因素
- 燃油價格波動和附加費上漲
- 最後一公里運輸面臨嚴重的人手不足和薪資上漲問題
- 商用無人機/無人飛行器配送的監理延誤
- 城市中心郊區微型倉配中心的區域分類限制
- 市場上的技術創新
- 波特五力分析
第5章 市場規模與成長預測
- 按目的地
- 國內的
- 國際的
- 配送速度
- 表達
- 非加速
- 特定型號
- 企業對企業 (B2B) 交易
- 企業對消費者 (B2C)
- 消費者對消費者(C2C)交易
- 按運輸重量
- 按重量計費
- 輕便運輸
- 中等大量出貨
- 透過運輸方式
- 航空
- 路
- 其他
- 按最終用戶行業分類
- 電子商務
- 金融服務(BFSI)
- 衛生保健
- 製造業
- 一級產業
- 批發和零售貿易(線下)
- 其他
- 按地區
- 亞太地區
- 國家
- 澳洲
- 中國
- 印度
- 印尼
- 日本
- 馬來西亞
- 巴基斯坦
- 菲律賓
- 泰國
- 越南
- 其他亞太國家
- 國家
- 歐洲
- 國家
- 阿爾巴尼亞
- 保加利亞
- 克羅埃西亞
- 捷克共和國
- 丹麥
- 愛沙尼亞
- 芬蘭
- 法國
- 德國
- 匈牙利
- 冰島
- 義大利
- 拉脫維亞
- 立陶宛
- 荷蘭
- 挪威
- 波蘭
- 羅馬尼亞
- 俄羅斯
- 斯洛伐克共和國
- 斯洛維尼亞
- 西班牙
- 瑞典
- 瑞士
- 英國
- 其他歐洲國家
- 國家
- 中東和非洲
- 國家
- 埃及
- 奈及利亞
- 卡達
- 沙烏地阿拉伯
- 南非
- GCC
- 阿拉伯聯合大公國
- 其他中東和非洲國家
- 國家
- 北美洲
- 國家
- 加拿大
- 墨西哥
- 美國
- 其他北方
- 國家
- 南美洲
- 國家
- 阿根廷
- 巴西
- 智利
- 南美洲其他地區
- 國家
- 其他
第6章 競爭情勢
- 市場集中度
- 關鍵策略趨勢
- 市佔率分析
- 公司簡介
- All Cargo Logistics
- Aramex
- Australia Post
- Blue Dart Express, Ltd.
- Cainiao Network Technology Co., Ltd.
- 加拿大郵政(包括 Purolator 公司)
- CJ Logistics Corporation
- Correios de Portugal SA(CTT)
- DHL Express
- DSV A/S
- FedEx
- International Distribution Services plc
- Japan Post Holdings Co., Ltd.
- JD Logistics, Inc.
- Korea Post
- La Poste Group(GeoPost/DPDgroup)
- Osterreichische Post AG
- Otto Group
- Pos Indonesia
- Poste Italiane
- Posten Norge AS(Bring)
- PostNL
- Seino Holdings Co., Ltd.
- SF Holdings(SF Express)
- Singapore Post, Ltd.
- TFI International, Inc.
- United Parcel Service of America, Inc.(UPS)
- Yamato Holdings Co., Ltd.
- ZTO Express(Cayman)Inc.
第7章 市場機會與未來展望
According to Mordor Intelligence, the courier, express, and parcel (CEP) market size is estimated at USD 724.98 billion in 2026, and is expected to reach USD 928.43 billion by 2031, at a CAGR of 5.07% during the forecast period (2026-2031).
This report is Segmented by Destination (Domestic and More), Speed of Delivery (Express and Non-Express), Model (Business-To-Consumer (B2C) and More), Shipment Weight (Heavy Weight Shipments and More), Mode of Transport (Air, Road, and Others), End User Industry (E-Commerce, Healthcare, and More), and Geography (Europe and More). The Market Forecasts are Provided in Terms of Value (USD).
Global Courier, Express, And Parcel (CEP) Market Trends and Insights
Explosive B2C E-Commerce Parcel Volumes
Online retail produced 131 billion parcels globally in 2025 and is tracking toward 178 billion by 2031 as rising smartphone penetration in India, Indonesia and Brazil closes the gap with China's 52% e-commerce share of retail sales. Cross-border flows outpace domestic growth because marketplaces such as Temu and Shein bypass local distribution, shipping factory-direct orders to Sao Paulo or Lagos in under two weeks. To cope, integrators have replaced megahubs with clusters of urban micro-warehouses under 5,000 square feet, enabling two-hour delivery windows that elevate parcel density per square kilometer as the primary profit lever. Social commerce compounds the load, with TikTok Shop processing 3 million daily orders in Southeast Asia during 2025 and sending an equivalent number of lightweight parcels into networks unaccustomed to such skewed weight profiles.
Same-Day and On-Demand Delivery Expectations
Consumers in 47 global cities now receive 38% of online orders within four hours of checkout, a service once limited to hot meals and urgent prescriptions. UPS noted same-day requests doubled between 2023 and 2025 even as willingness to pay premium fees fell 31%, forcing carriers to bundle expedited volume with deferred ground to preserve asset utilization. Subscription models like Amazon Prime train 210 million members to treat next-day as baseline, crowding margins as carriers scramble to optimize two-hour windows through real-time traffic data that just 18% of regional operators possess. Retailers subsidize last-mile speed to win customer lifetime value, shifting the cost burden back onto parcel networks already pressured by labor shortages.
Fuel-Price Volatility and Rising Surcharges
Brent averaged USD 84 per barrel in 2025, down from the USD 92 spike in 2024, yet jet-fuel surcharges lingered at 11.5% of base express rates after carriers hedged at higher prices. FedEx revealed surcharges lifted revenue by USD 2.8 billion but drove a 9% volume decline as shippers downgraded service levels. Diesel swings forced monthly surcharge resets, eroding shipper trust and pushing modal shifts toward deferred ground. Air networks remain exposed, with IATA noting fuel now represents 28% of operating costs, up from 22% in 2020.
Other drivers and restraints analyzed in the detailed report include:
- Liberalization of Cross-Border De Minimis Thresholds
- Automation and IoT Adoption in Sortation Hubs
- Acute Labor Shortages and Wage Inflation
For complete list of drivers and restraints, kindly check the Table Of Contents.
Segment Analysis
E-commerce commanded 37.07% of 2025 parcels but now decelerates in mature regions where online penetration nears saturation. Healthcare logistics, by contrast, will grow at a 5.68% CAGR (2026-2031) as cell-and-gene therapies demand precise -80 °C control, pushing the Courier, Express and Parcel market share of temperature-sensitive freight higher each year. FedEx already runs 90 cold-chain facilities with real-time IoT monitoring, securing 40% pricing premiums and capturing biopharma accounts unwilling to risk product loss.
Manufacturing accounts for 18% of parcels, steady but slow, while BFSI slips as digital signatures displace physical documents. Wholesale and retail inventory replenishment grows 3.2% CAGR, increasingly blurred with direct-to-consumer channels as stores double as fulfillment nodes. Primary industries and government shipments remain low-volume, stable niches. Overall, healthcare emerges as the growth engine that offsets plateauing e-commerce in high-income markets.
International shipments will expand at a 5.36% CAGR between 2026-2031, though domestic still anchors 68.98% of revenue in 2025. The Courier, Express and Parcel market size for international flows is projected to rise as de minimis liberalization trims clearance time from five days to 36 hours. Chinese marketplaces already drive 2.1 billion cross-border parcels a year, routing through bonded hubs in Leipzig and Liege to exploit intra-EU efficiencies. However, infrastructure gaps and seven-day customs queues persist at India's ports, tempering the speed advantage of express air. Domestic density economics, where a courier completes 180 daily stops, continue to yield cost leadership for urban networks even as global shoppers expand their addressable inventory.
International lanes shoulder USD 12-18 per parcel in structural cost premiums for air, brokerage, and partner-postal handoffs, but scale economies and bonded warehouse investment by integrators are closing the gap. Regional trade agreements such as ASEAN's e-commerce pact reduce documentary friction, enabling intra-Asia parcels to move with near-domestic velocity. Carriers now differentiate cross-border offers by end-to-end visibility and duty-paid checkout, features that win repeat small-business sellers on Etsy and Shopify. As customs systems digitalize, the Courier, Express and Parcel market unlocks an additional layer of lightweight parcels previously deterred by opaque landed-cost calculations.
Complete Report Scope:
- By Destination
- Domestic
- International
- By Speed of Delivery
- Express
- Non-Express
- By Model
- Business-to-Business (B2B)
- Business-to-Consumer (B2C)
- Consumer-to-Consumer (C2C)
- By Shipment Weight
- Heavy Weight Shipments
- Light Weight Shipments
- Medium Weight Shipments
- By Mode of Transport
- Air
- Road
- Others
- By End User Industry
- E-Commerce
- Financial Services (BFSI)
- Healthcare
- Manufacturing
- Primary Industry
- Wholesale and Retail Trade (Offline)
- Others
- By Region
- Asia-Pacific
- By Country
- Australia
- China
- India
- Indonesia
- Japan
- Malaysia
- Pakistan
- Philippines
- Thailand
- Vietnam
- Rest of Asia-Pacific
- By Country
- Europe
- By Country
- Albania
- Bulgaria
- Croatia
- Czech Republic
- Denmark
- Estonia
- Finland
- France
- Germany
- Hungary
- Iceland
- Italy
- Latvia
- Lithuania
- Netherlands
- Norway
- Poland
- Romania
- Russia
- Slovak Republic
- Slovenia
- Spain
- Sweden
- Switzerland
- United Kingdom
- Rest of Europe
- By Country
- Middle East and Africa
- By Country
- Egypt
- Nigeria
- Qatar
- Saudi Arabia
- South Africa
- GCC
- UAE
- Rest of Middle East and Africa
- By Country
- North America
- By Country
- Canada
- Mexico
- United States
- Rest of North America
- By Country
- South America
- By Country
- Argentina
- Brazil
- Chile
- Rest of South America
- By Country
- Rest of World
- Asia-Pacific
Geography Analysis
North America contributed 36.37% of 2025 revenue, largely from 160 million Amazon Prime subscribers who normalize same-day expectations across 90 metros. The region benefits from deep address databases and mature inter-state trucking, yet faces 18% wage inflation in last-mile labor between 2023 and 2025. Same-day now reaches 47 cities, but carriers battle margin erosion as customers recoil from surcharges. Canada's 1.8 billion parcels and Mexico's cross-border boom with the United States reinforce continental density.
Asia-Pacific will outpace all regions with a 6.72% CAGR (2026-2031), propelled by China's 120 billion domestic parcels and India's 9 billion shipments in 2025. Mobile-wallet penetration of 87% in China and 72% in India erodes cash-on-delivery friction, while Indonesia, Vietnam, and the Philippines collectively delivered 6 billion parcels in 2025, a 28% jump. Labor scarcity in Japan and Australia drives autonomous-delivery pilots, from Yamato's wage-linked robot trials to Australia Post's suburban rovers.
Europe generated 28% of revenue in 2025 but grows more slowly at a 4.1% CAGR as e-commerce penetration plateaus near 19% and the Packaging Waste Regulation mandates 90% recyclable materials by 2030. Compliance costs and rising labor rates trim margins, while Eastern Europe posts double-digit parcel growth on back of German and Dutch cross-border exports. Middle East and Africa deliver 7% of revenue, constrained by customs delays and address ambiguity, though Gulf states improve air-lane connectivity. South America adds 5% of revenue, with Brazil's 3.2 billion parcels leading but dampened by currency volatility.
- All Cargo Logistics
- Aramex
- Australia Post
- Blue Dart Express, Ltd.
- Cainiao Network Technology Co., Ltd.
- Canada Post (including Purolator, Inc.)
- CJ Logistics Corporation
- Correios de Portugal S.A. (CTT)
- DHL Express
- DSV A/S
- FedEx
- International Distribution Services plc
- Japan Post Holdings Co., Ltd.
- JD Logistics, Inc.
- Korea Post
- La Poste Group (GeoPost / DPDgroup)
- Osterreichische Post AG
- Otto Group
- Pos Indonesia
- Poste Italiane
- Posten Norge AS (Bring)
- PostNL
- Seino Holdings Co., Ltd.
- SF Holdings (SF Express)
- Singapore Post, Ltd.
- TFI International, Inc.
- United Parcel Service of America, Inc. (UPS)
- Yamato Holdings Co., Ltd.
- ZTO Express (Cayman) Inc.
Additional Benefits:
- The market estimate (ME) sheet in Excel format
- 3 months of analyst support
TABLE OF CONTENTS
1 Introduction
- 1.1 Study Assumptions and Market Definition
- 1.2 Scope of the Study
2 Research Methodology
3 Executive Summary
4 Market Landscape
- 4.1 Market Overview
- 4.2 Demographics
- 4.3 GDP Distribution by Economic Activity
- 4.4 GDP Growth by Economic Activity
- 4.5 Inflation
- 4.6 Economic Performance and Profile
- 4.6.1 Trends in E-Commerce Industry
- 4.6.2 Trends in Manufacturing Industry
- 4.7 Transport and Storage Sector GDP
- 4.8 Export Trends
- 4.9 Import Trends
- 4.10 Fuel Price
- 4.11 Logistics Performance
- 4.12 Infrastructure
- 4.13 Regulatory Framework
- 4.14 Value Chain and Distribution Channel Analysis
- 4.15 Market Drivers
- 4.15.1 Explosive B2C E-Commerce Parcel Volumes
- 4.15.2 Same-Day and On-Demand Delivery Expectations
- 4.15.3 Liberalization of Cross-Border Trade and De-Minimis Thresholds
- 4.15.4 Automation and IoT Adoption in Sortation Hubs
- 4.15.5 Crowd-Shipping and Gig-Economy Delivery Networks
- 4.15.6 Urban Consolidation-Center Mandates by City Councils
- 4.16 Market Restraints
- 4.16.1 Fuel-Price Volatility and Rising Surcharges
- 4.16.2 Acute Labor Shortages and Wage Inflation in Last-Mile
- 4.16.3 Regulatory Delays on Commercial UAV/Drone Delivery
- 4.16.4 Zoning Limits on Micro-Fulfillment Centres Near City Cores
- 4.17 Technology Innovations in the Market
- 4.18 Porter's Five Forces Analysis
- 4.18.1 Threat of New Entrants
- 4.18.2 Bargaining Power of Buyers
- 4.18.3 Bargaining Power of Suppliers
- 4.18.4 Threat of Substitutes
- 4.18.5 Competitive Rivalry
5 Market Size and Growth Forecasts (Value, USD)
- 5.1 By Destination
- 5.1.1 Domestic
- 5.1.2 International
- 5.2 By Speed of Delivery
- 5.2.1 Express
- 5.2.2 Non-Express
- 5.3 By Model
- 5.3.1 Business-to-Business (B2B)
- 5.3.2 Business-to-Consumer (B2C)
- 5.3.3 Consumer-to-Consumer (C2C)
- 5.4 By Shipment Weight
- 5.4.1 Heavy Weight Shipments
- 5.4.2 Light Weight Shipments
- 5.4.3 Medium Weight Shipments
- 5.5 By Mode of Transport
- 5.5.1 Air
- 5.5.2 Road
- 5.5.3 Others
- 5.6 By End User Industry
- 5.6.1 E-Commerce
- 5.6.2 Financial Services (BFSI)
- 5.6.3 Healthcare
- 5.6.4 Manufacturing
- 5.6.5 Primary Industry
- 5.6.6 Wholesale and Retail Trade (Offline)
- 5.6.7 Others
- 5.7 By Region
- 5.7.1 Asia-Pacific
- 5.7.1.1 By Country
- 5.7.1.1.1 Australia
- 5.7.1.1.2 China
- 5.7.1.1.3 India
- 5.7.1.1.4 Indonesia
- 5.7.1.1.5 Japan
- 5.7.1.1.6 Malaysia
- 5.7.1.1.7 Pakistan
- 5.7.1.1.8 Philippines
- 5.7.1.1.9 Thailand
- 5.7.1.1.10 Vietnam
- 5.7.1.1.11 Rest of Asia-Pacific
- 5.7.1.1 By Country
- 5.7.2 Europe
- 5.7.2.1 By Country
- 5.7.2.1.1 Albania
- 5.7.2.1.2 Bulgaria
- 5.7.2.1.3 Croatia
- 5.7.2.1.4 Czech Republic
- 5.7.2.1.5 Denmark
- 5.7.2.1.6 Estonia
- 5.7.2.1.7 Finland
- 5.7.2.1.8 France
- 5.7.2.1.9 Germany
- 5.7.2.1.10 Hungary
- 5.7.2.1.11 Iceland
- 5.7.2.1.12 Italy
- 5.7.2.1.13 Latvia
- 5.7.2.1.14 Lithuania
- 5.7.2.1.15 Netherlands
- 5.7.2.1.16 Norway
- 5.7.2.1.17 Poland
- 5.7.2.1.18 Romania
- 5.7.2.1.19 Russia
- 5.7.2.1.20 Slovak Republic
- 5.7.2.1.21 Slovenia
- 5.7.2.1.22 Spain
- 5.7.2.1.23 Sweden
- 5.7.2.1.24 Switzerland
- 5.7.2.1.25 United Kingdom
- 5.7.2.1.26 Rest of Europe
- 5.7.2.1 By Country
- 5.7.3 Middle East and Africa
- 5.7.3.1 By Country
- 5.7.3.1.1 Egypt
- 5.7.3.1.2 Nigeria
- 5.7.3.1.3 Qatar
- 5.7.3.1.4 Saudi Arabia
- 5.7.3.1.5 South Africa
- 5.7.3.1.6 GCC
- 5.7.3.1.7 UAE
- 5.7.3.1.8 Rest of Middle East and Africa
- 5.7.3.1 By Country
- 5.7.4 North America
- 5.7.4.1 By Country
- 5.7.4.1.1 Canada
- 5.7.4.1.2 Mexico
- 5.7.4.1.3 United States
- 5.7.4.1.4 Rest of North America
- 5.7.4.1 By Country
- 5.7.5 South America
- 5.7.5.1 By Country
- 5.7.5.1.1 Argentina
- 5.7.5.1.2 Brazil
- 5.7.5.1.3 Chile
- 5.7.5.1.4 Rest of South America
- 5.7.5.1 By Country
- 5.7.6 Rest of World
- 5.7.1 Asia-Pacific
6 Competitive Landscape
- 6.1 Market Concentration
- 6.2 Key Strategic Moves
- 6.3 Market Share Analysis
- 6.4 Company Profiles (Includes Global Level Overview, Market Level Overview, Core Segments, Financials as Available, Strategic Information, Market Rank/Share for Key Companies, Products and Services, and Recent Developments)
- 6.4.1 All Cargo Logistics
- 6.4.2 Aramex
- 6.4.3 Australia Post
- 6.4.4 Blue Dart Express, Ltd.
- 6.4.5 Cainiao Network Technology Co., Ltd.
- 6.4.6 Canada Post (including Purolator, Inc.)
- 6.4.7 CJ Logistics Corporation
- 6.4.8 Correios de Portugal S.A. (CTT)
- 6.4.9 DHL Express
- 6.4.10 DSV A/S
- 6.4.11 FedEx
- 6.4.12 International Distribution Services plc
- 6.4.13 Japan Post Holdings Co., Ltd.
- 6.4.14 JD Logistics, Inc.
- 6.4.15 Korea Post
- 6.4.16 La Poste Group (GeoPost / DPDgroup)
- 6.4.17 Osterreichische Post AG
- 6.4.18 Otto Group
- 6.4.19 Pos Indonesia
- 6.4.20 Poste Italiane
- 6.4.21 Posten Norge AS (Bring)
- 6.4.22 PostNL
- 6.4.23 Seino Holdings Co., Ltd.
- 6.4.24 SF Holdings (SF Express)
- 6.4.25 Singapore Post, Ltd.
- 6.4.26 TFI International, Inc.
- 6.4.27 United Parcel Service of America, Inc. (UPS)
- 6.4.28 Yamato Holdings Co., Ltd.
- 6.4.29 ZTO Express (Cayman) Inc.
7 Market Opportunities and Future Outlook
- 7.1 White-Space and Unmet-Need Assessment

 美國國際快遞小包裹宅配(CEP):市場佔有率分析、行業趨勢和統計數據以及成長預測(2026-2031 年)印度國內宅配和小包裹(CEP):市場佔有率分析、行業趨勢和統計數據以及成長預測(2026-2031 年)日本國內宅配、快捷郵件和小包裹:市場佔有率分析、行業趨勢和統計數據以及成長預測(2026-2031 年)
 小包裹遞送市場規模、佔有率和成長分析:按服務類型、遞送速度、小包裹重量、最終用戶、運輸方式和地區分類-2026-2033年產業預測
 全球宅配、包裹及小包裹市場-2026-2032年市場預測視訊串流平台:市場佔有率分析、產業趨勢與統計、成長預測(2026-2031)
 代出貨市場規模、佔有率和成長分析:按產品類型、經營模式、平台類型、供應商類型、公司規模、銷售管道、最終用戶和地區分類-2026-2033年產業預測
 快遞小包裹宅配(CEP) 市場規模、佔有率和成長分析:按服務類型、目的地、運輸方式、遞送速度、包裹重量和地區分類-2026-2033 年產業預測英國國內宅配( 小包裹):市場佔有率分析、產業趨勢與統計、成長預測(2026-2031)
 生鮮食品在地化配送市場:預測至 2034 年 -產品類型、配送模式、平台類型、訂單規模、支付方式、最終用戶和地區分類的全球分析