


 |
市場調查報告書
商品編碼
2121972
太陽能逆變器:市場佔有率分析、產業趨勢與統計及成長預測(2026-2031)Solar PV Inverters - Market Share Analysis, Industry Trends & Statistics, Growth Forecasts (2026 - 2031) |
||||||

※ 本網頁內容可能與最新版本有所差異。詳細情況請與我們聯繫。
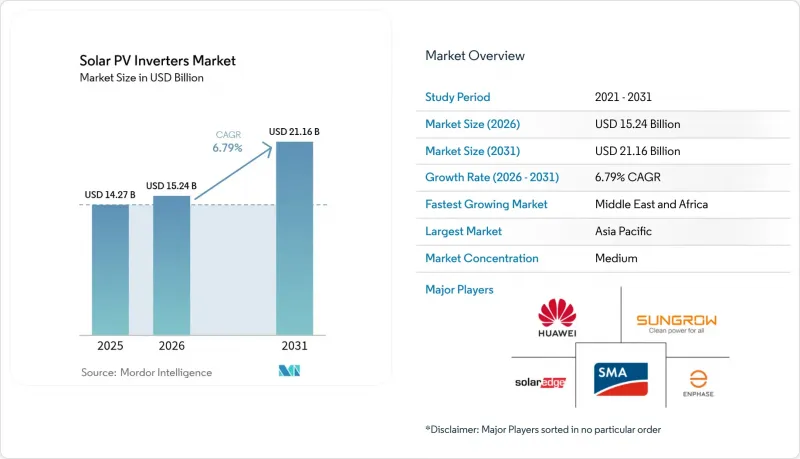
根據 Mordor Intelligence 預測,太陽能逆變器市場規模預計將從 2025 年的 142.7 億美元成長到 2026 年的 152.4 億美元,然後從 2026 年到 2031 年以 6.79% 的複合年成長率成長,到 2031 年達到 211.11.16 億美元。
本報告按逆變器類型(集中式逆變器、組串式逆變器、微型逆變器、混合/電池相容逆變器)、相數(單相和三相)、連接方式(併網和離網)、應用(住宅、商業/工業、公用事業規模)和地區(北美、歐洲、亞太地區、南美、中東和非洲)進行分類。
全球太陽能逆變器市場趨勢與洞察
公用事業規模專案中快速採用高壓 1500V串列型逆變器(美國、西班牙)
為了降低系統總成本並提高功率密度,電力開發商正擴大採用 1500V 甚至 2000V 直流架構作為規範。 GE Vernova 的 2000V 平台可實現 30% 的輸出功率提升,並降低平準化電成本 (LCOE)。這種電壓轉變使得 1000V 陣列在新建設項目中經濟效益下降,加速了維修項目的推進,尤其是在土地和電網容量允許的情況下,可以安裝大規模尺寸的組件。這推動了對半導體的需求成長,加劇了碳化矽 (SiC) 裝置的供應緊張,並進一步提升了各大品牌熱設計專業知識的策略重要性。
印度強製商業建築安裝屋頂太陽能發電系統,導致對 100 kW 以下逆變器的需求不斷成長。
印度政策強制要求新建和現有商業建築安裝屋頂太陽能板,從而持續推動對100千瓦以下逆變器的需求。 2024會計年度創紀錄的4吉瓦裝機量充分展現了該市場的規模。國內製造商正積極強化其本地價值鏈,受惠於印度政府到2026年建成110吉瓦電池和組件的進口替代目標。儘管部分邦的實施情況仍存在差異,但標準化的安裝方法正成為住宅領域更廣泛應用的典範。
高電流SiC/IGBT功率模組長期供不應求與價格波動
碳化矽晶圓供應緊張持續限制高效逆變器的供應,並推高了元件成本。 Wolfspeed的財務困境加劇了人們對相關風險的擔憂,而英飛凌轉向更具成本效益的200mm碳化矽晶圓則表明,供應緊張的局面在2026年後可能會有所緩解。與可依賴矽替代品的垂直整合型中國企業相比,依賴先進半導體實現併網能力的歐美製造商正面臨更嚴峻的利潤率壓縮。
細分市場分析
2025年,集中式逆變器仍維持54.30%的銷售領先優勢,但隨著組件級電子技術不再局限於早期採用者的小眾市場,微型逆變器預計將以7.96%的複合年成長率成長。 Enphase在2025年向國內市場出貨超過650萬台微型逆變器,符合美國當地的生產標準,並證實了該細分市場的商業性化規模。在太陽能逆變器市場,能夠將ASIC設計、無線資料通訊和散熱設計整合到緊湊型機殼中的公司正在獲得優勢。儘管由於發電限制,集中式架構在中國的需求趨於穩定,但它們仍然是公用事業項目的基礎,尤其是在那些優先考慮電廠級控制和競爭性資本投資的地區。
微電子產業的競爭日益激烈,進入門檻更源自於複雜的韌體和安全認證,而非硬體成本。因此,專注於低價策略的新參與企業難以跟上快速發展的功能,例如快速關閉和電池介面模式。儘管出貨量穩定成長,但預計微型逆變器在未來十年或更長時間內仍無法超越組串式平台,太陽能逆變器市場也將保持架構多樣性。
到2025年,公用事業發電廠將佔總出貨量的62.25%,這反映出一系列根據長期購電協議(PPA)承諾的大型專案正在籌備中。儘管如此,隨著電網服務和淨計費機制改善家庭經濟狀況,住宅太陽能系統預計將以每年7.45%的速度成長。印度的「總理陽光計畫」(Pradhan Mantri Surya Gal)旨在到2027年3月安裝30吉瓦的屋頂太陽能系統,而澳洲的安裝率也因電池儲能的普及而不斷上升。在印度,商業屋頂太陽能正受益於強制屋頂安裝政策,但在其他地區,由於融資環境謹慎,投資回收期較長,面臨挑戰。
產消者越來越重視雙向通訊功能和孤島運作時的可靠性,促使逆變器廠商將電池控制邏輯整合到逆變器中。因此,平均售價(ASP)上漲,抵消了太陽能發電系統裝機量放緩的影響,從而支撐了太陽能逆變器市場的整體銷售成長。同時,電力開發商正專注於1500V和2000V平台,並整合STATCOM等功能,以滿足日益嚴格的併網標準。
區域分析
預計到2025年,亞太地區將佔全球出貨量的54.40%,主要得益於中國垂直整合的供應鏈以及印度政策主導的屋頂光伏發電推廣。儘管中國新的市場定價體係可能會放緩新裝置量,但現有電站的維修,例如加裝儲能系統和高壓組串,仍能維持強勁的出貨量。預計到2026年,印度的製造能力將達到110吉瓦,這將加強國內採購體系,並保護當地太陽能逆變器市場免受進口價格波動的影響。然而,監管執行的區域差異限制了短期利潤的成長。
中東地區預計到2031年將維持9.31%的年複合成長率(CAGR),位居全球之首,這使得吉瓦級專案與經濟多元化藍圖相契合。嚴酷的沙漠環境推動了對即使在高溫條件下也能良好運作的設備設計的需求,為專注於封閉式配電櫃解決方案的歐洲原始設備製造商(OEM)開闢了新的利基市場。沙烏地阿拉伯和阿拉伯聯合大公國為加強電網建設而採取的措施提高了對低壓穿越和無功功率管理的要求,迫使供應商對產品進行認證,以滿足更嚴格的電力公司標準。北美和歐洲擁有成熟的裝置基礎,新增需求主要來自設備更換和維修週期。由於美國《通膨控制法案》提供的國內採購補貼,本地生產正在加速發展,德克薩斯州、南卡羅來納州和亞利桑那州的工廠目標是到 2026 年實現年產量大幅超過 30 吉瓦。在德國和西班牙等市場,隨著歐洲可再生能源採用率超過 50%,併網功能的價值有所提高,即使新建設數量趨於平穩,供應商也能夠將更高的平均售價 (ASP) 轉嫁給客戶。
其他好處:
- Excel格式的市場預測(ME)表
- 3個月的分析師支持
目錄
第1章:引言
- 研究假設和市場定義
- 調查範圍
第2章:調查方法
第3章執行摘要
第4章 市場狀況
- 市場概覽
- 市場促進因素
- 大型發電工程中快速採用高壓 1500V串列型逆變器(美國、西班牙)
- 印度強製商業建築安裝屋頂太陽能發電系統,推動了對 100 kW 級逆變器的需求成長。
- 對 2012 年至 2016 年日本上網電價補貼政策繁榮時期安裝的逆變器進行主動更換。
- 先進電網支援功能的整合正在推高歐洲的平均售價。
- 在澳大利亞,太陽能發電和儲能相結合的混合解決方案的擴展正在推動雙向逆變器的採用。
- 巴西的在地化獎勵正在促進中央逆變器的國內製造。
- 市場限制因素
- 大電流SiC和IGBT功率模組持續供不應求和價格波動。
- 中國西北地區日益嚴格的發電限制正在減緩集中式逆變器的訂單。
- 美國各地網路連線法規的不一致導致認證成本上升。
- 德國對屋頂直流電路的消防安全隱患阻礙了微型逆變器的普及。
- 供應鏈分析
- 監理展望
- 技術展望
- 波特五力模型
第5章 市場規模與成長預測
- 按逆變器類型分類
- 集中式逆變器
- 組串式逆變器
- 微型逆變器
- 混合/電池相容型逆變器
- 按階段
- 單相
- 三相
- 按連線類型
- 併網
- 離網
- 透過使用
- 住宅
- 商業和工業用途
- 公用事業規模
- 按地區
- 北美洲
- 美國
- 加拿大
- 墨西哥
- 歐洲
- 英國
- 德國
- 法國
- 西班牙
- 北歐國家
- 俄羅斯
- 其他歐洲國家
- 亞太地區
- 中國
- 印度
- 日本
- 韓國
- 馬來西亞
- 泰國
- 印尼
- 越南
- 澳洲
- 其他亞太國家
- 南美洲
- 巴西
- 阿根廷
- 哥倫比亞
- 其他南美國家
- 中東和非洲
- 阿拉伯聯合大公國
- 沙烏地阿拉伯
- 南非
- 埃及
- 其他中東和非洲國家
- 北美洲
第6章 競爭情勢
- 市場集中度
- 策略趨勢(併購、聯盟、購電協議)
- 市場佔有率分析(主要公司的市場排名和佔有率)
- 公司簡介
- Huawei Technologies Co., Ltd.
- Sungrow Power Supply Co., Ltd.
- SMA Solar Technology AG
- SolarEdge Technologies Inc.
- Enphase Energy Inc.
- FIMER SpA
- Delta Electronics, Inc.
- Growatt New Energy Technology Co., Ltd.
- Ginlong(Solis)Technologies
- TMEIC Corporation
- Mitsubishi Electric Corporation
- Schneider Electric SE
- Siemens AG
- Eaton Corporation plc
- Hitachi Energy Ltd.
- Omron Corporation
- Power Electronics Espana SL
- Chint Power Systems Co., Ltd.
- GoodWe Technologies Co., Ltd.
- GE Vernova
- Canadian Solar Inc.(CSI Solar)
- Toshiba Mitsubishi-Electric Industrial Systems Corp.(TMEIC)
- Kepco KPS(South Korea)
第7章 市場機會與未來展望
According to Mordor Intelligence, the solar PV inverters market size is expected to grow from USD 14.27 billion in 2025 to USD 15.24 billion in 2026 and is forecast to reach USD 21.16 billion by 2031 at 6.79% CAGR over 2026-2031.
This report is Segmented by Inverter Type (Central Inverters, String Inverters, Micro Inverters, and Hybrid/Battery-Ready Inverters), Phase (Single-Phase and Three-Phase), Connection Type (On-Grid and Off-Grid), Application (Residential, Commercial and Industrial, and Utility-Scale), and Geography (North America, Europe, Asia-Pacific, South America, and Middle East and Africa).
Global Solar PV Inverters Market Trends and Insights
Rapid adoption of high-voltage 1 500 V string inverters in utility-scale projects (US, Spain)
Utility developers increasingly specify 1,500 V-and pilot 2,000 V-DC architectures to lower balance-of-system costs and boost power density. GE Vernova's 2,000 V platform showcases a 30% output gain that decreases levelized energy costs. This voltage migration renders 1,000 V arrays economically obsolete on new-build sites and spurs retrofit projects, especially where land and grid headroom allow bigger block sizes. Heightened semiconductor demand follows, tightening the supply of SiC devices and elevating the strategic importance of thermal design expertise among leading brands.
Mandatory rooftop-solar mandates in India's commercial buildings boosting <=100 kW inverter demand
India's policy obliges new and existing commercial structures to install rooftop arrays, driving the sustained need for <=100 kW inverters. Record additions of 4 GW in fiscal 2024 signal the scale of the opportunity . Domestic manufacturers benefit from import-substitution targets embedded in the country's 110 GW cell-and-module build-out by 2026, reinforcing the local value chain. While implementation gaps remain across several states, standardized installation practices create a template for broader residential uptake.
Persistent shortages & price volatility of high-current SiC / IGBT power modules
SiC wafer supply tightness continues to constrain high-efficiency inverters and amplify bill-of-material costs. Wolfspeed's financial distress heightens risk perceptions, whereas Infineon's switch to cost-effective 200 mm SiC wafers signals relief from 2026 onward . European and North American producers, dependent on advanced semiconductors for grid-forming functionality, experience sharper margin compression than vertically integrated Chinese peers able to fall back on silicon alternatives.
Other drivers and restraints analyzed in the detailed report include:
- Aggressive replacement cycle of inverters installed during Japan's 2012-2016 FIT boom
- Integration of advanced grid-support functions lifting ASPs in Europe
- Rising curtailment in China's northwest dampening central-inverter orders
For complete list of drivers and restraints, kindly check the Table Of Contents.
Segment Analysis
Central units retained a 54.30% revenue lead in 2025, yet microinverters are forecast to grow at an 7.96% CAGR as module-level electronics move beyond the early-adopter niche. Enphase shipped more than 6.5 million domestic microinverters in 2025, satisfying US localization criteria and underlining the segment's commercial scale . The solar PV inverter market rewards firms that combine ASIC design, wireless data, and thermal engineering in a miniature footprint. Central architectures now confront flattish demand in China due to curtailment but remain anchored in utility projects elsewhere, especially where plant-level controls and competitive capex remain priorities.
Competitive intensity is pronounced in microelectronics; barriers arise from firmware sophistication and safety certifications rather than raw hardware cost. Consequently, low-price entrants struggle to keep pace with rapid feature rollouts such as rapid shutdown and battery interface modes. Despite robust volume growth, microinverters are not likely to eclipse string platforms before the next decade, keeping the solar PV inverter market diversified by architecture.
Utility plants captured 62.25% of 2025 shipments, reflecting large project pipelines locked under long-term PPAs. Even so, residential systems should expand by 7.45% annually as grid services and net-billing frameworks enhance household economics. India's Pradhan Mantri Surya Ghar program targets 30 GW of rooftop arrays by March 2027, while Australia's battery add-on trend lifts attachment rates. Commercial rooftops ride India's rooftop mandate wave but face cautious finance terms in other regions that stretch payback timelines.
Prosumers increasingly value bidirectional capability and island-mode resilience, prompting inverter OEMs to integrate battery control logic. The resulting ASP uplift compensates for slower macro installation growth, supporting aggregate revenue progression inside the solar PV inverter market. Utility developers, meanwhile, focus on 1,500 V and 2,000 V platforms, coupling them with STATCOM-like functionalities to meet stricter grid-code compliance.
Complete Report Scope:
- By Inverter Type
- Central Inverters
- String Inverters
- Microinverters
- Hybrid/Battery-Ready Inverters
- By Phase
- Single-Phase
- Three-Phase
- By Connection Type
- On-Grid
- Off-Grid
- By Application
- Residential
- Commercial and Industrial
- Utility-Scale
- By Geography
- North America
- United States
- Canada
- Mexico
- Europe
- United Kingdom
- Germany
- France
- Spain
- Nordic Countries
- Russia
- Rest of Europe
- Asia-Pacific
- China
- India
- Japan
- South Korea
- Malaysia
- Thailand
- Indonesia
- Vietnam
- Australia
- Rest of Asia-Pacific
- South America
- Brazil
- Argentina
- Colombia
- Rest of South America
- Middle East and Africa
- United Arab Emirates
- Saudi Arabia
- South Africa
- Egypt
- Rest of Middle East and Africa
- North America
Geography Analysis
Asia-Pacific generated 54.40% of 2025 shipments, underpinned by China's vertically integrated supply chain and India's policy-driven rooftop push. While China's new market-based tariff regime may slow greenfield installations, volume resilience stems from retrofits that embed storage and higher-voltage strings. India's manufacturing capacity, set to reach 110 GW by 2026, tightens domestic procurement loops and shields the local solar PV inverter market from import volatility, although regional disparities in regulatory execution temper immediate gains.
The Middle East, clocking the quickest 9.31% CAGR through 2031, aligns gigawatt-scale projects with economic diversification blueprints. Harsh desert conditions drive demand for high-derating-temperature designs, opening niches for European OEMs specializing in sealed cubicle solutions. Grid-reinforcement efforts in Saudi Arabia and the United Arab Emirates elevate low-voltage ride-through and reactive-power management specifications, pressing vendors to certify products against stricter utility benchmarks. North America and Europe operate in a mature install base where replacement and retrofit cycles dominate incremental demand. The US Inflation Reduction Act's domestic content credits accelerate localized production, with Texas, South Carolina, and Arizona facilities targeting annual output well above 30 GW by 2026. Europe's renewable penetration surpassing 50% in markets such as Germany and Spain raises the value of grid-forming features, allowing vendors to pass through higher ASPs even as new-build volumes plateau.
- Huawei Technologies Co., Ltd.
- Sungrow Power Supply Co., Ltd.
- SMA Solar Technology AG
- SolarEdge Technologies Inc.
- Enphase Energy Inc.
- FIMER SpA
- Delta Electronics, Inc.
- Growatt New Energy Technology Co., Ltd.
- Ginlong (Solis) Technologies
- TMEIC Corporation
- Mitsubishi Electric Corporation
- Schneider Electric SE
- Siemens AG
- Eaton Corporation plc
- Hitachi Energy Ltd.
- Omron Corporation
- Power Electronics Espana S.L.
- Chint Power Systems Co., Ltd.
- GoodWe Technologies Co., Ltd.
- GE Vernova
- Canadian Solar Inc. (CSI Solar)
- Toshiba Mitsubishi-Electric Industrial Systems Corp. (TMEIC)
- Kepco KPS (South Korea)
Additional Benefits:
- The market estimate (ME) sheet in Excel format
- 3 months of analyst support
TABLE OF CONTENTS
1 Introduction
- 1.1 Study Assumptions & Market Definition
- 1.2 Scope of the Study
2 Research Methodology
3 Executive Summary
4 Market Landscape
- 4.1 Market Overview
- 4.2 Market Drivers
- 4.2.1 Rapid adoption of high-voltage 1 500 V string inverters in utility-scale projects (US, Spain)
- 4.2.2 Mandatory rooftop-solar mandates in India's commercial buildings boosting ?100 kW inverter demand
- 4.2.3 Aggressive replacement cycle of inverters installed during Japan's 2012-2016 FIT boom
- 4.2.4 Integration of advanced grid-support functions lifting ASPs in Europe
- 4.2.5 Growth of hybrid PV-storage solutions driving bidirectional inverters in Australia
- 4.2.6 Localization incentives in Brazil encouraging domestic manufacture of central inverters
- 4.3 Market Restraints
- 4.3.1 Persistent shortages & price volatility of high-current SiC / IGBT power modules
- 4.3.2 Rising curtailment in China's northwest dampening central-inverter orders
- 4.3.3 Fragmented US interconnection codes inflating certification costs
- 4.3.4 Fire-safety concerns on rooftop DC circuits slowing microinverter uptake in Germany
- 4.4 Supply-Chain Analysis
- 4.5 Regulatory Outlook
- 4.6 Technological Outlook
- 4.7 Porter's Five Forces
- 4.7.1 Bargaining Power of Suppliers
- 4.7.2 Bargaining Power of Consumers
- 4.7.3 Threat of New Entrants
- 4.7.4 Threat of Substitutes
- 4.7.5 Intensity of Competitive Rivalry
5 Market Size & Growth Forecasts
- 5.1 By Inverter Type
- 5.1.1 Central Inverters
- 5.1.2 String Inverters
- 5.1.3 Microinverters
- 5.1.4 Hybrid/Battery-Ready Inverters
- 5.2 By Phase
- 5.2.1 Single-Phase
- 5.2.2 Three-Phase
- 5.3 By Connection Type
- 5.3.1 On-Grid
- 5.3.2 Off-Grid
- 5.4 By Application
- 5.4.1 Residential
- 5.4.2 Commercial and Industrial
- 5.4.3 Utility-Scale
- 5.5 By Geography
- 5.5.1 North America
- 5.5.1.1 United States
- 5.5.1.2 Canada
- 5.5.1.3 Mexico
- 5.5.2 Europe
- 5.5.2.1 United Kingdom
- 5.5.2.2 Germany
- 5.5.2.3 France
- 5.5.2.4 Spain
- 5.5.2.5 Nordic Countries
- 5.5.2.6 Russia
- 5.5.2.7 Rest of Europe
- 5.5.3 Asia-Pacific
- 5.5.3.1 China
- 5.5.3.2 India
- 5.5.3.3 Japan
- 5.5.3.4 South Korea
- 5.5.3.5 Malaysia
- 5.5.3.6 Thailand
- 5.5.3.7 Indonesia
- 5.5.3.8 Vietnam
- 5.5.3.9 Australia
- 5.5.3.10 Rest of Asia-Pacific
- 5.5.4 South America
- 5.5.4.1 Brazil
- 5.5.4.2 Argentina
- 5.5.4.3 Colombia
- 5.5.4.4 Rest of South America
- 5.5.5 Middle East and Africa
- 5.5.5.1 United Arab Emirates
- 5.5.5.2 Saudi Arabia
- 5.5.5.3 South Africa
- 5.5.5.4 Egypt
- 5.5.5.5 Rest of Middle East and Africa
- 5.5.1 North America
6 Competitive Landscape
- 6.1 Market Concentration
- 6.2 Strategic Moves (M&A, Partnerships, PPAs)
- 6.3 Market Share Analysis (Market Rank/Share for key companies)
- 6.4 Company Profiles (includes Global level Overview, Market level overview, Core Segments, Financials as available, Strategic Information, Products & Services, and Recent Developments)
- 6.4.1 Huawei Technologies Co., Ltd.
- 6.4.2 Sungrow Power Supply Co., Ltd.
- 6.4.3 SMA Solar Technology AG
- 6.4.4 SolarEdge Technologies Inc.
- 6.4.5 Enphase Energy Inc.
- 6.4.6 FIMER SpA
- 6.4.7 Delta Electronics, Inc.
- 6.4.8 Growatt New Energy Technology Co., Ltd.
- 6.4.9 Ginlong (Solis) Technologies
- 6.4.10 TMEIC Corporation
- 6.4.11 Mitsubishi Electric Corporation
- 6.4.12 Schneider Electric SE
- 6.4.13 Siemens AG
- 6.4.14 Eaton Corporation plc
- 6.4.15 Hitachi Energy Ltd.
- 6.4.16 Omron Corporation
- 6.4.17 Power Electronics Espana S.L.
- 6.4.18 Chint Power Systems Co., Ltd.
- 6.4.19 GoodWe Technologies Co., Ltd.
- 6.4.20 GE Vernova
- 6.4.21 Canadian Solar Inc. (CSI Solar)
- 6.4.22 Toshiba Mitsubishi-Electric Industrial Systems Corp. (TMEIC)
- 6.4.23 Kepco KPS (South Korea)
7 Market Opportunities & Future Outlook
- 7.1 White-Space & Unmet-Need Assessment

 2026-2034年全球太陽能發電微型逆變器市場規模、佔有率、趨勢和成長分析報告
 印度太陽能逆變器用電池:市場佔有率分析、行業趨勢和統計數據以及成長預測(2026-2031 年)太陽能逆變器用電池:市場佔有率分析、行業趨勢和統計數據以及成長預測(2026-2031 年)中東和非洲太陽能光電逆變器:市場佔有率分析、行業趨勢和統計數據以及成長預測(2026-2031 年)印度太陽能逆變器:市場佔有率分析、產業趨勢與統計及成長預測(2026-2031)歐洲太陽能逆變器:市場佔有率分析、產業趨勢與統計及成長預測(2026-2031 年)
 太陽能逆變器市場規模及預測(2021-2034),全球及區域佔有率、趨勢和成長機會分析報告:按產品類型、相數、連接方式、最終用戶、容量和地區分類太陽能逆變器市場規模、佔有率、成長、全球產業分析、區域趨勢及2026年至2034年預測。
 智慧逆變器市場預測至2034年-按逆變器類型、相數、電壓等級、通訊技術、最終用戶和地區分類的全球分析
 太陽能逆變器市場-2026-2032年全球市場預測