


 |
市場調查報告書
商品編碼
2119351
太陽能逆變器用電池:市場佔有率分析、行業趨勢和統計數據以及成長預測(2026-2031 年)Solar Inverter Battery - Market Share Analysis, Industry Trends & Statistics, Growth Forecasts (2026 - 2031) |
||||||

※ 本網頁內容可能與最新版本有所差異。詳細情況請與我們聯繫。
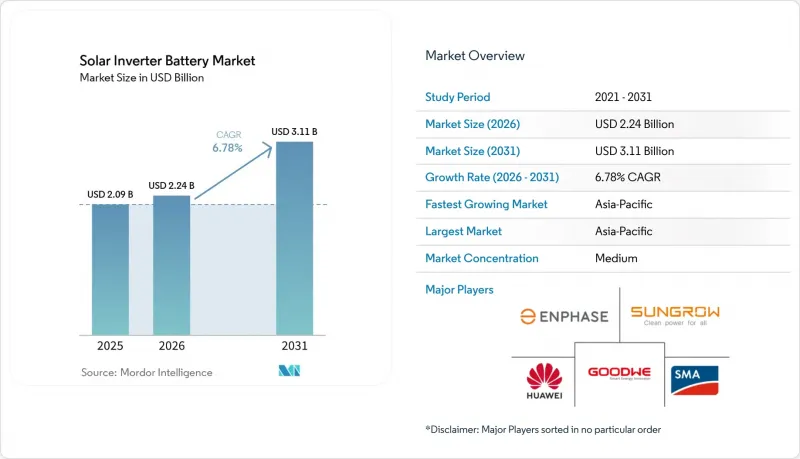
根據 Mordor Intelligence 預測,太陽能逆變器用電池的市場規模預計將從 2025 年的 20.9 億美元和 2026 年的 22.4 億美元成長到 2031 年的 31.1 億美元,2026 年至 2031 年的年複合成長率(CAGR)為 6.78%。
本報告按電池化學成分(鋰離子電池、鉛酸電池、鈉離子電池、液流電池及其他)、電池容量(小於5千瓦時、5-10千瓦時、10-20千瓦時、20千瓦時及以上)、最終用戶(住宅、商業、工業、公用事業規模)和地區(北美、歐洲、亞太、南美、中東和非洲)進行細分。市場預測以美元計價。
全球太陽能逆變器用電池市場趨勢及洞察。
由於太陽能發電和儲能技術的結合使用,其普及率正在提高。
隨著儲能系統成為新建太陽能發電工程的標配,太陽能逆變器電池市場也從中受益。預計到2026年第一季,美國住宅太陽能儲能系統的普及率將達到45%,高於2025年第一季的38%。這項轉變反映了淨計量政策的重新評估,以及消費者對儲存更多太陽能發電以供日後使用的興趣日益濃厚。根據美國太陽能產業協會(SEIA)預測,2025年美國新增儲能容量為58吉瓦時(GWh)。組合式系統要求供應商協調逆變器控制、電池管理和安裝設計。因此,能夠提供完整系統而非單一硬體組件的公司更具優勢。
鋰離子電池系統成本的下降正在推動其廣泛應用。
太陽能逆變器電池市場正受益於磷酸鋰鐵(LFP)電池成本的下降。預計到2025年,LFP電池價格將約為每千瓦時50美元,這將使住宅系統即使在歐洲和澳洲等電費較高的市場也能保持競爭力。儘管314安時儲能電池的價格在2026年上半年有所上漲,但太陽能逆變器電池市場商業項目的經濟可行性依然穩固。 2026年6月,陽光電源發表了「PowerHarbor」產品,該產品採用314安時棱柱形電池,並具備模組級直流-直流轉換功能。該設計旨在降低系統總成本並簡化容量擴展。然而,認證成本仍然阻礙著受國家電網和安全法規約束的小規模安裝商降低成本。
高昂的初始成本阻礙了新興地區的廣泛應用。
在消費信貸和安裝能力有限的地區,進入太陽能逆變器電池市場仍然充滿挑戰。儘管電池價格有所下降,但設備、安裝和資金籌措的總成本仍然很高。截至2026年1月,巴西已安裝了超過500兆瓦時的後表儲能系統,預計2026年還將新增650兆瓦時或更多。巴西電力監管機構正在審查2026年的“第39號公共諮詢文件”,該文件可能會明確儲能系統的經營模式。雖然一體化設備可以縮短太陽能逆變器電池市場的試運行週期,但在安裝網路有限的市場中,它們無法完全抵消人事費用。這些限制也會影響購買大容量系統的企業客戶。
細分市場分析
到2025年,鋰離子電池將佔據太陽能逆變器電池市場72.1%的佔有率。其中大部分佔有率將由磷酸鐵鋰電池(LFP)產品佔據,這得益於其成熟的供應鏈以及在住宅儲能領域久經考驗的性能。其工作範圍、單體電池級安全特性以及與標準電池管理系統的兼容性,將推動其在認證系統中的應用。鉛酸電池將繼續在對成本敏感的應用領域發揮作用。液流電池將繼續用於規模有限、週期較長的商業和工業項目,但由於安裝複雜性和資金投入的限制,其普及應用受到阻礙。
預計2026年至2031年間,鈉離子電池的複合年成長率將達到9.1%。寧德時代(CATL)表示,其鈉離子電池的系統效率高達97%,且在容量降至80%的情況永續超過15,000次。由於該公司的電池設計不使用鈷、鎳或銅,因此即使產量增加,也能保持成本競爭力。 2026年7月,Alfen與寧德時代達成協議,將在歐洲部署5GWh的鈉離子儲能系統。該協議表明,電池產業對這種化學成分(用於太陽能逆變器)的興趣正從試點階段走向規模化應用。
區域分析
預計到2025年,亞太地區將佔據太陽能逆變器電池市場46.4%的佔有率,並在2031年之前以8.5%的複合年成長率成長。中國仍然是該地區最大的設備生產基地,也是儲能系統部署的主要樞紐。各國政府的規劃支持更廣泛地使用電池來穩定電網並與可再生能源發電相結合。在印度,由於分散式太陽能發電的擴張,需求正在成長。雖然預計日本、韓國和澳洲的住宅需求強勁,但越南、印尼和泰國等小規模系統的需求正在萌芽,這些系統的電力可靠性至關重要。
北美仍然是太陽能逆變器電池市場的關鍵區域,因為美國公用事業規模的安裝量與不斷成長的住宅安裝率相結合。根據美國太陽能產業協會(SEIA)的報告,預計2025年,美國新增儲能容量將達到58吉瓦時(GWh)。加州、德克薩斯州和亞利桑那州佔了公用事業規模安裝量的大部分。馬薩諸塞州、德克薩斯州、新澤西州和大西洋中部地區的虛擬電廠(VPP)專案正在為客戶創造新的收入來源。雖然加拿大和墨西哥仍處於市場發展初期,但有關清潔電力和分散式發電計畫的法規正在支持未來的需求。
2025年,歐盟27國將新增36吉瓦時(GWh)的儲能容量,使累積容量超過100吉瓦時。德國、英國和義大利是最大的國內市場。德國2026年裝置容量的成長反映了動態電價機制和成熟的住宅太陽能發電基礎的影響。南美、中東和非洲仍處於起步階段,但需求推動要素顯而易見。在巴西,分散式太陽能發電、電網不可靠以及分時電價機制的結合帶來了機會。同時,沙烏地阿拉伯和阿拉伯聯合大公國對公用事業規模電池儲能的投資正引起關注。
其他好處:
- Excel格式的市場預測(ME)表
- 3個月的分析師支持
目錄
第1章:引言
- 研究假設和市場定義
- 調查範圍
第2章:調查方法
第3章執行摘要
第4章 市場狀況
- 市場概覽
- 市場促進因素
- 太陽能發電與儲能系統簡介
- 鋰離子系統成本更低
- 電網可靠性和能源獨立性
- 可再生能源激勵措施和強制性儲能
- 網路安全和銀行貸款合格要求正在提升合格供應商的地位。
- 透過軟體主導的虛擬電廠(VPP)實現獲利
- 市場限制因素
- 系統和安裝的初始成本較高。
- 電網連接、授權和安全標準遵守方面的延誤。
- 混合系統的互通性與保障風險
- 貿易壁壘、在地採購規則、技術工人短缺。
- 供應鏈分析
- 波特五力分析
- 科技趨勢
- 監理情勢
- 投資分析
第5章 市場規模與成長預測
- 電池化學成分
- 鋰離子電池
- 鉛酸電池
- 鈉離子電池
- 液流電池
- 其他電池化學成分
- 按電池容量
- 小於 5 千瓦時
- 5~10 kWh
- 10~20 kWh
- 20度或以上
- 最終用戶
- 住宅
- 商業
- 產業
- 公用事業規模
- 按地區
- 北美洲
- 美國
- 加拿大
- 墨西哥
- 歐洲
- 德國
- 法國
- 義大利
- 西班牙
- 英國
- 波蘭
- 俄羅斯
- 其他歐洲國家
- 亞太地區
- 中國
- 印度
- 日本
- 韓國
- 澳洲
- 印尼
- 越南
- 泰國
- 其他亞太國家
- 南美洲
- 巴西
- 阿根廷
- 智利
- 其他南美國家
- 中東和非洲
- 沙烏地阿拉伯
- 阿拉伯聯合大公國
- 埃及
- 南非
- 摩洛哥
- 其他中東和非洲國家
- 北美洲
第6章 競爭情勢
- 市場集中度
- 策略趨勢
- 市佔率分析
- 公司簡介
- BYD Company Limited
- Contemporary Amperex Technology Co., Limited(CATL)
- Dyness Digital Energy Technology Co., Ltd.
- Enphase Energy, Inc.
- Fluence Energy, Inc.
- Fronius International GmbH
- Ginlong Technologies Co., Ltd.(Solis)
- GoodWe Technologies Co., Ltd.
- Growatt New Energy Technology Co., Ltd.
- Huawei Digital Power Technologies Co., Ltd.
- LG Energy Solution Ltd.
- Panasonic Holdings Corporation
- Pylon Technologies Co., Ltd.
- Samsung SDI Co., Ltd.
- Schneider Electric SE
- SMA Solar Technology AG
- SolarEdge Technologies, Inc.
- Sungrow Power Supply Co., Ltd.
- Tesla, Inc.
第7章 市場機會與未來展望
According to Mordor Intelligence, the solar inverter battery market size is projected to expand from USD 2.09 billion in 2025 and USD 2.24 billion in 2026 to USD 3.11 billion by 2031, at a CAGR of 6.78% between 2026 and 2031.
This report is Segmented by Battery Chemistry (Lithium-Ion, Lead-Acid, Sodium-Ion, Flow Batteries, Others), Battery Capacity (Below 5 KWh, 5-10 KWh, 10-20 KWh, Above 20 KWh), End User (Residential, Commercial, Industrial, Utility-Scale), and Geography (North America, Europe, Asia-Pacific, South America, Middle East and Africa). The Market Forecasts are Provided in Terms of Value (USD).
Global Solar Inverter Battery Market Trends and Insights
Solar-Plus-Storage Deployment Lifts Attachment Rates
The solar inverter battery market benefits as storage becomes a standard part of new solar projects. The U.S. residential solar storage attachment rate reached 45% in the first quarter of 2026, compared with 38% in the first quarter of 2025. This change reflected revised net-metering arrangements as well as customer interest in retaining more solar generation for later use in the solar inverter battery market. SEIA reported that the United States added 58 GWh of energy storage capacity in 2025. Paired systems require suppliers to coordinate inverter controls, battery management, and site design. This favors firms that can offer a complete system rather than a separate hardware component.
Falling Lithium-Ion System Costs Support Wider Adoption
The solar inverter battery market has gained from lower lithium iron phosphate, or LFP, cell costs. LFP cell prices were near USD 50/kWh in 2025, helping residential systems compete in high-tariff European and Australian settings. A rise in 314 Ah storage-cell prices during the first half of 2026 did not remove the economic case for commercial projects in the solar inverter battery market. Sungrow introduced PowerHarbor in June 2026 with 314 Ah prismatic cells and module-level DC-DC conversion. The design aims to reduce balance-of-system costs and simplify capacity additions. Certification expenses still limit savings for smaller installers operating under the national grid and safety rules.
High Upfront Costs Limit Access in Emerging Geographies
The solar inverter battery market remains less accessible, where consumer financing and installer capacity are limited. Lower cell prices have not eliminated total equipment, installation, and financing costs. Brazil had more than 500 MWh of behind-the-meter storage installed by January 2026, while the country was expected to add more than 650 MWh during 2026. Brazil's electricity regulator was reviewing Consulta Publica 39 in 2026, which could clarify storage business models. All-in-one equipment can shorten commissioning time in the solar inverter battery market, but this does not fully offset labor costs in markets with limited installer networks. These limits also constrain purchases of larger capacity systems by commercial customers.
Other drivers and restraints analyzed in the detailed report include:
- Grid Reliability and Energy Independence Strengthen Demand
- Renewable-Energy Incentives and Storage Mandates Improve Project Visibility
- Interconnection and Compliance Timelines Slow Deployment
For complete list of drivers and restraints, kindly check the Table Of Contents.
Segment Analysis
Lithium-ion batteries held 72.1% of the solar inverter battery market share in 2025. LFP products formed the main part of this position because they have established supply chains and known performance in residential storage. Their operating range, cell-level safety characteristics, and compatibility with standard battery management systems support use in certified systems. Lead-acid batteries retained a role in cost-sensitive applications. Flow batteries continued to serve a limited set of long-duration commercial and industrial projects, where installation complexity and capital needs constrain wider use.
Sodium-ion batteries are forecast to grow at a 9.1% CAGR from 2026 to 2031. CATL stated that its sodium-ion cells can reach 97% system efficiency and more than 15,000 cycles to 80% capacity. The company's cell design does not use cobalt, nickel, or copper, which supports its cost position at larger production volumes. Alfen and CATL agreed in July 2026 to deploy 5 GWh of sodium-ion storage across Europe. The agreement shows that the solar inverter battery industry is moving beyond pilot-scale interest in this chemistry.
Complete Report Scope:
- By Battery Chemistry
- Lithium-ion Batteries
- Lead-acid Batteries
- Sodium-ion Batteries
- Flow Batteries
- Other Battery Chemistries
- By Battery Capacity
- Below 5 kWh
- 5-10 kWh
- 10-20 kWh
- Above 20 kWh
- By End User
- Residential
- Commercial
- Industrial
- Utility-scale
- By Geography
- North America
- United States
- Canada
- Mexico
- Europe
- Germany
- France
- Italy
- Spain
- United Kingdom
- Poland
- Russia
- Rest of Europe
- Asia-Pacific
- China
- India
- Japan
- South Korea
- Australia
- Indonesia
- Vietnam
- Thailand
- Rest of Asia-Pacific
- South America
- Brazil
- Argentina
- Chile
- Rest of South America
- Middle East and Africa
- Saudi Arabia
- United Arab Emirates
- Egypt
- South Africa
- Morocco
- Rest of Middle East and Africa
- North America
Geography Analysis
Asia-Pacific held 46.4% of the solar inverter battery market share in 2025 and is forecast to grow at an 8.5% CAGR through 2031. China remains the region's largest source of equipment production and a major storage deployment center. National planning supports grid-forming storage and broader use of batteries with renewable generation. India adds demand through distributed solar expansion. Japan, South Korea, and Australia support steady household demand, while Vietnam, Indonesia, and Thailand offer early demand for smaller systems where power reliability matters.
North America remains important to the solar inverter battery market because the United States combines utility-scale deployment with a growing household attachment rate. SEIA reported 58 GWh of new U.S. energy storage capacity in 2025. California, Texas, and Arizona account for a large share of utility-scale activity. Virtual power plant programs in Massachusetts, Texas, New Jersey, and the Mid-Atlantic create an additional route to customer revenue. Canada and Mexico remain earlier-stage markets, but clean electricity rules and distributed generation plans support future demand.
Europe added 36 GWh of storage in the EU-27 during 2025, taking cumulative capacity above 100 GWh. Germany, the United Kingdom, and Italy were the largest national markets. Germany's 2026 installation growth reflects the effect of dynamic tariffs and an established household solar base. South America, the Middle East, and Africa remain earlier-stage regions with clear demand drivers. Brazil combines distributed solar, unreliable grids, and time-of-use tariff opportunities, while Saudi Arabia and the United Arab Emirates draw utility-scale battery investment.
- BYD Company Limited
- Contemporary Amperex Technology Co., Limited (CATL)
- Dyness Digital Energy Technology Co., Ltd.
- Enphase Energy, Inc.
- Fluence Energy, Inc.
- Fronius International GmbH
- Ginlong Technologies Co., Ltd. (Solis)
- GoodWe Technologies Co., Ltd.
- Growatt New Energy Technology Co., Ltd.
- Huawei Digital Power Technologies Co., Ltd.
- LG Energy Solution Ltd.
- Panasonic Holdings Corporation
- Pylon Technologies Co., Ltd.
- Samsung SDI Co., Ltd.
- Schneider Electric SE
- SMA Solar Technology AG
- SolarEdge Technologies, Inc.
- Sungrow Power Supply Co., Ltd.
- Tesla, Inc.
Additional Benefits:
- The market estimate (ME) sheet in Excel format
- 3 months of analyst support
TABLE OF CONTENTS
1 INTRODUCTION
- 1.1 Study Assumptions and Market Definition
- 1.2 Scope of the Study
2 RESEARCH METHODOLOGY
3 EXECUTIVE SUMMARY
4 MARKET LANDSCAPE
- 4.1 Market Overview
- 4.2 Market Drivers
- 4.2.1 Solar-Plus-Storage Deployment
- 4.2.2 Falling Lithium-Ion System Costs
- 4.2.3 Grid Reliability and Energy Independence
- 4.2.4 Renewable-Energy Incentives and Storage Mandates
- 4.2.5 Cybersecurity and Bankability Requirements Elevating Qualified Suppliers
- 4.2.6 Software-Led Virtual Power Plant Monetization
- 4.3 Market Restraints
- 4.3.1 High Upfront System and Installation Cost
- 4.3.2 Interconnection, Permitting, and Safety-Compliance Delays
- 4.3.3 Hybrid-System Interoperability and Warranty Risk
- 4.3.4 Trade Barriers, Local-Content Rules, and Skilled-Labor Shortages
- 4.4 Supply-Chain Analysis
- 4.5 Porter's Five Forces Analysis
- 4.5.1 Bargaining Power of Suppliers
- 4.5.2 Bargaining Power of Buyers
- 4.5.3 Threat of New Entrants
- 4.5.4 Threat of Substitutes
- 4.5.5 Competitive Rivalry
- 4.6 Technology Outlook
- 4.7 Regulatory Landscape
- 4.8 Investment Analysis
5 MARKET SIZE AND GROWTH FORECASTS
- 5.1 By Battery Chemistry
- 5.1.1 Lithium-ion Batteries
- 5.1.2 Lead-acid Batteries
- 5.1.3 Sodium-ion Batteries
- 5.1.4 Flow Batteries
- 5.1.5 Other Battery Chemistries
- 5.2 By Battery Capacity
- 5.2.1 Below 5 kWh
- 5.2.2 5-10 kWh
- 5.2.3 10-20 kWh
- 5.2.4 Above 20 kWh
- 5.3 By End User
- 5.3.1 Residential
- 5.3.2 Commercial
- 5.3.3 Industrial
- 5.3.4 Utility-scale
- 5.4 By Geography
- 5.4.1 North America
- 5.4.1.1 United States
- 5.4.1.2 Canada
- 5.4.1.3 Mexico
- 5.4.2 Europe
- 5.4.2.1 Germany
- 5.4.2.2 France
- 5.4.2.3 Italy
- 5.4.2.4 Spain
- 5.4.2.5 United Kingdom
- 5.4.2.6 Poland
- 5.4.2.7 Russia
- 5.4.2.8 Rest of Europe
- 5.4.3 Asia-Pacific
- 5.4.3.1 China
- 5.4.3.2 India
- 5.4.3.3 Japan
- 5.4.3.4 South Korea
- 5.4.3.5 Australia
- 5.4.3.6 Indonesia
- 5.4.3.7 Vietnam
- 5.4.3.8 Thailand
- 5.4.3.9 Rest of Asia-Pacific
- 5.4.4 South America
- 5.4.4.1 Brazil
- 5.4.4.2 Argentina
- 5.4.4.3 Chile
- 5.4.4.4 Rest of South America
- 5.4.5 Middle East and Africa
- 5.4.5.1 Saudi Arabia
- 5.4.5.2 United Arab Emirates
- 5.4.5.3 Egypt
- 5.4.5.4 South Africa
- 5.4.5.5 Morocco
- 5.4.5.6 Rest of Middle East and Africa
- 5.4.1 North America
6 COMPETITIVE LANDSCAPE
- 6.1 Market Concentration
- 6.2 Strategic Moves
- 6.3 Market Share Analysis
- 6.4 Company Profiles (includes Global Level Overview, Market Level Overview, Core Segments, Financials as available, Strategic Information, Market Rank/Share, Products and Services, Recent Developments)
- 6.4.1 BYD Company Limited
- 6.4.2 Contemporary Amperex Technology Co., Limited (CATL)
- 6.4.3 Dyness Digital Energy Technology Co., Ltd.
- 6.4.4 Enphase Energy, Inc.
- 6.4.5 Fluence Energy, Inc.
- 6.4.6 Fronius International GmbH
- 6.4.7 Ginlong Technologies Co., Ltd. (Solis)
- 6.4.8 GoodWe Technologies Co., Ltd.
- 6.4.9 Growatt New Energy Technology Co., Ltd.
- 6.4.10 Huawei Digital Power Technologies Co., Ltd.
- 6.4.11 LG Energy Solution Ltd.
- 6.4.12 Panasonic Holdings Corporation
- 6.4.13 Pylon Technologies Co., Ltd.
- 6.4.14 Samsung SDI Co., Ltd.
- 6.4.15 Schneider Electric SE
- 6.4.16 SMA Solar Technology AG
- 6.4.17 SolarEdge Technologies, Inc.
- 6.4.18 Sungrow Power Supply Co., Ltd.
- 6.4.19 Tesla, Inc.
7 MARKET OPPORTUNITIES AND FUTURE OUTLOOK
- 7.1 White-Space and Unmet-Need Assessment

 2026-2034年全球太陽能發電微型逆變器市場規模、佔有率、趨勢和成長分析報告
 印度太陽能逆變器用電池:市場佔有率分析、行業趨勢和統計數據以及成長預測(2026-2031 年)中東和非洲太陽能光電逆變器:市場佔有率分析、行業趨勢和統計數據以及成長預測(2026-2031 年)印度太陽能逆變器:市場佔有率分析、產業趨勢與統計及成長預測(2026-2031)歐洲太陽能逆變器:市場佔有率分析、產業趨勢與統計及成長預測(2026-2031 年)
 太陽能逆變器市場規模及預測(2021-2034),全球及區域佔有率、趨勢和成長機會分析報告:按產品類型、相數、連接方式、最終用戶、容量和地區分類太陽能逆變器市場規模、佔有率、成長、全球產業分析、區域趨勢及2026年至2034年預測。
 智慧逆變器市場預測至2034年-按逆變器類型、相數、電壓等級、通訊技術、最終用戶和地區分類的全球分析
 太陽能逆變器市場-2026-2032年全球市場預測太陽能逆變器:市場佔有率分析、產業趨勢與統計及成長預測(2026-2031)