


 |
市場調查報告書
商品編碼
2120582
美國風力發電:市場佔有率分析、產業趨勢與統計及成長預測(2026-2031)United States Wind Energy - Market Share Analysis, Industry Trends & Statistics, Growth Forecasts (2026 - 2031) |
||||||

※ 本網頁內容可能與最新版本有所差異。詳細情況請與我們聯繫。
據 Mordor Intelligence 稱,2025 年美國風力發電市場規模為 161.20 吉瓦,預計到 2031 年將達到 205.93 吉瓦,而 2026 年為 167.92 吉瓦,預測期(2026-2031 年)的複合年成長率為 4.17%。
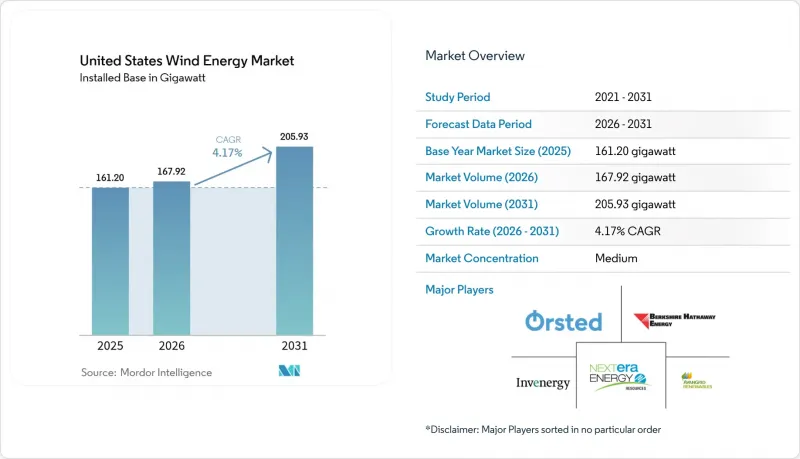
本報告按位置(陸上和海上)、渦輪機功率(小於3兆瓦、3-6兆瓦和大於6兆瓦)和應用(公用事業規模、商業/工業和社區項目)進行細分。市場規模和預測以裝置容量(吉瓦)表示。
美國風力發電市場趨勢與洞察
IRA稅額扣抵和PTC延期
除了將IRA的生產稅額扣抵延長10年至2032年之外,10個百分點的國產化率獎勵政策也使稅後項目回報率從6.5%提高到8.2%。該法案通過後,2024年宣布新增18吉瓦發電容量,並將其納入開發平臺。該法案規定,到2025年,40%的鋼鐵和55%的零件必須來自國內,這將提振愛荷華州和科羅拉多工廠的訂單。 2024年底,美國國稅局(IRS)的審計發現存在可追溯性缺陷,其中1.2吉瓦的項目因使用外國製造的軸承而被排除在外。鑑於長期購電協議(PPA)因基差風險波動而難以達成,ERCOT地區的開發商目前選擇利用IRA提供的30%投資稅額扣抵抵免來加速價值變現。
由於渦輪機高度增加,平準化能源成本降低
根據美國國家可再生能源實驗室(NREL)的數據,轉子直徑170公尺、輪轂高度110公尺的風力發電機組已將陸域風電的平準化度電成本(LCOE)在2024年降至每兆瓦時26美元。通用電氣Vernova和維斯塔斯(Vestas)的6兆瓦以上風力發電機組在阿肯色州和田納西州的4級風電場址實現了52%的裝機容量利用率,而這些地區此前風電開發並不盈利。熱塑性複合複合材料可減輕12%的重量,使每颱風力發電機的系統平衡(BOS)成本降低8萬美元。成本的降低將迫使8吉瓦燃氣發電廠在2024年前提前退役,這標誌著美國風電市場的關鍵轉折點。
電力傳輸和電網連接瓶頸
截至2024年12月,區域輸電待建容量達2,600吉瓦,其中風電佔950吉瓦,平均審核週期為5.2年。光是MISO就有180吉瓦的待建容量,需要480億美元的電網升級改造。其中60%需要新建345千伏輸電線路,而取得相關許可證需要七年時間。儘管FERC 2023號指令正朝著「先到先得」的原則發展,但截至2024年中期,只有CAISO全面實施了該原則,這意味著大多數開發人員仍然面臨順序核准。去年,由於60億美元的輸電成本分攤問題引發爭議,導致五個項目被暫停。
細分市場分析
到2025年,陸域風電資產將佔累積發電量的99.88%,反映了德克薩斯州和大平原地區數十年來穩步擴張的成果。在這些地區,5-7級風力資源的使用率已達到45-50%。然而,自2022年以來,海洋能源管理局(BOEM)已對八個租賃區域進行拍賣,為離岸風力發電風電裝置容量以47.69%的複合年成長率成長奠定了基礎,並重塑了美國風電市場格局。 Vineyard Wind 1計畫於2024年5月投入商業運營,其13兆瓦的風力渦輪機維持了60%的利用率,展現了離岸風力發電的競爭力。德克薩斯州和奧克拉荷馬州的陸上風電建設仍在繼續,預計到2024年,兩州的總裝置容量將新增5吉瓦。這得益於ERCOT的商業模式,該模式仍然允許專案在18個月內獲得批准。
儘管《瓊斯法案》的限制使得離岸風力發電建設規模在2026年之前每年約為2吉瓦,但目前在建工程總量總合30吉瓦。 Dominion Energy公司位於維吉尼亞海岸的2.6吉瓦項目獲得了美國建造的第一艘安裝船,但由於每日租金超過50萬美元,其資本投資比歐洲類似項目高出12%。舊陸上電廠的改造升級也是推動離岸風電同步成長的重要因素。 NextEra公司在愛荷華州的1.8吉瓦計畫在無需重新申請併網的情況下,使電廠發電量翻了三倍。浮體式海上風電計畫仍處於商業化前的測試階段。這是因為目前錨碇系統的成本為每兆瓦100萬美元,而且這項障礙在2028年之前不太可能消除。
其他好處:
- Excel格式的市場預測(ME)表
- 3個月的分析師支持
目錄
第1章:引言
- 研究假設和市場定義
- 調查範圍
第2章:調查方法
第3章執行摘要
第4章 市場狀況
- 市場概覽
- 市場促進因素
- IRA稅額扣抵和PTC延期
- 風力渦輪機高度降低導致平準化能源成本降低
- 公司間購電協議(PPA)的成長動能
- 維修老舊設備將提高發電能力。
- 綠氫能需求與風能之間的相互關係
- 基於IRA的國內資金獎勵
- 市場限制因素
- 電力傳輸和電網連接瓶頸
- 供應鏈中的資本投資增加與通貨膨脹
- 受《瓊斯法案》約束的船舶短缺(海上)
- 涉及野生動物的訴訟以及當地居民的反對
- 供應鏈分析
- 監理情勢
- 技術展望
- 波特五力模型
- PESTLE分析
第5章 市場規模與成長預測
- 按位置
- 陸上
- 離岸
- 按渦輪機容量
- 3兆瓦或以下
- 3~6 MW
- 6兆瓦或以上
- 透過使用
- 公用事業規模
- 商業和工業用途
- 社區計畫
- 按成分(定性分析)
- 機艙/渦輪機
- 刀刃
- 塔
- 發電機和齒輪箱
- Balance-of-System
第6章 競爭情勢
- 市場集中度
- 策略趨勢(併購、聯盟、購電協議)
- 市場佔有率分析(主要公司的市場排名和佔有率)
- 公司簡介
- NextEra Energy Resources LLC
- Berkshire Hathaway Energy(MidAmerican)
- Invenergy LLC
- Avangrid Renewables LLC
- Duke Energy Sustainable Solutions
- Orsted North America
- Dominion Energy Inc.
- Acciona Energia SA
- EDF Renewables North America
- Enel Green Power North America Inc.
- EDP Renewables North America LLC
- General Electric Vernova
- Siemens Gamesa Renewable Energy
- Vestas-American Wind Technology Inc.
- Nordex USA Inc.
- TPI Composites Inc.
- Pattern Energy Group LP
- Clearway Energy Group
- RES Americas Inc.
- Apex Clean Energy Inc.
- Trident Winds Inc.
第7章 市場機會與未來展望
According to Mordor Intelligence, the United States wind energy market size was valued at 161.20 gigawatt in 2025 and estimated to grow from 167.92 gigawatt in 2026 to reach 205.93 gigawatt by 2031, at a CAGR of 4.17% during the forecast period (2026-2031).
This report is Segmented by Location (Onshore and Offshore), Turbine Capacity (Less Than 3 MW, 3 To 6 MW, and Above 6 MW), and Application (Utility-Scale, Commercial and Industrial, and Community Projects). The Market Size and Forecasts are Provided in Terms of Installed Capacity (GW).
United States Wind Energy Market Trends and Insights
IRA Tax Credits and PTC Extensions
The IRA's 10-year extension of production tax credits through 2032, plus a 10-percentage-point domestic-content adder, lifted post-tax project returns from 6.5% to 8.2%. Announcements for 18 GW of new capacity entered development pipelines during 2024 after the legislation was passed. The law mandates that, by 2025, 40% of steel and 55% of manufactured components originate domestically, steering orders toward Iowa and Colorado factories. Internal Revenue Service audits in late 2024 disqualified 1.2 GW for foreign-origin bearings, spotlighting traceability gaps. Developers in ERCOT now opt for the IRA's 30% investment tax credit to monetize value upfront when volatile basis risk deters long-term PPAs.
Falling LCOE from Taller Turbines
National Renewable Energy Laboratory data show the onshore LCOE sliding to USD 26 per MWh in 2024 as rotor diameters hit 170 m and hub heights 110 m. GE Vernova and Vestas platforms above 6 MW are harvesting 52% capacity factors at Class 4 sites in Arkansas and Tennessee, regions once uneconomical for wind. Thermoplastic composite blades reduce weight by 12% and cut balance-of-system spending by USD 80,000 per turbine. Cost compression has pushed eight gigawatts of gas-fired generation into early retirement during 2024, a pivotal inflection for the United States wind energy market.
Transmission and Interconnection Bottlenecks
Regional transmission queues reached 2,600 GW in December 2024, with wind accounting for 950 GW, and average study times stretched to 5.2 years. MISO alone holds 180 GW awaiting USD 48 billion in network upgrades, 60% of which need new 345-kV lines that require seven years to permit. FERC Order 2023 moves to a first-ready, first-served regime, but only CAISO has fully implemented it by mid-2024, so most developers still face serial processing. Disputes over how to share USD 6 billion of transmission costs halted five projects last year.
Other drivers and restraints analyzed in the detailed report include:
- Corporate PPAs Momentum
- Repowering Aging Fleet Unlocks Capacity
- Rising Capex and Supply-Chain Inflation
For complete list of drivers and restraints, kindly check the Table Of Contents.
Segment Analysis
Onshore assets dominated 99.88% of cumulative capacity in 2025, reflecting decades of incremental build-out across Texas and the Great Plains, where Class 5-7 wind resources deliver 45-50% capacity factors. However, the Bureau of Ocean Energy Management has auctioned eight lease areas since 2022, setting the stage for a 47.69% CAGR in offshore capacity that will reshape the United States wind energy market. Vineyard Wind 1 began commercial operation in May 2024 with 13 MW turbines sustaining 60% capacity factors, demonstrating offshore competitiveness. The onshore build cycle continues in Texas and Oklahoma, which added 5 GW combined in 2024 because ERCOT's merchant model still clears projects within 18 months.
Jones Act constraints limit offshore build-out to about 2 GW per year through 2026, yet project pipelines total 30 GW. Dominion Energy's 2.6 GW Coastal Virginia venture secured the first U.S.-built installation vessel, but day-rates above USD 500,000 lift capex 12% versus European analogs. Repowering older onshore sites provides a parallel growth lever: NextEra's 1.8 GW Iowa campaign tripled site output without new interconnection filings. Floating offshore concepts for California's 25 GW resource remain in pre-commercial testing as mooring systems presently cost USD 1 million per MW, a hurdle unlikely to fall before 2028.
Complete Report Scope:
- By Location
- Onshore
- Offshore
- By Turbine Capacity
- Up to 3 MW
- 3 to 6 MW
- Above 6 MW
- By Application
- Utility-scale
- Commercial and Industrial
- Community Projects
- By Component (Qualitative Analysis)
- Nacelle/Turbine
- Blade
- Tower
- Generator and Gearbox
- Balance-of-System
List of Companies Covered in this Report:
- NextEra Energy Resources LLC
- Berkshire Hathaway Energy (MidAmerican)
- Invenergy LLC
- Avangrid Renewables LLC
- Duke Energy Sustainable Solutions
- Orsted North America
- Dominion Energy Inc.
- Acciona Energia SA
- EDF Renewables North America
- Enel Green Power North America Inc.
- EDP Renewables North America LLC
- General Electric Vernova
- Siemens Gamesa Renewable Energy
- Vestas-American Wind Technology Inc.
- Nordex USA Inc.
- TPI Composites Inc.
- Pattern Energy Group LP
- Clearway Energy Group
- RES Americas Inc.
- Apex Clean Energy Inc.
- Trident Winds Inc.
Additional Benefits:
- The market estimate (ME) sheet in Excel format
- 3 months of analyst support
TABLE OF CONTENTS
1 Introduction
- 1.1 Study Assumptions & Market Definition
- 1.2 Scope of the Study
2 Research Methodology
3 Executive Summary
4 Market Landscape
- 4.1 Market Overview
- 4.2 Market Drivers
- 4.2.1 IRA tax credits & PTC extensions
- 4.2.2 Falling LCOE from taller turbines
- 4.2.3 Corporate PPAs momentum
- 4.2.4 Repowering ageing fleet unlocks capacity
- 4.2.5 Green-hydrogen wind demand nexus
- 4.2.6 Domestic-content bonus under IRA
- 4.3 Market Restraints
- 4.3.1 Transmission & interconnection bottlenecks
- 4.3.2 Rising capex & supply-chain inflation
- 4.3.3 Jones-Act vessel shortage (offshore)
- 4.3.4 Wildlife litigation & local opposition
- 4.4 Supply-Chain Analysis
- 4.5 Regulatory Landscape
- 4.6 Technological Outlook
- 4.7 Porter's Five Forces
- 4.7.1 Bargaining Power of Suppliers
- 4.7.2 Bargaining Power of Buyers
- 4.7.3 Threat of New Entrants
- 4.7.4 Threat of Substitutes
- 4.7.5 Competitive Rivalry
- 4.8 PESTLE Analysis
5 Market Size & Growth Forecasts
- 5.1 By Location
- 5.1.1 Onshore
- 5.1.2 Offshore
- 5.2 By Turbine Capacity
- 5.2.1 Up to 3 MW
- 5.2.2 3 to 6 MW
- 5.2.3 Above 6 MW
- 5.3 By Application
- 5.3.1 Utility-scale
- 5.3.2 Commercial and Industrial
- 5.3.3 Community Projects
- 5.4 By Component (Qualitative Analysis)
- 5.4.1 Nacelle/Turbine
- 5.4.2 Blade
- 5.4.3 Tower
- 5.4.4 Generator and Gearbox
- 5.4.5 Balance-of-System
6 Competitive Landscape
- 6.1 Market Concentration
- 6.2 Strategic Moves (M&A, Partnerships, PPAs)
- 6.3 Market Share Analysis (Market Rank/Share for key companies)
- 6.4 Company Profiles (includes Global level Overview, Market level overview, Core Segments, Financials as available, Strategic Information, Products & Services, and Recent Developments)
- 6.4.1 NextEra Energy Resources LLC
- 6.4.2 Berkshire Hathaway Energy (MidAmerican)
- 6.4.3 Invenergy LLC
- 6.4.4 Avangrid Renewables LLC
- 6.4.5 Duke Energy Sustainable Solutions
- 6.4.6 Orsted North America
- 6.4.7 Dominion Energy Inc.
- 6.4.8 Acciona Energia SA
- 6.4.9 EDF Renewables North America
- 6.4.10 Enel Green Power North America Inc.
- 6.4.11 EDP Renewables North America LLC
- 6.4.12 General Electric Vernova
- 6.4.13 Siemens Gamesa Renewable Energy
- 6.4.14 Vestas-American Wind Technology Inc.
- 6.4.15 Nordex USA Inc.
- 6.4.16 TPI Composites Inc.
- 6.4.17 Pattern Energy Group LP
- 6.4.18 Clearway Energy Group
- 6.4.19 RES Americas Inc.
- 6.4.20 Apex Clean Energy Inc.
- 6.4.21 Trident Winds Inc.
7 Market Opportunities & Future Outlook
- 7.1 Expansion in the Offshore Sector
- 7.2 Hybrid Wind-Solar-Storage Projects
- 7.3 Green Hydrogen Integration
- 7.4 Repowering Market Potential

 2026-2030年全球風力發電市場
 風力發電單樁市場規模、佔有率和成長分析:按單樁類型、水深、基礎直徑、應用、最終用戶和地區分類-2026-2033年產業預測
 義大利風力發電:市場佔有率分析、產業趨勢與統計及成長預測(2026-2031 年)英國風力發電:市場佔有率分析、產業趨勢與統計及成長預測(2026-2031)日本風力發電:市場佔有率分析、產業趨勢與統計及成長預測(2026-2031)泰國風力發電:市場佔有率分析、產業趨勢與統計及成長預測(2026-2031)
 2034年離岸風力發電基礎市場預測-以固定式基礎、浮體式基礎、安裝/物流和區域分類的全球分析印度風力發電:市場佔有率分析、產業趨勢與統計及成長預測(2026-2031)
 全球風電市場規模、佔有率、趨勢和成長分析報告(2026-2034年)
 風力發電基礎市場規模、佔有率和成長分析:按基礎類型、渦輪機朝向、安裝類型、應用和地區分類-2026-2033年產業預測