


 |
市場調查報告書
商品編碼
2100556
印度風力發電:市場佔有率分析、產業趨勢與統計及成長預測(2026-2031)India Wind Energy - Market Share Analysis, Industry Trends & Statistics, Growth Forecasts (2026 - 2031) |
||||||

※ 本網頁內容可能與最新版本有所差異。詳細情況請與我們聯繫。
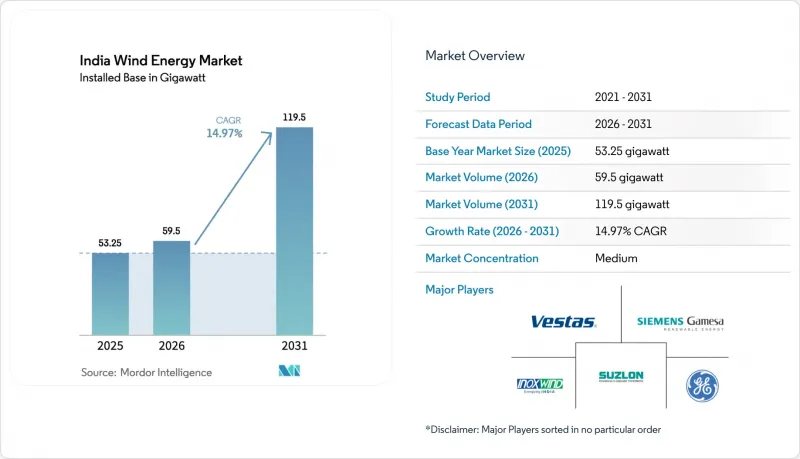
根據 Mordor Intelligence 預測,印度風電市場規模(以裝置容量計算)預計將在 2025 年達到 53.25 吉瓦,2026 年達到 59.5 吉瓦,到 2031 年達到 119.5 吉瓦,2026 年至 2031 年的複合年成長率為 114.97%。
本報告按位置(陸上和海上)、渦輪機功率(3MW以下、3-6MW、6MW以上)和應用(公用事業規模、商業/工業、社區專案)進行細分。市場規模和預測均以裝置容量(GW)為基礎。
印度風力發電市場趨勢與洞察
混合可再生能源競標加快了產能利用率。
2025會計年度,泰米爾納德邦和古吉拉突邦以混合競標授予了1,200兆瓦的風電計畫。這增強了印度的風力發電市場,因為電廠的綜合負載率超過35%,使得開發商資金籌措,比獨立風電的基準利率低150個基點。印度太陽能公司(SECI)的第八屆ISTS混合競標以每千瓦時2.99至3.04盧比(0.036至0.037美元)的價格區間成功中標,證實了風能和太陽能的結合可以顯著降低併網成本。在泰米爾納德邦,一個34.75兆瓦的改造為混合發電試點項目,透過將15台1.5兆瓦的風力渦輪機替換為5台3兆瓦的風力渦輪機,並在同一地點安裝了10兆瓦的太陽能發電設施,使年發電量加倍。在古吉拉突邦的庫奇地區,夜間風力發電高峰期,加上白天平均5.5千瓦時/平方米/天的強勁太陽輻射,進一步降低了電力供應受限的風險,從而帶來額外效益。此外,採用混合發電模式可以避免邦級能源儲備上限的限制,這些上限通常會迫使發電業者在季風季節減少發電量,從而保障收入來源。
可行性缺口資金正在推動離岸風電供應鏈的擴張。
印度新能源和可再生能源部已累計685.3億盧比(約8.2億美元)用於降低首個1吉瓦離岸風力發電專案的風險。這筆資金將平均分配給古吉拉突邦的坎巴特灣和泰米爾納德邦的馬納爾灣,電價固定為每千瓦時4.5盧比(約0.054美元)。憑藉這項補貼,西門子歌美颯和維斯塔斯宣布計劃在古吉拉突邦建造一座新的葉片式風力發電機組工廠,目標是在2028年之前競標4吉瓦的離岸風電項目。國家風力發電研究所的海底勘測顯示,水深30至60公尺的海域蘊藏著70吉瓦的技術潛力,但併網仍是一項重大挑戰。印度電力傳輸公司(PGC)正在設計一條從坎貝灣到索拉什特拉的2000兆瓦高壓直流輸電線路,但由於變電站用地徵用延誤,預計該線路的運作時間將推遲到2027年下半年。如果沒有這條輸電走廊,開發商已持有水下租賃權的500兆古吉拉突邦先導計畫將無法完成融資。這凸顯了電網的「安全隔離網閘」作用。
卡納塔克邦和馬哈拉斯特拉邦土地徵用的限制
卡納塔克邦和馬哈拉斯特拉邦計劃在2024年新增2.1吉瓦的風電裝置容量,但印度風電市場目前面臨伐木許可證核准延誤的問題,導致工程工期延長18至24個月。卡納塔克邦林業部門要求在相當於擬開發面積兩倍的面積上進行補償造林,這使得土地成本高達每兆瓦100萬盧比(約1.2萬美元)。在馬哈拉斯特拉邦,由於與當地社區存在土地所有權糾紛,薩塔拉區五個風電場的核准程序已被暫停,約800兆瓦的裝置容量被凍結。開發人員正將目光轉向拉賈斯坦邦和古吉拉突邦,但這兩個邦100公尺輪轂高度處的風速僅6.5公尺/秒,導致其裝置容量利用率比卡納塔克邦的7.2公尺/秒低8%至10%。此外,一塊足以容納 140 公尺轉子的連續土地分散在多個小規模地主手中,這增加了交易的複雜性,並阻礙了改造項目。
細分市場分析
2025年,陸域風電將佔印度風力發電市場的全部佔有率,同年新增裝置容量3.4吉瓦。在各邦政府強勁的購電協議(PPA)需求推動下,預計到2031年,陸上風電將以14.9%的複合年成長率成長。 2024年,古吉拉突邦以1250兆瓦的裝置容量位居榜首,其次是卡納塔克邦(1135兆瓦)和泰米爾納德邦(980兆瓦)。這主要得益於這些邦已建立完善的土地徵用和併網流程。目前,離岸風力發電容量佔比為零,但古吉拉突邦和泰米爾納德邦的兩個總裝置容量為1吉瓦(每個500兆瓦)的先導計畫已資金籌措,計劃在輸電線路投入運營後於2028年投入運作。全國海底勘測顯示,中等水深海域的離岸風電技術潛力可達70吉瓦。
從古吉拉突邦的葉片製造到喜馬偕爾邦的機艙組裝,陸上風電供應鏈主要由國內原始設備製造商 (OEM)主導,從而實現了六個月的交付週期。拉賈斯坦邦和安得拉邦的計畫目前正在為專用綠色氫能綜合設施供電,這些設施將 2,400 兆瓦的風電與太陽能和儲能相結合,以確保 70% 的年運轉率,進一步支撐了印度的風力發電市場。離岸風電的使用率高於陸上風電的 25-30%,如果電網瓶頸問題解決,更高的上網電價可能會適用。然而,開發商仍然擔心高達 40% 的高額資本投資成本以及安裝船隻的供不應求。因此,預計到 2027 年,大部分資金仍將集中在陸上風電改造和混合資產。
其他好處:
- Excel格式的市場預測(ME)表
- 3個月的分析師支持
目錄
第1章:引言
- 研究假設和市場定義
- 調查範圍
第2章:調查方法
第3章執行摘要
第4章 市場狀況
- 市場概覽
- 市場促進因素
- 結合風能和太陽能的混合可再生能源競標的加速推進,正在提高泰米爾納德邦和古吉拉突邦的發電容量利用率。
- 為古吉拉突邦首個 4GW離岸風力發電計畫提供的可行性缺口資金將刺激供應鏈投資。
- 該改造計畫將用高輸出渦輪機取代老舊的 5 至 15 吉瓦風電場。
- 綠氫能政策正在推動工業叢集對高運轉率風力發電的需求。
- 免除ISTS費用提高了資源豐富的西部各州風發電工程的內部收益率。
- 資料中心營運商發現,公司間購電協議 (PPA) 的數量激增,他們尋求將風能和太陽能發電相結合,用於其即時資料中心 (RTC)。
- 市場限制因素
- 卡納塔克邦和馬哈拉斯特拉邦凍結土地分配,減緩了國內管道建設的進展。
- 坎巴特灣離岸風力發電電網疏散走廊建設延誤。
- 渦輪機零件消費稅的增加降低了它們與太陽能發電的競爭力。
- 各邦電力分配公司(DISCOM)正在實施銀行監管規定(能源佔有率超過 30%),這增加了發電限制的風險。
- 供應鏈分析
- 監理展望
- 技術展望
- 波特五力模型
- PESTLE分析
第5章 市場規模與成長預測
- 按位置
- 陸上
- 離岸
- 按渦輪機容量
- 3兆瓦或以下
- 3~6 MW
- 6兆瓦或以上
- 透過使用
- 公用事業規模
- 商業和工業用途
- 社區計畫
- 按成分(定性分析)
- 機艙/渦輪機
- 刀刃
- 塔
- 發電機和齒輪箱
- Balance-of-System
第6章 競爭情勢
- 市場集中度
- 策略趨勢(併購、聯盟、購電協議)
- 市場佔有率分析(主要公司的市場排名和佔有率)
- 公司簡介
- Inox Wind Limited
- Suzlon Energy Limited
- Siemens Gamesa Renewable Energy SA
- Vestas Wind Systems A/S
- General Electric Company
- Envision Energy
- Wind World(India)Ltd
- Tata Power Renewable Energy Ltd
- Enercon GmbH
- Senvion India
- ReNew Power(ReNew Energy Global PLC)
- Adani Green Energy Ltd
- JSW Energy-Mytrah Cluster
- Amp Energy India Pvt Ltd
- Greenko Group
- Siemens Energy AG
- Mingyang Smart Energy
- Nordex SE
- Leitwind Shriram Manufacturing Ltd
- GE T&D India Ltd
- SKF India
- Hitachi Energy India Ltd
- Bharat Heavy Electricals Ltd
- LM Wind Power(India)
第7章 市場機會與未來展望
According to Mordor Intelligence, the India wind energy market size in terms of installed base is projected to be 53.25 gigawatt in 2025, 59.5 gigawatt in 2026, and reach 119.5 gigawatt by 2031, growing at a CAGR of 14.97% from 2026 to 2031.
This report is Segmented by Location (Onshore and Offshore), Turbine Capacity (Up To 3 MW, 3 To 6 MW, and Above 6 MW), and Application (Utility-Scale, Commercial and Industrial, and Community Projects). The Market Sizes and Forecasts are Provided in Terms of Installed Capacity (GW).
India Wind Energy Market Trends and Insights
Hybrid Renewable Auctions Accelerate Capacity Utilization
Hybrid tenders awarded 1,200 MW in Tamil Nadu and Gujarat in fiscal 2025, strengthening the India wind energy market by lifting combined plant-load factors above 35% and permitting developers to secure debt at 9.5% interest, 150 basis points below standalone wind benchmarks. The Solar Energy Corporation of India's eighth ISTS hybrid tranche cleared at tariffs between Rs 2.99 and Rs 3.04 per kWh (USD 0.036-0.037 per kWh), confirming that colocating wind and solar slashes balancing-of-system costs. Tamil Nadu's 34.75 MW repowering-to-hybrid pilot doubled annual generation by replacing fifteen 1.5 MW turbines with five 3 MW machines paired with 10 MW of solar on the same site. Gujarat's Kutch region benefits further because nocturnal wind peaks dovetail with strong daytime solar irradiation, which averages 5.5 kWh/m2/day, reducing curtailment risk. Moreover, hybrid structures sidestep state-level energy-banking caps that typically force generators to curtail during monsoon months, protecting revenue streams.
Viability-Gap Funding Unlocks Offshore Supply Chains
The Ministry of New and Renewable Energy earmarked Rs 6,853 crore (USD 820 million) to de-risk the first 1 GW of offshore capacity, split evenly between Gujarat's Gulf of Khambhat and Tamil Nadu's Gulf of Mannar, by fixing tariffs at Rs 4.5 per kWh (USD 0.054 per kWh). This subsidy persuaded Siemens Gamesa and Vestas to announce new blade and nacelle factories in Gujarat aimed at a 4 GW tender pipeline through 2028. Seabed surveys by the National Institute of Wind Energy indicate 70 GW of technical potential in 30 m-60 m depths, but evacuation remains critical. Power Grid Corporation of India is designing a 2,000 MW HVDC link from the Gulf of Khambhat to Saurashtra, yet land acquisition for converter stations delays commissioning until late 2027. Without that corridor, the 500 MW Gujarat pilot cannot reach financial close even though developers already hold seabed leases, underscoring the grid's gatekeeper role.
Land Allotment Constraints in Karnataka and Maharashtra
Karnataka and Maharashtra contributed 2.1 GW of 2024 installations, but the India wind energy market now faces forest-clearance backlogs that extend project schedules by 18-24 months. Karnataka's Forest Department demands compensatory afforestation at double the diverted acreage, inflating per-megawatt land cost by up to Rs 10 lakh (USD 12,000). Maharashtra halted approvals in five talukas of Satara after title disputes with tribal communities froze roughly 800 MW of capacity. Developers pivot to Rajasthan and Gujarat, but lower wind speeds of 6.5 m/s at a 100 m hub height shave capacity-utilization factors by 8-10% compared with Karnataka's 7.2 m/s profile. Repowering projects also stall because contiguous plots large enough for 140 m rotors are fragmented across multiple smallholders, elevating transaction complexity.
Other drivers and restraints analyzed in the detailed report include:
- Repowering Scheme Targets 5 GW-15 GW of Ageing Assets
- Green Hydrogen Policy Drives Industrial Wind Demand
- Grid Evacuation Delays for Offshore Wind
For complete list of drivers and restraints, kindly check the Table Of Contents.
Segment Analysis
Onshore capacity accounted for the entire India wind energy market in 2025, expanding by 3.4 GW that year and heading toward a 14.9% CAGR through 2031, underpinned by robust state PPA demand. Gujarat led 2024 installations with 1,250 MW, followed by Karnataka at 1,135 MW and Tamil Nadu at 980 MW, as these states maintained clear land and grid processes. Offshore contributes none of the installed base today, yet a 1 GW funded pilot, 500 MW each in Gujarat and Tamil Nadu, targets commissioning by 2028 once the Power Grid evacuation link activates. National seabed surveys suggest 70 GW of technical potential at moderate depths.
Domestic OEMs dominate the onshore supply chain from blade fabrication in Gujarat to nacelle assembly in Himachal Pradesh, enabling six-month delivery cycles. Projects in Rajasthan and Andhra Pradesh now serve dedicated green-hydrogen complexes, pairing 2,400 MW of wind with solar and storage to guarantee 70% annual availability, further supporting the India wind energy market. Offshore's higher capacity factors, 45-50% compared with 25-30% onshore, could unlock premium tariffs once grid bottlenecks clear, but developers remain wary of the 40% capex premium and limited installation vessel availability. Consequently, most capital will continue to favor onshore repowering and hybrid assets until 2027.
Complete Report Scope:
- By Location
- Onshore
- Offshore
- By Turbine Capacity
- Up to 3 MW
- 3 to 6 MW
- Above 6 MW
- By Application
- Utility-scale
- Commercial and Industrial
- Community Projects
- By Component (Qualitative Analysis)
- Nacelle/Turbine
- Blade
- Tower
- Generator and Gearbox
- Balance-of-System
List of Companies Covered in this Report:
- Inox Wind Limited
- Suzlon Energy Limited
- Siemens Gamesa Renewable Energy SA
- Vestas Wind Systems A/S
- General Electric Company
- Envision Energy
- Wind World (India) Ltd
- Tata Power Renewable Energy Ltd
- Enercon GmbH
- Senvion India
- ReNew Power (ReNew Energy Global PLC)
- Adani Green Energy Ltd
- JSW Energy - Mytrah Cluster
- Amp Energy India Pvt Ltd
- Greenko Group
- Siemens Energy AG
- Mingyang Smart Energy
- Nordex SE
- Leitwind Shriram Manufacturing Ltd
- GE T&D India Ltd
- SKF India
- Hitachi Energy India Ltd
- Bharat Heavy Electricals Ltd
- LM Wind Power (India)
Additional Benefits:
- The market estimate (ME) sheet in Excel format
- 3 months of analyst support
TABLE OF CONTENTS
1 Introduction
- 1.1 Study Assumptions & Market Definition
- 1.2 Scope of the Study
2 Research Methodology
3 Executive Summary
4 Market Landscape
- 4.1 Market Overview
- 4.2 Market Drivers
- 4.2.1 Accelerated Hybrid Renewable Auctions Bundling Wind with Solar Enhancing Capacity Utilisation in Tamil Nadu & Gujarat
- 4.2.2 Viability-Gap Funding for Initial 4 GW Offshore Wind Round in Gujarat Catalyst for Supply-Chain Investments
- 4.2.3 Repowering Scheme Opening 5-15 GW of Ageing Wind Farms for High-Capacity Turbines
- 4.2.4 Green Hydrogen Policy Driving Demand for High-Load-Factor Wind Power in Industrial Clusters
- 4.2.5 ISTS Charge Waivers Boosting Wind Project IRRs in Resource-Rich Western States
- 4.2.6 Corporate PPAs Surge from Data-centre Operators Seeking RTC Wind-Solar Mix
- 4.3 Market Restraints
- 4.3.1 Land Allotment Freeze in Karnataka & Maharashtra Slowing Onshore Pipeline
- 4.3.2 Delayed Grid Evacuation Corridors for Offshore Wind at Gulf of Khambhat
- 4.3.3 Rising GST on Turbine Components Eroding Cost Competitiveness vs Solar
- 4.3.4 Banking Restrictions (above 30% Energy) by State DISCOMs Increasing Curtailment Risk
- 4.4 Supply-Chain Analysis
- 4.5 Regulatory Outlook
- 4.6 Technological Outlook
- 4.7 Porter's Five Forces
- 4.7.1 Bargaining Power of Suppliers
- 4.7.2 Bargaining Power of Buyers
- 4.7.3 Threat of New Entrants
- 4.7.4 Threat of Substitutes
- 4.7.5 Competitive Rivalry
- 4.8 PESTLE Analysis
5 Market Size & Growth Forecasts
- 5.1 By Location
- 5.1.1 Onshore
- 5.1.2 Offshore
- 5.2 By Turbine Capacity
- 5.2.1 Up to 3 MW
- 5.2.2 3 to 6 MW
- 5.2.3 Above 6 MW
- 5.3 By Application
- 5.3.1 Utility-scale
- 5.3.2 Commercial and Industrial
- 5.3.3 Community Projects
- 5.4 By Component (Qualitative Analysis)
- 5.4.1 Nacelle/Turbine
- 5.4.2 Blade
- 5.4.3 Tower
- 5.4.4 Generator and Gearbox
- 5.4.5 Balance-of-System
6 Competitive Landscape
- 6.1 Market Concentration
- 6.2 Strategic Moves (M&A, Partnerships, PPAs)
- 6.3 Market Share Analysis (Market Rank/Share for key companies)
- 6.4 Company Profiles (includes Global level Overview, Market level overview, Core Segments, Financials as available, Strategic Information, Products & Services, and Recent Developments)
- 6.4.1 Inox Wind Limited
- 6.4.2 Suzlon Energy Limited
- 6.4.3 Siemens Gamesa Renewable Energy SA
- 6.4.4 Vestas Wind Systems A/S
- 6.4.5 General Electric Company
- 6.4.6 Envision Energy
- 6.4.7 Wind World (India) Ltd
- 6.4.8 Tata Power Renewable Energy Ltd
- 6.4.9 Enercon GmbH
- 6.4.10 Senvion India
- 6.4.11 ReNew Power (ReNew Energy Global PLC)
- 6.4.12 Adani Green Energy Ltd
- 6.4.13 JSW Energy - Mytrah Cluster
- 6.4.14 Amp Energy India Pvt Ltd
- 6.4.15 Greenko Group
- 6.4.16 Siemens Energy AG
- 6.4.17 Mingyang Smart Energy
- 6.4.18 Nordex SE
- 6.4.19 Leitwind Shriram Manufacturing Ltd
- 6.4.20 GE T&D India Ltd
- 6.4.21 SKF India
- 6.4.22 Hitachi Energy India Ltd
- 6.4.23 Bharat Heavy Electricals Ltd
- 6.4.24 LM Wind Power (India)
7 Market Opportunities & Future Outlook
- 7.1 White-space & Unmet-Need Assessment

 2026-2030年全球風力發電市場
 風力發電單樁市場規模、佔有率和成長分析:按單樁類型、水深、基礎直徑、應用、最終用戶和地區分類-2026-2033年產業預測
 義大利風力發電:市場佔有率分析、產業趨勢與統計及成長預測(2026-2031 年)英國風力發電:市場佔有率分析、產業趨勢與統計及成長預測(2026-2031)日本風力發電:市場佔有率分析、產業趨勢與統計及成長預測(2026-2031)泰國風力發電:市場佔有率分析、產業趨勢與統計及成長預測(2026-2031)美國風力發電:市場佔有率分析、產業趨勢與統計及成長預測(2026-2031)
 2034年離岸風力發電基礎市場預測-以固定式基礎、浮體式基礎、安裝/物流和區域分類的全球分析
 全球風電市場規模、佔有率、趨勢和成長分析報告(2026-2034年)
 風力發電基礎市場規模、佔有率和成長分析:按基礎類型、渦輪機朝向、安裝類型、應用和地區分類-2026-2033年產業預測