


 |
市場調查報告書
商品編碼
2113478
泰國風力發電:市場佔有率分析、產業趨勢與統計及成長預測(2026-2031)Thailand Wind Energy - Market Share Analysis, Industry Trends & Statistics, Growth Forecasts (2026 - 2031) |
||||||

※ 本網頁內容可能與最新版本有所差異。詳細情況請與我們聯繫。
根據 Mordor Intelligence 預測,泰國風力發電市場將從 2025 年的 1.60 吉瓦成長到 2026 年的 1.71 吉瓦,然後從 2026 年到 2031 年以 6.82% 的複合年成長率成長,到 2031 年達到 2.37 吉瓦。
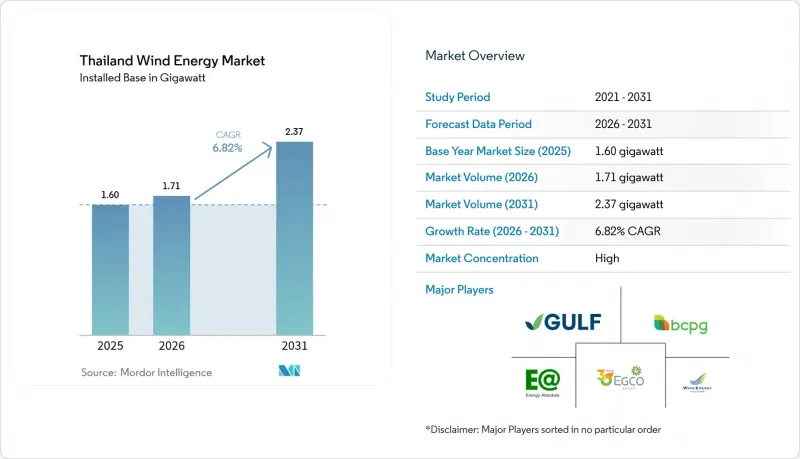
本報告按位置(陸上和海上)、渦輪機功率(小於3兆瓦、3-6兆瓦和大於6兆瓦)和應用(公用事業規模、商業/工業和社區項目)進行細分。市場規模和預測以裝置容量(吉瓦)表示。
泰國風力發電市場趨勢與洞察
政府到2036年的可再生能源發電目標
《2024年電力發展規劃》要求到2037年新增累計5345吉瓦風電裝置容量,使現有裝置容量翻三倍,並使風電成為僅次於太陽能的第二大再生能源來源。該政策的根本目標是減少對進口液化天然氣(LNG)的依賴,但10公尺輪轂高度處的平均風速在2.8至4.0公尺/秒之間,需要建造高大的風力渦輪機,從而導致資本支出(CAPEX)增加。為確保獲利能力,政府將上網電價維持在每千瓦時3.10泰銖,直至2030年。 2024年9月的競標吸引了12家競標,爭取600兆瓦的配額。這表明,儘管產能利用率低於30%,但市場信心依然強勁。此外,對於90兆瓦以下的項目,環境評估流程已簡化至12個月內完成,使開發商能夠將開工時間縮短一半。國際能源總署(IEA)將泰國2024年的可再生能源預測值上調了26%,主要原因是風能供應前景有所改善。
競爭性的上網電價補貼(FIT)制度/競標制度正在吸引獨立發電商(IPP)的資金。
自2022年以來,兩項獎勵——10兆瓦以下電廠的上網電價補貼(FIT)制度和大型風電場的競標——已推動風電領域的投資承諾達到800億泰銖。 25年的購電價格比批發價格高出40%,使獨立發電商(IPP)能夠獲得低成本的多邊融資。例如,2024年11月,亞洲開發銀行(ADB)為海灣能源公司安排了一筆8.2億美元的企業聯合貸款。雖然90兆瓦的競標上限防止了市場壟斷,但透過合資企業進行擴張是可行的,海灣能源公司和阿爾法能源公司於2025年9月宣布成立的208兆瓦合資企業就證明了這一點。非承諾發電條款限制了白天太陽能發電高峰期的購電價格,使支付額減少了近15%。目前關於競標評估的爭議表明,投資者對透明的監管機制非常重視。
陸域風力發電適用的平均風速較低的地區
泰國全國平均風速為2.8-4.0米/秒(10米高度),大部分位置被分類為1級風區,因此輪轂高度必須設定在100米,導致其投資成本比越南3級位置高出近18%。 2024年平均容量係數為28%,比全球平均低約1400個滿載小時。因此,泰國的風力發電市場需要比其他國家高出30%的上網電價補貼才能達到10-11%的股本報酬率。在中部和南部地區,即使在80公尺高度,風速也低於5公尺/秒,這解釋了為什麼85%的專案集中在東北部。根據Ember發布的2024年報告,在泰國條件下,風電的平準化電成本(LCOE)至少比太陽能發電低25%。
細分市場分析
到2025年,陸域風電將佔泰國風力發電市場1.60吉瓦裝置容量的全部。在第二階段600兆瓦競標中,預計到2031年,新增陸域風電裝置容量將以6.85%的複合年成長率成長。離岸風能資源調查顯示,在水深50-80公尺的海域,風速可達5.5-6.0公尺/秒,但損益平衡點購電價格超過每千瓦時5.00泰銖,遠高於目前的政策支援水準。東北部的陸上電廠靠近115千伏輸電線路,可將併網成本控制在每兆瓦800萬泰銖。相較之下,海底電纜的成本高達每兆瓦2500萬泰銖。 Akiona Energia 的 436 兆瓦承諾證實了開發商對樞紐 80 公尺且平準化能源成本 (LCOE) 低於 0.070 美元/千瓦時的陸上專案的持續濃厚興趣。
儘管開發商預計一個200兆瓦的海上試點計畫將於2027年啟動,但由於浮體式基礎每兆瓦需額外增加120萬美元的成本,商業規模部署可能會推遲到預測期之後。因此,預計到2031年,陸上風電仍將佔據泰國風力發電市場至少94.75%的佔有率,而離岸風電仍將是一項政策目標。
其他好處:
- Excel格式的市場預測(ME)表
- 3個月的分析師支持
目錄
第1章:引言
- 研究假設和市場定義
- 調查範圍
第2章:調查方法
第3章執行摘要
第4章 市場狀況
- 市場概覽
- 市場促進因素
- 政府到2036年的可再生能源發電目標
- 具競爭力的上網電價補貼(FiT)/競標制度吸引獨立發電企業(IPP)的資金
- 更大功率渦輪機的引入和供應鏈的擴張導致了平準化能源成本的下降。
- 企業對可再生能源證書(REC)的需求以及綠色電力購買協議(PPA)的蓬勃發展
- 泰國灣海上風能資源測繪
- EGAT的風氫混合示範計畫正在向電網展示其價值。
- 市場限制因素
- 陸地平均風速較低的地區
- 地方電網瓶頸和輸出削減風險
- 由於當地居民反對土地用途,獲得許可的進程被延誤了。
- 該地區製造地的脆弱性
- 供應鏈分析
- 監理情勢
- 技術展望
- 波特五力模型
- PESTLE分析
- 主要項目資訊
第5章 市場規模與成長預測
- 按位置
- 陸上
- 離岸
- 按渦輪機容量
- 3兆瓦或以下
- 3~6 MW
- 6兆瓦或以上
- 透過使用
- 公用事業規模
- 商業和工業用途
- 社區計畫
- 按成分(定性分析)
- 機艙/渦輪機
- 刀刃
- 塔
- 發電機和齒輪箱
- BOS(Balance-of-System)
第6章 競爭情勢
- 市場集中度
- 策略趨勢(併購、聯盟、購電協議)
- 市場佔有率分析(主要公司的市場排名和佔有率)
- 公司簡介
- Energy Absolute PCL
- Wind Energy Holding Co Ltd
- Electricity Generating PCL(EGCO)
- Gulf Energy Development PCL
- BCPG PCL
- PTT Public Co Ltd(PTT Renewables)
- Siam Wind Energy Co Ltd
- Impact Energy Asia Development
- Siemens Gamesa Renewable Energy SA
- Vestas Wind Systems A/S
- Goldwind Science & Technology Co Ltd
- GE Vernova
- Ming Yang Smart Energy
- Envision Energy
- Acciona Energia
- Ratch Group PCL
- B.Grimm Power PCL
- Banpu NEXT
- TruWind Co Ltd
- WHA Utilities & Power PCL
第7章 市場機會與未來展望
According to Mordor Intelligence, the Thailand wind energy market size is expected to grow from 1.60 gigawatt in 2025 to 1.71 gigawatt in 2026 and is forecast to reach 2.37 gigawatt by 2031 at 6.82% CAGR over 2026-2031.
This report is Segmented by Location (Onshore and Offshore), Turbine Capacity (Less Than 3 MW, 3 To 6 MW, and Above 6 MW), and Application (Utility-Scale, Commercial and Industrial, and Community Projects). The Market Size and Forecasts are Provided in Terms of Installed Capacity (GW).
Thailand Wind Energy Market Trends and Insights
Government Renewable Capacity Targets to 2036
The Power Development Plan 2024 mandates 5.345 GW of cumulative wind additions by 2037, tripling the present fleet and positioning wind behind solar as the grid's second-largest renewable source. Reducing dependence on imported liquefied natural gas underpins the policy, yet average site wind speeds of 2.8-4.0 m/s at 10 m hub heights demand tall turbines, inflating capex. Maintaining the THB 3.10 tariff through 2030 shields returns, and the September 2024 auction drew 12 bidders chasing 600 MW, underscoring confidence despite sub-30% capacity factors. Streamlined environmental reviews now close within 12 months for <=90 MW projects, helping developers halve pre-construction time. The International Energy Agency lifted Thailand's renewable forecast by 26% in 2024, chiefly on stronger wind delivery signals.
Competitive FiT / Auction Schemes Attracting IPP Capital
A two-track incentive, feed-in tariffs for sub-10 MW plants and auctions for larger arrays, mobilized THB 80 billion in committed wind outlays since 2022. The 25-year tariff stands 40% above wholesale prices, enabling IPPs to secure low-cost multilateral debt; for instance, the Asian Development Bank syndicated USD 820 million to Gulf Energy in November 2024. Auction caps of 90 MW curb market dominance, yet joint ventures allow scale, as shown by Gulf's 208 MW tie-up with Alpha Energy announced in September 2025. Non-firm dispatch clauses clip realized tariffs during solar midday peaks, trimming payouts by nearly 15 %. Ongoing litigation over bid scoring indicates investor sensitivity to transparent oversight.
Low Average On-Shore Wind Speed Zones
National mean winds of 2.8-4.0 m/s at 10 m classify most sites as Wind Class 1, forcing 100 m hub heights and lifting capex by nearly 18% versus Class 3 sites in Vietnam. Capacity factors averaged 28 % in 2024, roughly 1,400 full-load hours below the global norm; hence, the Thailand wind energy market relies on tariffs 30 % above peers to attain 10-11 % equity returns. Central and southern zones exhibit sub-5 m/s winds even at 80 m, explaining why 85 % of projects cluster in the northeast. Ember's 2024 review noted wind's LCOE still trails solar's by at least 25 % under Thai conditions.
Other drivers and restraints analyzed in the detailed report include:
- Falling LCOE from Larger Turbines & Supply-Chain Scale
- Corporate REC Demand & Green-PPA Boom
- Rural Grid Bottlenecks & Curtailment Risk
For complete list of drivers and restraints, kindly check the Table Of Contents.
Segment Analysis
Onshore assets represented the entire Thailand wind energy market size of 1.60 GW in 2025, and onshore additions are slated to grow 6.85% CAGR to 2031 under the 600 MW second-phase auction. Offshore resource studies show 5.5-6.0 m/s winds in 50-80 m waters, but breakeven tariffs exceed THB 5.00 /kWh, well above current policy support. Northeastern onshore sites lie near 115 kV lines, keeping grid-tie costs at THB 8 million /MW compared with THB 25 million /MW for subsea cables. Acciona Energia's 436 MW commitment underscores sustained developer preference for land-based projects that clear USD 0.070 /kWh LCOE at 80 m hub heights.
Developers anticipate a 200 MW offshore pilot in 2027, yet commercial deployment will likely trail the forecast window because floating foundations add USD 1.2 million /MW. Consequently, onshore capacity should still control at least a 94.75% Thailand wind energy market share by 2031 while offshore remains a policy aspiration.
Complete Report Scope:
- By Location
- Onshore
- Offshore
- By Turbine Capacity
- Up to 3 MW
- 3 to 6 MW
- Above 6 MW
- By Application
- Utility-scale
- Commercial and Industrial
- Community Projects
- By Component (Qualitative Analysis)
- Nacelle/Turbine
- Blade
- Tower
- Generator and Gearbox
- Balance-of-System
List of Companies Covered in this Report:
- Energy Absolute PCL
- Wind Energy Holding Co Ltd
- Electricity Generating PCL (EGCO)
- Gulf Energy Development PCL
- BCPG PCL
- PTT Public Co Ltd (PTT Renewables)
- Siam Wind Energy Co Ltd
- Impact Energy Asia Development
- Siemens Gamesa Renewable Energy SA
- Vestas Wind Systems A/S
- Goldwind Science & Technology Co Ltd
- GE Vernova
- Ming Yang Smart Energy
- Envision Energy
- Acciona Energia
- Ratch Group PCL
- B.Grimm Power PCL
- Banpu NEXT
- TruWind Co Ltd
- WHA Utilities & Power PCL
Additional Benefits:
- The market estimate (ME) sheet in Excel format
- 3 months of analyst support
TABLE OF CONTENTS
1 Introduction
- 1.1 Study Assumptions & Market Definition
- 1.2 Scope of the Study
2 Research Methodology
3 Executive Summary
4 Market Landscape
- 4.1 Market Overview
- 4.2 Market Drivers
- 4.2.1 Government renewable capacity targets to 2036
- 4.2.2 Competitive FiT/auction schemes attracting IPP capital
- 4.2.3 Falling LCOE from larger turbines & supply-chain scale
- 4.2.4 Corporate REC demand & green-PPA boom
- 4.2.5 Offshore wind resource mapping in Gulf of Thailand
- 4.2.6 EGAT wind-hydrogen hybrid pilots proving grid value
- 4.3 Market Restraints
- 4.3.1 Low average on-shore wind speed zones
- 4.3.2 Rural grid bottlenecks & curtailment risk
- 4.3.3 Community land-use opposition delaying permits
- 4.3.4 Thin local component manufacturing base
- 4.4 Supply-Chain Analysis
- 4.5 Regulatory Landscape
- 4.6 Technological Outlook
- 4.7 Porter's Five Forces
- 4.7.1 Threat of New Entrants
- 4.7.2 Bargaining Power of Suppliers
- 4.7.3 Bargaining Power of Buyers
- 4.7.4 Threat of Substitutes
- 4.7.5 Competitive Rivalry
- 4.8 PESTLE Analysis
- 4.9 Key Projects Information
5 Market Size & Growth Forecasts
- 5.1 By Location
- 5.1.1 Onshore
- 5.1.2 Offshore
- 5.2 By Turbine Capacity
- 5.2.1 Up to 3 MW
- 5.2.2 3 to 6 MW
- 5.2.3 Above 6 MW
- 5.3 By Application
- 5.3.1 Utility-scale
- 5.3.2 Commercial and Industrial
- 5.3.3 Community Projects
- 5.4 By Component (Qualitative Analysis)
- 5.4.1 Nacelle/Turbine
- 5.4.2 Blade
- 5.4.3 Tower
- 5.4.4 Generator and Gearbox
- 5.4.5 Balance-of-System
6 Competitive Landscape
- 6.1 Market Concentration
- 6.2 Strategic Moves (M&A, Partnerships, PPAs)
- 6.3 Market Share Analysis (Market Rank/Share for key companies)
- 6.4 Company Profiles (includes Global level Overview, Market level overview, Core Segments, Financials as available, Strategic Information, Products & Services, and Recent Developments)
- 6.4.1 Energy Absolute PCL
- 6.4.2 Wind Energy Holding Co Ltd
- 6.4.3 Electricity Generating PCL (EGCO)
- 6.4.4 Gulf Energy Development PCL
- 6.4.5 BCPG PCL
- 6.4.6 PTT Public Co Ltd (PTT Renewables)
- 6.4.7 Siam Wind Energy Co Ltd
- 6.4.8 Impact Energy Asia Development
- 6.4.9 Siemens Gamesa Renewable Energy SA
- 6.4.10 Vestas Wind Systems A/S
- 6.4.11 Goldwind Science & Technology Co Ltd
- 6.4.12 GE Vernova
- 6.4.13 Ming Yang Smart Energy
- 6.4.14 Envision Energy
- 6.4.15 Acciona Energia
- 6.4.16 Ratch Group PCL
- 6.4.17 B.Grimm Power PCL
- 6.4.18 Banpu NEXT
- 6.4.19 TruWind Co Ltd
- 6.4.20 WHA Utilities & Power PCL
7 Market Opportunities & Future Outlook
- 7.1 White-space & Unmet-Need Assessment

 2026-2030年全球風力發電市場
 風力發電單樁市場規模、佔有率和成長分析:按單樁類型、水深、基礎直徑、應用、最終用戶和地區分類-2026-2033年產業預測
 義大利風力發電:市場佔有率分析、產業趨勢與統計及成長預測(2026-2031 年)英國風力發電:市場佔有率分析、產業趨勢與統計及成長預測(2026-2031)日本風力發電:市場佔有率分析、產業趨勢與統計及成長預測(2026-2031)美國風力發電:市場佔有率分析、產業趨勢與統計及成長預測(2026-2031)
 2034年離岸風力發電基礎市場預測-以固定式基礎、浮體式基礎、安裝/物流和區域分類的全球分析印度風力發電:市場佔有率分析、產業趨勢與統計及成長預測(2026-2031)
 全球風電市場規模、佔有率、趨勢和成長分析報告(2026-2034年)
 風力發電基礎市場規模、佔有率和成長分析:按基礎類型、渦輪機朝向、安裝類型、應用和地區分類-2026-2033年產業預測