


 |
市場調查報告書
商品編碼
2113656
英國風力發電:市場佔有率分析、產業趨勢與統計及成長預測(2026-2031)United Kingdom Wind Energy - Market Share Analysis, Industry Trends & Statistics, Growth Forecasts (2026 - 2031) |
||||||

※ 本網頁內容可能與最新版本有所差異。詳細情況請與我們聯繫。
根據 Mordor Intelligence 預測,英國風力發電市場預計將從 2025 年的 34.5 吉瓦成長到 2026 年的 39.69 吉瓦,到 2031 年達到 79.94 吉瓦,2026 年至 2031 年的複合年成長率為 15.04%。
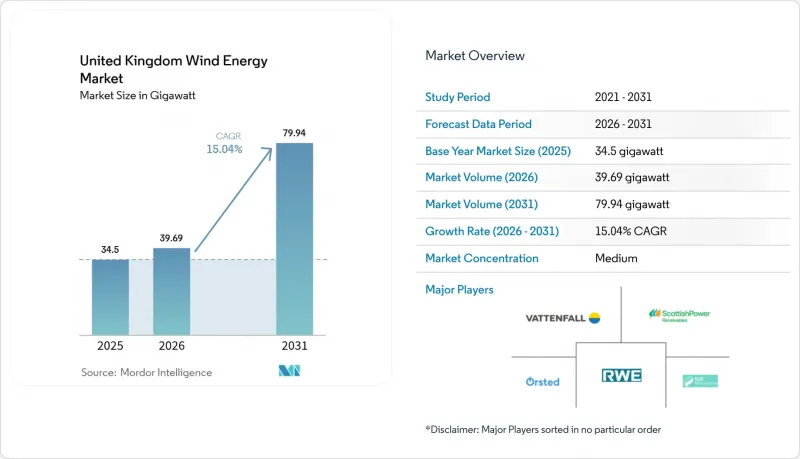
本報告按位置(陸上和海上)、渦輪機功率(小於3兆瓦、3-6兆瓦和大於6兆瓦)和應用(公用事業規模、商業/工業和社區項目)進行細分。市場規模和預測均以裝置容量(吉瓦)為基礎。
英國風力發電市場趨勢與洞察
ScotWind海上租賃工程第三輪快速興建擴建
英國皇家地產公司授予ScotWind公司相關權益,已在17個租賃區域內規劃了一條25吉瓦的裝機容量管道,相關勘測、電網連接和船舶安排工作均已完成。這使得正常的開發週期縮短了約兩年。東安格利亞樞紐2.9吉瓦的建設以及其他第三輪項目正在實現合約整合、提高在地採購率,並在基礎工程和物流方面實現規模經濟。工業成長計畫估計,假設每年新增裝置容量維持在6吉瓦左右,到2035年每年將創造1萬個就業崗位,帶來250億英鎊的經濟價值。然而,Austod公司取消Hornsea 4專案凸顯了製定合理報價和建立穩健供應鏈的必要性。
對運作20年後的早期陸上風力發電進行改造升級。
像哈格肖山這樣的項目,在更換了90年代一半風力發電機的同時,發電量提高了五倍,降低了平準化能源成本(LCOE),並最大限度地減少了新土地的徵用。 Octopus Energy公司計劃維修1000台老舊風力發電,在預先已通過核准的地點新增高達5吉瓦的發電量。與待開發區項目相比,成熟的風力數據、現有社區的支持以及電網容量縮短了前置作業時間。最新的6-8兆瓦平台也提供電網穩定服務,進一步提升了系統的價值。
XXL單樁電纜和高壓直流電纜的供應鏈瓶頸
預計到2029年,歐洲的鋼鐵製造能力僅能滿足70%的需求,光是英國的需求量預計在2025年至2027年間就將達到380萬噸。能夠生產2000噸以上單樁的工廠數量有限,導致價格上漲了40%至50%,前置作業時間也延長至數年。雖然SeAH Wind位於蒂斯賽德的工廠計劃於2026年運作,但將有所幫助,不過也只能略微彌補缺口。高壓直流電纜的供應同樣緊張,這可能導致併網延誤。
細分市場分析
英國陸域風力發電市場預計2025年將達到17.9吉瓦,佔總發電量的51.88%。陸上風力發電電場址和大規模改造項目。例如,100兆瓦的Scoutmoor II計畫就清楚展現了禁令解除後風電規模的擴大。對老舊風力發電叢集改造,可使成熟場址的發電量翻兩番,並充分利用現有的電網接入。
這項政策的推進動能也得益於地方扶持計劃,這些計劃將本地所有權與電費折扣掛鉤,從而簡化了規劃流程。然而,英格蘭北部和蘇格蘭的電網容量正在萎縮,因此,要實現到2030年陸上風力發電翻番至30吉瓦的目標,加強電網建設至關重要。隨著國家電網穩定性市場的日益成熟,數位化預測和靈活的連接方式正在降低發電限制的風險。
預計2025年離岸風電裝置容量將達到16.6吉瓦,到2031年將達到50.03吉瓦,年複合成長率(CAGR)為20.18%。該領域受益於平均容量係數超過50%以及超過1吉瓦項目的模組化特性,提高了資金籌措規模和電力訂單潛力。在專案追蹤中,ScotWind的25吉瓦租賃協議和Celtic Sea的4.5吉瓦浮體式發電工程備受關注。儘管由於單樁和船舶的限制,短期內建設速度有所放緩,但與通膨掛鉤的差價合約(CfD)的行權價格目前更好地反映了資本支出(Capex)的飆升,從而帶動了競標的回升。
其他好處:
- Excel格式的市場預測(ME)表
- 3個月的分析師支持
目錄
第1章:引言
- 研究假設和市場定義
- 調查範圍
第2章:調查方法
第3章執行摘要
第4章 市場狀況
- 市場概覽
- 市場促進因素
- 第三輪以及ScotWind離岸風力發電租賃專案的快速發展
- 對已運作20 年的早期陸上風力發電設施進行改造升級。
- AR6 的最低價格限制,AR6 是一份與 CPI(X) 掛鉤的差價合約 (CfD)。
- 國家電網的「動態服務」改革帶來了電網平衡調整收入。
- 與港口樞紐的綠色氫電解裝置並置
- 人工智慧驅動的預測性維護(運維)可將平準化能源成本降低至低於 40 英鎊/兆瓦時。
- 市場限制因素
- XXL單樁電纜和高壓直流電纜的供應鏈瓶頸
- 由於風景秀麗的高地居民反對,獲得許可的工作被推遲了。
- 英國公債殖利率上升導致資本成本上升
- 經驗豐富的海上安裝船短缺
- 供應鏈分析
- 監理情勢
- 技術展望
- 波特五力模型
- PESTLE分析
第5章 市場規模與成長預測
- 按位置
- 陸上
- 離岸
- 按渦輪機輸出
- 3兆瓦或以下
- 3~6 MW
- 6兆瓦或以上
- 透過使用
- 公用事業規模
- 商業和工業用途
- 社區計畫
- 按成分(定性分析)
- 機艙/渦輪機
- 刀刃
- 塔
- 發電機和齒輪箱
- Balance-of-System
第6章 競爭情勢
- 市場集中度
- 策略趨勢(併購、聯盟、購電協議)
- 市場佔有率分析(主要公司的市場排名和佔有率)
- 公司簡介
- Orsted A/S
- SSE Renewables
- ScottishPower Renewables(Iberdrola)
- RWE Renewables
- Vattenfall AB
- Equinor ASA
- EDF Renewables UK
- RES Group
- Vestas Wind Systems A/S
- Siemens Gamesa Renewable Energy SA
- GE Vernova
- Nordex SE
- Suzlon Energy Ltd
- MingYang Smart Energy
- Goldwind
- CS Wind UK
- JDR Cables
- Fugro
- DEME Offshore
- Cadeler A/S
第7章 市場機會與未來展望
According to Mordor Intelligence, the United Kingdom wind energy market size is expected to grow from 34.5 gigawatt in 2025 to 39.69 gigawatt in 2026 and is forecast to reach 79.94 gigawatt by 2031 at 15.04% CAGR over 2026-2031.
This report is Segmented by Location (Onshore and Offshore), Turbine Capacity (Less Than 3 MW, 3 To 6 MW, and Above 6 MW), and Application (Utility-Scale, Commercial and Industrial, and Community Projects). The Market Size and Forecasts are Provided in Terms of Installed Capacity (GW).
United Kingdom Wind Energy Market Trends and Insights
Rapid build-out of Round 3 and ScotWind offshore lease projects
The Crown Estate's ScotWind awards opened a 25 GW pipeline across 17 leases that already possess surveys, grid links, and vessel bookings, trimming typical development cycles by almost two years. East Anglia Hub's 2.9 GW build and other Round 3 schemes cluster contracts, lift local content, and unlock economies of scale in foundations and logistics. The Industrial Growth Plan estimates 10,000 additional jobs each year and a GBP 25 billion economic value by 2035, assuming annual deployment remains near 6 GW. Yet, Orsted's cancellation of Hornsea 4 underscores the need for realistic strike prices and resilient supply chains.
Repowering of early onshore fleets reaching 20-year life
Projects such as Hagshaw Hill replaced 1990s turbines with half the unit count yet quintupled output, cutting LCOE and minimizing fresh land take. Octopus Energy aims to refurbish 1,000 legacy machines, potentially adding 5 GW on pre-consented footprints. Proven wind data, existing community support, and grid capacity shrink lead times compared with greenfield builds. Modern 6-8 MW platforms also provide grid-formative services, enhancing system value.
Supply-chain bottlenecks in XXL monopiles and HVDC cables
Europe's fabrication capacity is projected to cover only 70% of steel demand by 2029, with the UK's needs alone at 3.8 million tonnes for 2025-2027. Limited plants capable of producing more than 2,000 tons of monopiles drive 40-50% price jumps and multi-year lead times. SeAH Wind's Teesside line, due 2026, helps but fills just a fraction of the gap. HVDC cable slots exhibit similar strain, potentially risking grid connection delays.
Other drivers and restraints analyzed in the detailed report include:
- CfD AR6 price-floors linked to CPI(X)
- Grid-balancing revenues from National Grid's Dynamic Services reform
- Community opposition in scenic highlands delaying permits
For complete list of drivers and restraints, kindly check the Table Of Contents.
Segment Analysis
The UK wind power market size for onshore installations reached 17.9 GW in 2025, accounting for 51.88% of the total capacity. Onshore's cost advantage, rapid build cycle, and revived policy status attract at least six developers exploring fresh English sites and large-scale repowering. Projects such as Scout Moor II, at 100 MW, underscore the scale unlocked after the ban was lifted. Repowering older clusters quadruples capacity on proven ground and capitalizes on existing grid access.
Policy momentum also fuels community support schemes that tie local ownership to bill credits, thereby smoothing the planning process. Yet grid headroom in northern England and Scotland narrows, making reinforcement indispensable to double onshore to the targeted 30 GW by 2030. Digital forecasting and flexible connections mitigate curtailment risk as National Grid's stability markets mature.
Offshore accounted for 16.6 GW in 2025 and is on track for 50.03 GW by 2031, advancing at a 20.18% CAGR. The segment benefits from mean capacity factors above 50% and project modularity above 1 GW, which improves financing scale and export potential. ScotWind's 25 GW leasing and Celtic Sea's 4.5 GW floating awards dominate the project tracker. While monopile and vessel constraints temper near-term build rates, inflation-indexed CfD strike prices now better reflect higher capex, restoring bid appetite.
Complete Report Scope:
- By Location
- On-shore
- Off-shore
- By Turbine Capacity
- Up to 3 MW
- 3 to 6 MW
- Above 6 MW
- By Application
- Utility-scale
- Commercial and Industrial
- Community Projects
- By Component (Qualitative Analysis)
- Nacelle/Turbine
- Blade
- Tower
- Generator and Gearbox
- Balance-of-System
List of Companies Covered in this Report:
- Orsted A/S
- SSE Renewables
- ScottishPower Renewables (Iberdrola)
- RWE Renewables
- Vattenfall AB
- Equinor ASA
- EDF Renewables UK
- RES Group
- Vestas Wind Systems A/S
- Siemens Gamesa Renewable Energy SA
- GE Vernova
- Nordex SE
- Suzlon Energy Ltd
- MingYang Smart Energy
- Goldwind
- CS Wind UK
- JDR Cables
- Fugro
- DEME Offshore
- Cadeler A/S
Additional Benefits:
- The market estimate (ME) sheet in Excel format
- 3 months of analyst support
TABLE OF CONTENTS
1 Introduction
- 1.1 Study Assumptions & Market Definition
- 1.2 Scope of the Study
2 Research Methodology
3 Executive Summary
4 Market Landscape
- 4.1 Market Overview
- 4.2 Market Drivers
- 4.2.1 Rapid build-out of Round 3 & ScotWind offshore lease projects
- 4.2.2 Repowering of early on-shore fleets reaching 20-year life
- 4.2.3 Contract for Difference (CfD) AR6 price-floors linked to CPI(X)
- 4.2.4 Grid-balancing revenues from National Grid's Dynamic Services reform
- 4.2.5 Co-location with green hydrogen electrolysers at port hubs
- 4.2.6 AI-enabled predictive O&M cutting LCOE below £40/MWh
- 4.3 Market Restraints
- 4.3.1 Supply-chain bottlenecks in XXL monopiles & HVDC cables
- 4.3.2 Community opposition in scenic highlands delaying permits
- 4.3.3 Rising cost of capital from higher UK gilt yields
- 4.3.4 Scarcity of experienced offshore installation vessels
- 4.4 Supply-Chain Analysis
- 4.5 Regulatory Landscape
- 4.6 Technological Outlook
- 4.7 Porter's Five Forces
- 4.7.1 Threat of New Entrants
- 4.7.2 Bargaining Power of Suppliers
- 4.7.3 Bargaining Power of Buyers
- 4.7.4 Threat of Substitutes
- 4.7.5 Intensity of Competitive Rivalry
- 4.8 PESTEL Analysis
5 Market Size & Growth Forecasts
- 5.1 By Location
- 5.1.1 On-shore
- 5.1.2 Off-shore
- 5.2 By Turbine Capacity
- 5.2.1 Up to 3 MW
- 5.2.2 3 to 6 MW
- 5.2.3 Above 6 MW
- 5.3 By Application
- 5.3.1 Utility-scale
- 5.3.2 Commercial and Industrial
- 5.3.3 Community Projects
- 5.4 By Component (Qualitative Analysis)
- 5.4.1 Nacelle/Turbine
- 5.4.2 Blade
- 5.4.3 Tower
- 5.4.4 Generator and Gearbox
- 5.4.5 Balance-of-System
6 Competitive Landscape
- 6.1 Market Concentration
- 6.2 Strategic Moves (M&A, Partnerships, PPAs)
- 6.3 Market Share Analysis (Market Rank/Share for key companies)
- 6.4 Company Profiles (includes Global level Overview, Market level overview, Core Segments, Financials as available, Strategic Information, Products & Services, and Recent Developments)
- 6.4.1 Orsted A/S
- 6.4.2 SSE Renewables
- 6.4.3 ScottishPower Renewables (Iberdrola)
- 6.4.4 RWE Renewables
- 6.4.5 Vattenfall AB
- 6.4.6 Equinor ASA
- 6.4.7 EDF Renewables UK
- 6.4.8 RES Group
- 6.4.9 Vestas Wind Systems A/S
- 6.4.10 Siemens Gamesa Renewable Energy SA
- 6.4.11 GE Vernova
- 6.4.12 Nordex SE
- 6.4.13 Suzlon Energy Ltd
- 6.4.14 MingYang Smart Energy
- 6.4.15 Goldwind
- 6.4.16 CS Wind UK
- 6.4.17 JDR Cables
- 6.4.18 Fugro
- 6.4.19 DEME Offshore
- 6.4.20 Cadeler A/S
7 Market Opportunities & Future Outlook
- 7.1 White-space & Unmet-need Assessment

 2026-2030年全球風力發電市場
 風力發電單樁市場規模、佔有率和成長分析:按單樁類型、水深、基礎直徑、應用、最終用戶和地區分類-2026-2033年產業預測
 義大利風力發電:市場佔有率分析、產業趨勢與統計及成長預測(2026-2031 年)日本風力發電:市場佔有率分析、產業趨勢與統計及成長預測(2026-2031)泰國風力發電:市場佔有率分析、產業趨勢與統計及成長預測(2026-2031)美國風力發電:市場佔有率分析、產業趨勢與統計及成長預測(2026-2031)
 2034年離岸風力發電基礎市場預測-以固定式基礎、浮體式基礎、安裝/物流和區域分類的全球分析印度風力發電:市場佔有率分析、產業趨勢與統計及成長預測(2026-2031)
 全球風電市場規模、佔有率、趨勢和成長分析報告(2026-2034年)
 風力發電基礎市場規模、佔有率和成長分析:按基礎類型、渦輪機朝向、安裝類型、應用和地區分類-2026-2033年產業預測