


 |
市場調查報告書
商品編碼
2120522
地理空間分析:市場佔有率分析、產業趨勢與統計、成長預測(2026-2031)Geospatial Analytics - Market Share Analysis, Industry Trends & Statistics, Growth Forecasts (2026 - 2031) |
||||||

※ 本網頁內容可能與最新版本有所差異。詳細情況請與我們聯繫。
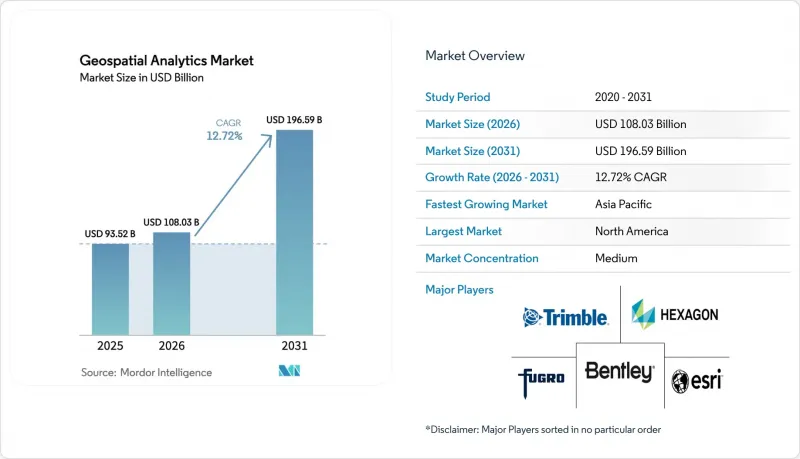
根據 Mordor Intelligence 預測,地理空間分析市場規模將從 2025 年的 935.2 億美元和 2026 年的 1080.3 億美元成長到 2031 年的 1965.9 億美元,2026 年至 2031 年的複合年成長率為 12.72%。
本報告按組件(軟體、服務、硬體)、分析類型(表面分析、網路分析等)、部署模式(本地部署、雲端部署)、最終用戶產業(政府、國防和情報機構、自然資源、公共產業和電信、運輸和物流等)以及地區進行細分。市場預測以美元計價。
全球地理空間分析市場趨勢與洞察
智慧城市計畫的引入
地方政府正在將空間平台整合到交通控制中心、能源網路和緊急指揮中心,使地理空間分析市場成為城市韌性策略的核心組成部分。紐約市的2024年物聯網策略要求所有新建基礎設施項目將空間元資料傳輸到數位孿生模型,以實現對道路、橋樑和水管的預測性維護。英國已撥款4,000萬英鎊(約5,100萬美元)用於2025年的國家地下資產登記系統,以減少公共產業的損壞,這表明相關工作正從先導計畫轉向全市範圍的部署。與資本密集的本地部署硬體相比,訂閱式軟體更受歡迎,因為基於使用量的收費系統與不斷增加的感測器密度相匹配。因此,雲端供應商正在提供捆綁式的地圖、路徑規劃和即時資料流服務,降低了中型城市的進入門檻。由此可見,地理空間分析市場正受益於可預測的市政契約,這些合約提供了長期的收入前景。
整合相容 5G 的定位服務
利用 5G 載波相位測量實現的亞米級定位,消除了都市區「峽谷」中衛星訊號的中斷。 3GPP Release 17 規範引入了完整性指標,以支援安全關鍵型自動駕駛汽車應用。思科預測,到 2027 年,將有 19 億台 5G 設備支援定位服務。 TomTom 已將 5G 資料整合到其「高清即時地圖」中,無需路邊信標即可實現車道級精度。更低的電池消耗和硬體成本正推動其應用範圍從高階智慧型手機擴展到穿戴式裝置和工業感測器。因此,地理空間分析市場對能夠將 5G 定位與衛星和慣性資料結合的 API 的需求日益成長,以確保無處不在的覆蓋範圍。
高成本且營運複雜
即使不計諮詢和資料採集費用,空間資料基礎設施的部署成本通常至少為每年 5 萬美元(多用戶許可)。雖然熟練的製圖師和遙感探測工程師薪資優厚,但這類人才在大都會圈以外地區卻十分稀少。原始衛星影像需要進行輻射定標、大氣校正和正射校正。每個過程都會消耗 GPU 和儲存空間,而這些成本對於中小企業來說難以負擔。預算超支會延遲投資回報,並減緩中型企業採用地理空間分析市場平台的速度。
細分市場分析
儘管軟體在2025年佔據了地理空間分析市場41.32%的佔有率,但預計2026年至2031年間,業務收益將以13.37%的複合年成長率成長。德勤諮詢部門在2025年實現了22%的年成長,這主要得益於客戶對承包氣候風險儀錶板的需求。 Esri的容器化ArcGIS Enterprise 11.4降低了30%的基礎設施成本,並延長了軟體的生命週期。將授權演算法與外包資料工程結合的託管平台正在模糊軟體和服務之間的界線。隨著雲端GPU執行個體取代本地專用工作站,硬體需求趨於停滯。在地理空間分析市場,整合商正在將影像資料訂閱、機器學習模型和資料管道維護捆綁在一起,從而加速了缺乏內部空間分析專業知識的組織的採用。因此,服務繼續發揮推動下游軟體收入成長的作用,為供應商創造了良性循環。
在市場佔有率不斷成長的合約中,包括那些規定與產量提升或燃料成本降低掛鉤的按結果付費的合約。這種轉變使獎勵與客戶的成功掛鉤,從而提高了客戶維繫。 GDAL 和 PostGIS 等開放原始碼庫降低了准入門檻,但客戶仍需要為客製化和支援付費。隨著整合複雜性的增加,諮詢合作夥伴正在組織變革管理研討會,以確保新的分析工作流程能夠牢固地融入日常營運。因此,預計到 2031 年,在地理空間分析市場,更深入的夥伴關係關係將取代一次性的授權合約。
到2025年,地表分析將佔據35.78%的市場佔有率,而網路分析預計到2031年將以13.54%的複合年成長率成長。在最後一公里物流領域,動態路線規劃正被用於減少等待時間,例如UPS透過減少左轉彎,每年節省1000萬加侖燃油。公共產業正在模擬電網的韌性,以確定升級的優先順序,而公共安全機構則在檢驗疏散方案。地表分析正逐漸成為農業和採礦業的主流應用,因為坡度和流域對種植和爆破計畫有顯著的影響。擴增實境(AR)的興起正在推動地理空間視覺化的穩定發展,Bentley的iTwin正在使身臨其境型3D檢視在特定領域普及。同時,空間統計和地理編碼正在為流行病學和位置工作提供支援。因此,儘管地理空間分析市場正根據分析類型而多樣化,但與即時資料流相連的網路演算法仍然是提高投資回報率 (ROI) 的最快促進因素。
對多模態物流日益成長的需求正促使供應商將公路、鐵路、海運和空運網路整合到一個統一的圖中。將橋樑高度和危險品運輸法規等邊緣約束與歷史行程時間數據相結合,可以提高預計到達時間 (ETA) 的準確性。開發人員擴大透過抽象複雜空間連接的 RESTful OGC API 介面呼叫微服務。這種方法透過使計算更靠近數據,加快了採用速度並降低了延遲。因此,各組織不再將網路分析視為可選的附加功能,而是將其視為一項關鍵業務功能,從而進一步提升了其在地理空間分析市場的佔有率。
區域分析
到2025年,北美將佔據地理空間分析市場35.92%的佔有率,這主要得益於國防採購和成熟的智慧城市建設。美國聯合全域指揮與控制計畫正在將智慧定位整合到各軍種中,而L3Harris公司於2024年為偵察機提供了WESCAM MX-25感測器。加拿大聯邦開放資料入口網站將於2025年發布地形和地籍圖層,以促進商業性用途的再利用。墨西哥正在沿海各州部署數位孿生技術進行洪水監測,以加快災害應變速度。隨著更新換代週期逐漸取代新部署,市場成長速度有所放緩,但隨著人工智慧(AI)能力的附加元件,相關支出仍持續穩定成長。
亞太地區預計將成為成長最快的地區,年複合成長率將達到13.76%,主要得益於公共部門的大規模投資。中國的北斗系統預計2025年將擁有15億台活躍設備,並滲透到農業、叫車和緊急服務等領域。印度透過實施其「國家地理空間政策」(將於2024年實施),刺激了私營部門的創新,該政策放寬了高解析度圖像的獲取限制,並強制要求所有部門使用空間元資料。日本已撥款500億日圓(約3.4億美元)用於建造3D城市模型以增強防災能力。韓國和澳洲正在部署智慧城市試點項目,而東南亞國家則在推動土地登記和森林監測的現代化。影像資料價格的下降和智慧型手機普及率的提高正在擴大消費者定位服務,從而拓寬地理空間分析市場的基礎。
歐洲未來的發展取決於監管的協調統一。 《INSPIRE指令》正在促進跨國資料共用,並減少物流和環境應用領域的障礙。在德國,一個整合基礎設施數據的全國性數位孿生模型正在建構中,以適應氣候變遷。英國正在擴大地下測繪範圍,以減少對公共設施的破壞;法國則在資助軍用地球觀測衛星計畫。在沙烏地阿拉伯「2030願景」的引領下,中東各國正在將地理空間圖層整合到所有公共服務入口網站中。在非洲,南非的土地所有權改革和埃及的灌溉規劃都取得了進展。在南美洲,巴西正在利用巴西國家太空研究所(INPE)的衛星監測亞馬遜地區的森林砍伐情況;阿根廷正在實施精密農業計畫。這些努力共同推動了地理空間分析市場的發展,使其不再局限於傳統的以西方為中心的範疇。
其他好處:
- Excel格式的市場預測(ME)表
- 3個月的分析師支持
目錄
第1章:引言
- 研究假設和市場定義
- 調查範圍
第2章:調查方法
第3章執行摘要
第4章 市場狀況
- 市場概覽
- 市場促進因素
- 智慧城市計畫的引入
- 整合相容 5G 的定位服務
- 物聯網衍生空間資料的傳播
- 一個能夠進行高頻成像的小型衛星星系。
- 對超本地化ESG和氣候風險分析的需求
- 用於自動駕駛的即時地理圍欄
- 市場限制因素
- 高成本和營運複雜性
- 法律和隱私障礙
- 人工智慧驅動的空間模型中的數據偏差
- 不同標準之間的互通性
- 產業價值鏈分析
- 技術展望
- 監理情勢
- 宏觀經濟因素對市場的影響
- 波特五力分析
第5章 市場規模與成長預測
- 按組件
- 軟體
- 服務
- 硬體
- 按分析類型
- 表面分析
- 網路分析
- 地理資訊視覺化
- 其他分析類型
- 按部署模式
- 現場
- 雲
- 按最終用戶行業分類
- 政府
- 國防與資訊
- 農業
- 自然資源
- 公共產業及通訊
- 運輸/物流
- 醫療保健和生命科學
- 其他終端用戶產業
- 按地區
- 北美洲
- 美國
- 加拿大
- 墨西哥
- 歐洲
- 德國
- 英國
- 法國
- 俄羅斯
- 其他歐洲國家
- 亞太地區
- 中國
- 日本
- 印度
- 韓國
- 澳洲
- 其他亞太國家
- 中東和非洲
- 中東
- 沙烏地阿拉伯
- 阿拉伯聯合大公國
- 其他中東國家
- 非洲
- 南非
- 埃及
- 其他非洲國家
- 中東
- 南美洲
- 巴西
- 阿根廷
- 其他南美國家
- 北美洲
第6章 競爭情勢
- 市場集中度
- 策略趨勢
- 市佔率分析
- 公司簡介
- Esri Inc.
- Hexagon AB
- Trimble Inc.
- Maxar Technologies Inc.
- Bentley Systems Inc.
- Fugro NV
- L3Harris Technologies Inc.
- Airbus Defence and Space GmbH
- MDA Ltd.
- Atkins PLC
- Intermap Technologies
- Oracle Corporation
- SAP SE
- Google LLC
- Amazon Web Services, Inc.
- Microsoft Corporation
- HERE Technologies
- TomTom NV
- CartoDB Inc.
- Precisely Holdings, LLC
第7章 市場機會與未來展望
According to Mordor Intelligence, the geospatial analytics market size is projected to expand from USD 93.52 billion in 2025 and USD 108.03 billion in 2026 to USD 196.59 billion by 2031, registering a CAGR of 12.72% between 2026 to 2031.
This report is Segmented by Component (Software, Services, and Hardware), Analysis Type (Surface Analysis, Network Analysis, and More), Deployment Model (On-Premises, and Cloud), End-User Vertical (Government, Defense and Intelligence, Natural Resources, Utility and Communication, Transportation and Logistics, and More), and Geography. The Market Forecasts are Provided in Terms of Value (USD).
Global Geospatial Analytics Market Trends and Insights
Smart-City Program Adoption
Municipal agencies integrate spatial platforms into traffic control centers, energy grids, and emergency command rooms, making the geospatial analytics market central to urban resilience strategies. New York City's 2024 IoT Strategy requires every new infrastructure project to stream spatial metadata into a digital twin, enabling predictive maintenance of roads, bridges, and water pipes. The United Kingdom earmarked GBP 40 million (USD 51 million) for the National Underground Asset Register in 2025 to curb utility strikes, signaling a shift from pilot projects to city-wide rollouts. Subscription-based software is preferred over capital-intensive on-premises hardware because consumption-based pricing aligns with growth in sensor density. As a result, cloud vendors bundle mapping, routing, and real-time data streams, lowering entry barriers for mid-size cities. The geospatial analytics market, therefore, benefits from predictable municipal contracts that provide long-term revenue visibility.
Integration of 5G-Enabled Location Services
Sub-meter positioning derived from 5G carrier-phase measurements eliminates satellite dropouts in urban canyons. The 3GPP Release 17 specification introduced integrity metrics that unlock safety-critical autonomous-vehicle applications. Cisco expects 1.9 billion 5G devices to support location-based services by 2027. TomTom integrated 5G data into its HD Live Map, achieving lane-level accuracy without the need for roadside beacons. Lower battery drain and lower hardware costs are widening adoption beyond premium smartphones to wearables and industrial sensors. Consequently, the geospatial analytics market sees rising demand for APIs that fuse 5G positioning with satellite and inertial data to ensure ubiquitous coverage.
High Costs and Operational Complexity
Spatial data infrastructures often start at USD 50,000 per year for multi-user licenses, excluding consulting and data-acquisition fees. Skilled cartographers and remote-sensing engineers command premium salaries, which are scarce outside major metros. Raw satellite imagery requires radiometric calibration, atmospheric correction, and orthorectification. Each step consumes GPUs and storage that smaller firms struggle to afford. Budget overruns postpone returns on investment, slowing the diffusion of geospatial analytics market platforms among mid-tier enterprises.
Other drivers and restraints analyzed in the detailed report include:
- Proliferation of IoT-Derived Spatial Data
- Smallsat Constellations Enabling High-Revisit Imagery
- Legal and Privacy Hurdles
For complete list of drivers and restraints, kindly check the Table Of Contents.
Segment Analysis
Services revenue is projected to grow at a 13.37% CAGR between 2026 and 2031, even though software accounted for 41.32% of the geospatial analytics market share in 2025. Deloitte's consulting arm recorded 22% year-over-year growth in 2025 as clients sought turnkey climate-risk dashboards. Esri's containerized ArcGIS Enterprise 11.4 reduced infrastructure costs by 30% and extended software longevity. Managed platforms that fuse licensed algorithms with outsourced data engineering blur the boundary between software and services. Hardware lags because cloud GPU instances replace specialized on-premise workstations. The geospatial analytics market sees integrators bundling imagery subscriptions, machine-learning models, and data-pipeline maintenance, which accelerates adoption among organizations lacking in-house spatial expertise. Services, therefore, remain the catalyst that unlocks downstream software revenue, nurturing a virtuous cycle for vendors.
A growing share of contracts specifies outcome-based payments tied to yield improvement or fuel savings. This shift aligns vendor incentives with customer success, boosting retention rates. Open-source libraries such as GDAL and PostGIS lower entry barriers, yet clients still pay for customization and support. As integration complexity increases, advisory partners bundle change management workshops to ensure new analytics workflows are embedded in daily operations. Consequently, the geospatial analytics market will likely see deeper partnerships rather than one-off license deals through 2031.
In 2025, surface analysis accounted for 35.78% of the market, while network analysis is projected to grow at a CAGR of 13.54% through 2031. Last-mile logistics exploits dynamic routing to trim idle time; UPS saved 10 million gallons of fuel annually by minimizing left turns. Utilities simulate grid resilience to prioritize upgrades, while public-safety agencies test evacuation scenarios. Surface analysis dominates agriculture and mining, where slope and watersheds drive planting and blasting plans. The rise of augmented reality underpins steady growth in geovisualization, and Bentley's iTwin makes immersive 3D reviews mainstream in niche fields, while spatial statistics and geocoding power epidemiology and site-selection tasks. The geospatial analytics market thus diversifies across analysis types, but network algorithms tied to real-time data streams remain the fastest driver of return on investment.
Demand for multimodal logistics is driving vendors to merge road, rail, sea, and air networks into a unified graph. Combining edge constraints, such as bridge heights or hazardous-cargo rules, with historical travel times improves ETA accuracy. Developers increasingly call microservices over RESTful OGC API interfaces that abstract complex spatial joins. This approach accelerates deployment and keeps compute close to data, improving latency. As a result, organizations view network analysis as a business-critical capability rather than an optional add-on, propelling further share gains inside the geospatial analytics market.
Complete Report Scope:
- By Component
- Software
- Services
- Hardware
- By Analysis Type
- Surface Analysis
- Network Analysis
- Geovisualization
- Other Analysis Types
- By Deployment Model
- On-Premises
- Cloud
- By End-User Vertical
- Government
- Defense and Intelligence
- Agriculture
- Natural Resources
- Utility and Communication
- Transportation and Logistics
- Healthcare and Life Sciences
- Other End-User Verticals
- By Geography
- North America
- United States
- Canada
- Mexico
- Europe
- Germany
- United Kingdom
- France
- Russia
- Rest of Europe
- Asia-Pacific
- China
- Japan
- India
- South Korea
- Australia
- Rest of Asia-Pacific
- Middle East and Africa
- Middle East
- Saudi Arabia
- United Arab Emirates
- Rest of Middle East
- Africa
- South Africa
- Egypt
- Rest of Africa
- Middle East
- South America
- Brazil
- Argentina
- Rest of South America
- North America
Geography Analysis
North America held 35.92% of the geospatial analytics market share in 2025, anchored by defense procurement and mature smart-city deployments. The United States Joint All-Domain Command and Control program embeds location intelligence across services, while L3Harris supplied WESCAM MX-25 sensors for reconnaissance aircraft in 2024. Canada's federal open-data portal released topographic and cadastral layers in 2025, inviting commercial reuse. Mexico equips coastal states with digital twins for flood monitoring to accelerate disaster response. Growth slows as replacement cycles, not first-time deployments, dominate, yet artificial intelligence add-ons sustain incremental spending.
Asia-Pacific is forecast to register a 13.76% CAGR, the fastest regional pace, propelled by massive public-sector investments. China's BeiDou counted 1.5 billion active devices by 2025, permeating agriculture, ride-hailing, and emergency services. India operationalized its National Geospatial Policy in 2024, liberalizing access to high-resolution imagery and mandating spatial metadata across ministries, sparking private innovation. Japan allocated JPY 50 billion (USD 340 million) to 3D city models for disaster readiness. South Korea and Australia roll out smart-city pilots, while Southeast Asian nations modernize land registries and forestry monitoring. Cheaper imagery and wider smartphone penetration expand consumer location-based services, enlarging the geospatial analytics market base.
Europe's trajectory hinges on regulatory harmonization. The INSPIRE Directive drives cross-border data sharing, reducing friction for logistics and environmental apps. Germany's nationwide digital twin integrates infrastructure data for climate adaptation. The United Kingdom extends subsurface mapping to cut utility-strike incidents, while France funds military earth-observation satellites. Middle Eastern countries, led by Saudi Arabia's Vision 2030, embed geospatial layers across all public service portals. Africa sees progress in South Africa's land-tenure reforms and Egypt's irrigation planning. South America leverages Brazil's INPE satellites to police Amazon deforestation, and Argentina deploys precision-farming programs. These initiatives collectively expand the geospatial analytics market beyond its traditional Western core.
- Esri Inc.
- Hexagon AB
- Trimble Inc.
- Maxar Technologies Inc.
- Bentley Systems Inc.
- Fugro NV
- L3Harris Technologies Inc.
- Airbus Defence and Space GmbH
- MDA Ltd.
- Atkins PLC
- Intermap Technologies
- Oracle Corporation
- SAP SE
- Google LLC
- Amazon Web Services, Inc.
- Microsoft Corporation
- HERE Technologies
- TomTom NV
- CartoDB Inc.
- Precisely Holdings, LLC
Additional Benefits:
- The market estimate (ME) sheet in Excel format
- 3 months of analyst support
TABLE OF CONTENTS
1 INTRODUCTION
- 1.1 Study Assumptions and Market Definition
- 1.2 Scope of the Study
2 RESEARCH METHODOLOGY
3 EXECUTIVE SUMMARY
4 MARKET LANDSCAPE
- 4.1 Market Overview
- 4.2 Market Drivers
- 4.2.1 Adoption of Smart-City Programs
- 4.2.2 Integration of 5G-Enabled Location Services
- 4.2.3 Proliferation of IoT-Derived Spatial Data
- 4.2.4 Smallsat Constellations Enabling High-Revisit Imagery
- 4.2.5 Hyper-Local ESG and Climate-Risk Analytics Demand
- 4.2.6 Real-Time Geofencing for Autonomous Operations
- 4.3 Market Restraints
- 4.3.1 High Costs and Operational Complexity
- 4.3.2 Legal and Privacy Hurdles
- 4.3.3 Data-Bias in AI-Driven Spatial Models
- 4.3.4 Interoperability Across Heterogeneous Standards
- 4.4 Industry Value Chain Analysis
- 4.5 Technological Outlook
- 4.6 Regulatory Landscape
- 4.7 Impact of Macroeconomic Factors on the Market
- 4.8 Porter's Five Forces Analysis
- 4.8.1 Threat of New Entrants
- 4.8.2 Bargaining Power of Buyers
- 4.8.3 Bargaining Power of Suppliers
- 4.8.4 Threat of Substitutes
- 4.8.5 Competitive Rivalry
5 MARKET SIZE AND GROWTH FORECASTS (VALUE)
- 5.1 By Component
- 5.1.1 Software
- 5.1.2 Services
- 5.1.3 Hardware
- 5.2 By Analysis Type
- 5.2.1 Surface Analysis
- 5.2.2 Network Analysis
- 5.2.3 Geovisualization
- 5.2.4 Other Analysis Types
- 5.3 By Deployment Model
- 5.3.1 On-Premises
- 5.3.2 Cloud
- 5.4 By End-User Vertical
- 5.4.1 Government
- 5.4.2 Defense and Intelligence
- 5.4.3 Agriculture
- 5.4.4 Natural Resources
- 5.4.5 Utility and Communication
- 5.4.6 Transportation and Logistics
- 5.4.7 Healthcare and Life Sciences
- 5.4.8 Other End-User Verticals
- 5.5 By Geography
- 5.5.1 North America
- 5.5.1.1 United States
- 5.5.1.2 Canada
- 5.5.1.3 Mexico
- 5.5.2 Europe
- 5.5.2.1 Germany
- 5.5.2.2 United Kingdom
- 5.5.2.3 France
- 5.5.2.4 Russia
- 5.5.2.5 Rest of Europe
- 5.5.3 Asia-Pacific
- 5.5.3.1 China
- 5.5.3.2 Japan
- 5.5.3.3 India
- 5.5.3.4 South Korea
- 5.5.3.5 Australia
- 5.5.3.6 Rest of Asia-Pacific
- 5.5.4 Middle East and Africa
- 5.5.4.1 Middle East
- 5.5.4.1.1 Saudi Arabia
- 5.5.4.1.2 United Arab Emirates
- 5.5.4.1.3 Rest of Middle East
- 5.5.4.2 Africa
- 5.5.4.2.1 South Africa
- 5.5.4.2.2 Egypt
- 5.5.4.2.3 Rest of Africa
- 5.5.4.1 Middle East
- 5.5.5 South America
- 5.5.5.1 Brazil
- 5.5.5.2 Argentina
- 5.5.5.3 Rest of South America
- 5.5.1 North America
6 COMPETITIVE LANDSCAPE
- 6.1 Market Concentration
- 6.2 Strategic Moves
- 6.3 Market Share Analysis
- 6.4 Company Profiles (includes Global-Level Overview, Market-Level Overview, Core Segments, Financials as available, Strategic Information, Market Rank/Share for key companies, Products and Services, Recent Developments)
- 6.4.1 Esri Inc.
- 6.4.2 Hexagon AB
- 6.4.3 Trimble Inc.
- 6.4.4 Maxar Technologies Inc.
- 6.4.5 Bentley Systems Inc.
- 6.4.6 Fugro NV
- 6.4.7 L3Harris Technologies Inc.
- 6.4.8 Airbus Defence and Space GmbH
- 6.4.9 MDA Ltd.
- 6.4.10 Atkins PLC
- 6.4.11 Intermap Technologies
- 6.4.12 Oracle Corporation
- 6.4.13 SAP SE
- 6.4.14 Google LLC
- 6.4.15 Amazon Web Services, Inc.
- 6.4.16 Microsoft Corporation
- 6.4.17 HERE Technologies
- 6.4.18 TomTom NV
- 6.4.19 CartoDB Inc.
- 6.4.20 Precisely Holdings, LLC
7 MARKET OPPORTUNITIES AND FUTURE OUTLOOK
- 7.1 White-Space and Unmet-Need Assessment

 中東地理空間分析:市場佔有率分析、產業趨勢與統計、成長預測(2026-2031)法國地理分析:市場佔有率分析、產業趨勢與統計、成長預測(2026-2031)澳新銀行地理空間分析:市場佔有率分析、產業趨勢與統計、成長預測(2026-2031 年)東協地理空間分析:市場佔有率分析、產業趨勢與統計及成長預測(2026-2031)
 地理空間分析市場:2026-2032年全球市場預測(依組件、技術、資料類型、部署模式、組織規模及應用分類)印度地理空間分析:市場佔有率分析、產業趨勢與統計、成長預測(2026-2031)
 2026-2030年全球地理空間分析市場
 地理空間分析市場規模、佔有率和趨勢分析報告:按組件、類型、應用、地區和細分市場預測(2026-2033 年)
 地理空間分析市場規模、佔有率和成長分析:按組件、分析類型、部署模式、最終用戶產業和地區分類-2026-2033年產業預測
 地理空間分析市場報告:按組件、類型、技術、企業規模、部署模式、產業和地區分類(2026-2034 年)