


 |
市場調查報告書
商品編碼
2120450
勞動力管理軟體:市場佔有率分析、行業趨勢和統計數據、成長預測(2026-2031 年)Workforce Management Software - Market Share Analysis, Industry Trends & Statistics, Growth Forecasts (2026 - 2031) |
||||||

※ 本網頁內容可能與最新版本有所差異。詳細情況請與我們聯繫。
根據 Mordor Intelligence 預測,勞動力管理軟體市場將從 2025 年的 93.6 億美元成長到 2026 年的 97.6 億美元,到 2031 年達到 120.4 億美元,2026 年至 2031 年的複合年成長率為 4.29%。
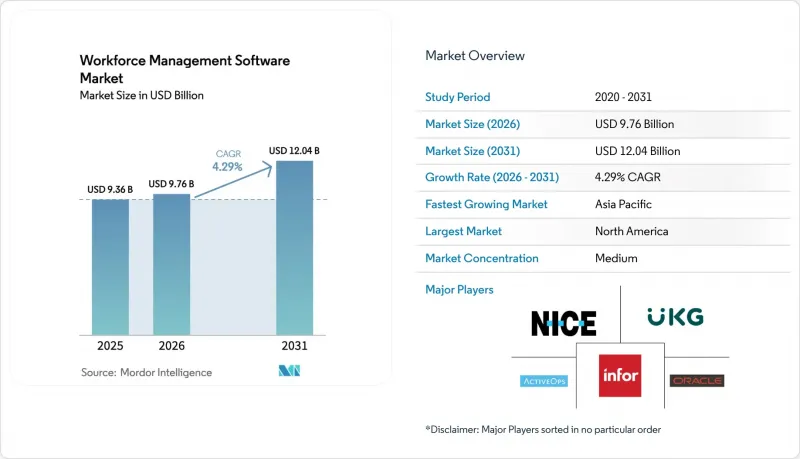
本報告按元件(軟體、服務)、軟體類型(考勤管理、工作安排管理、其他)、部署模式(雲端、本地部署)、組織規模(大型企業、中小企業)、最終用戶產業(銀行、金融服務和保險、消費品和零售、其他)以及地區進行細分。市場預測以美元計價。
全球勞動力管理軟體市場趨勢與洞察
利用人工智慧預測勞動力需求的試點計畫加速了歐盟輪班產業的採用。
歐洲製造商和物流供應商正在利用融合了POS和天氣資料的機器學習模型,將小時工預測的準確率提升15%至20%,遠超傳統的固定模板。 Workday的「技能智慧」功能透過將員薪資品質與輪班要求相匹配,減少了對人力資源公司的依賴。歐盟的《平台勞動指令》要求演算法透明化,迫使供應商建立可審計的排班記錄。德勤2024年的一項調查顯示,在德國、法國和荷蘭,68%採用輪班制的雇主計劃在2025年底前試行人工智慧預測,高於2023年的42%。 SAP和ATOSS等公司正在積極回應,提供符合勞動委員會規定的預測排班功能。目前,競爭壓力超過了對透明度的擔憂,加速了相關解決方案的普及。
「行動優先」工作場所設施管理(WFM)在東南亞多門市零售連鎖店的推廣
在印尼、泰國和越南擁有50至500家門市的零售公司正從桌面系統轉向智慧型手機應用程式,以便管理員能夠在幾分鐘內批准請假申請並發送缺勤通知。根據Telkomsel預測,受員工應用程式的推動,企業行動數據使用量預計將在2024年成長47%。波士頓顧問集團的報告顯示,使用這些應用程式的公司已將排班變更所需時間從48小時縮短至不到4小時,從而提高了應對力。東協數位經濟框架正在降低跨境合規成本,同時該地區72%的執行長將員工生產力列為首要營運重點。 Deputy和Roubler提供的服務價格低於傳統供應商,並提供印尼語和泰語本地化、與薪資核算提供者整合以及更高的服務品質。
德國一家中型製造企業整合傳統MES和ERP系統的成本
許多德國公司仍在運行2000年代初期的西門子SIMATIC或SAP ECC系統,這些系統缺乏現代化的API,導致整合成本高達20萬至50萬歐元(約合22.5萬至56.5萬美元),耗時12至18個月。 [2] 根據SAP 2024年的一項調查,員工人數少於1,000人的製造商中,有62%仍保留著本地部署環境。羅克韋爾自動化的一份報告顯示,47%的受訪者認為整合複雜性是主要障礙,而非成本或安全問題。德國機械設備製造業聯合會(VDMA)的一項調查發現,中型企業的IT預算僅佔其收入的3.2%,這限制了大規模數位化專案的實施。現成的連接器雖然有所幫助,但通常需要客製化,導致持續的手動資料傳輸,並延緩雲端遷移進程。
細分市場分析
預計到2025年,軟體收入將佔總收入的71.34%,主要驅動力是捆綁了排班、考勤管理和分析服務的多年訂閱模式。然而,服務板塊的複合年成長率預計為5.61%,比軟體板塊高出130個基點。這是因為企業需要外部專家來最佳化其人工智慧生成能力。普華永道的一項調查顯示,在人力資源部門實施人工智慧的機構中,有67%需要諮詢服務來建立安全保障機制和培訓員工。領先的系統整合商正在利用這一市場空白,每100萬美元的軟體合約就能帶來100萬至200萬美元的業務收益。如今,託管服務的價格溢價高達20%,這使得中型醫院能夠將合規監控外包出去。
軟體市場仍然強勁,供應商為三年合約提供 10-15% 的折扣,從而穩定了年度經常性收入 (ARR)。隨著人工智慧走出試點階段並得到更廣泛的應用,勞動力管理軟體服務市場正處於更高的成長軌道,確保諮詢項目持續穩定成長。供應商透過將服務合約納入續約談判,來規避客戶流失風險,並在更廣泛的生態系統中留住客戶。
到2025年,考勤管理市佔率將達到29.63%,這主要得益於薪資核算法規的推動;而分析領域到2031年將以6.81%的複合年成長率成長。麥肯錫估計,實施預測模型可以將員工自願離職率降低18%,為擁有1,000名員工的公司節省300萬至500萬美元的成本。目前,71%的首席人力資源長直接向執行長匯報,這提高了公司在董事會層面的可見度,並促使企業加大對分析領域的投資。在人工智慧驅動的模式識別技術進步的支持下,排班軟體的成長速度與勞動力管理軟體市場大致相同。從航空業到採礦業和公共產業,疲勞風險管理工具正被廣泛採用,這反映出安全法規的日益完善。
隨著預測儀錶板成為向財務長匯報的重要元素,分析功能預計將在勞動力管理軟體市場中佔據更大的佔有率。供應商正透過將天氣和社群媒體等外部訊號納入預測,來幫助證明加班預算的合理性,從而實現差異化競爭。
區域分析
北美地區在雲端人才管理的早期應用以及嚴格的記錄保存法規的推動下,預計到2025年將佔全球收入的38.91%。儘管市場成熟度已使成長放緩至3.8%的複合年成長率,但系統更新換代正在推動人工智慧升級。 2024年流入墨西哥的360億美元近岸外包資金將提振雙語解決方案和利潤分享法規遵循的需求。加拿大各省的加班法規正在催生一個針對特定地區的缺勤管理系統的細分市場。
歐洲約佔28%,發展趨勢喜憂參半。英國的《2024年僱傭權利法案》正在加速零售業的系統轉型,而德國的勞動委員會核准程序則阻礙了全端式解決方案的實施。受旅遊業復甦的推動,南歐的複合年成長率達到5.2%,高於歐洲大陸的平均水準。北歐國家擁有較為寬鬆的假期制度,因此需要先進的缺勤管理模組,而這些模組在傳統的全球解決方案套件中一直較為缺乏。
亞太地區是成長最快的地區,複合年成長率達6.17%。印度的540萬IT服務從業人員依賴將專案計費管理與州級合規性結合的解決方案。在日本,預計到2030年將出現640萬的勞動力缺口,這增加了對人工智慧驅動的工作排班管理的需求,尤其是在勞動力老化的情況下。在韓國,每週52小時的工作時長上限要求準確追蹤考勤,這使得整合生物識別考勤系統的供應商受益。在澳洲和紐西蘭,強制性工資稅的徵收帶來了利好,同時也凸顯了依賴電子表格的環境中的合規性挑戰。
南美洲、中東和非洲約佔總銷售額的15%,並以5.5%至6%的複合年成長率成長。在巴西,由於詐欺行為的處罰加大,生物識別的普及率正在上升;海灣合作理事會(GCC)國家醫療床位目標的實現,為最佳化工作安排創造了3億美元的商機。在撒哈拉以南非洲,生物辨識認證的普及主要集中在南非、肯亞和奈及利亞,這些國家使用行動支付來支付工資,以繞過銀行服務覆蓋範圍有限的問題。在寬頻基礎設施不足的大都會區以外地區,離線優先的設計至關重要。
其他福利
- Excel格式的市場預測(ME)表
- 3個月的分析師支持
目錄
第1章:引言
- 研究假設和市場定義
- 調查範圍
第2章:調查方法
第3章執行摘要
第4章 市場狀況
- 市場概覽
- 市場促進因素
- 利用人工智慧預測勞動力需求的試點計畫加速了歐盟輪班產業的採用。
- 「行動優先」工作場所設施管理(WFM)在東南亞多門市零售連鎖店的推廣
- 由於醫療保健工作者短缺,海灣合作理事會正在擴大對基於雲端的勞動力管理的投資。
- 澳洲和紐西蘭強制要求即時申報工資稅,這推動了對整合解決方案的需求不斷成長。
- 南美洲的物流中心正在使用生物識別進行考勤管理,以遏制薪資詐欺。
- 引入生成式人工智慧副駕駛,用於最佳化現場調度。
- 市場限制因素
- 德國一家中型製造企業整合傳統MES和ERP系統的成本
- 中國的資料居住規定限制了外國製造的基於 SaaS 的 WFM 的採用。
- 撒哈拉以南非洲地區寬頻基礎設施不可靠,阻礙了雲端運算的普及。
- 法國工會抗議演算法排班制。
- 產業價值鏈分析
- 監理展望
- 技術展望
- 波特五力分析
- 宏觀經濟因素對市場的影響
- 投資分析(資本流動和創業投資的趨勢)
第5章 市場規模與成長預測
- 按組件
- 軟體
- 服務
- 軟體類型
- 考勤管理
- 工作日程管理
- 勞動力分析
- 缺勤和休假管理
- 疲勞與任務管理
- 部署模式
- 雲
- 現場
- 按組織規模
- 大公司
- 小型企業
- 按最終用途行業分類
- BFSI
- 消費品和零售
- 車
- 能源與公共產業
- 衛生保健
- 製造業
- IT/通訊
- 物流/運輸
- 其他終端用戶產業
- 按地區
- 北美洲
- 美國
- 加拿大
- 墨西哥
- 南美洲
- 巴西
- 阿根廷
- 其他南美國家
- 歐洲
- 英國
- 德國
- 法國
- 西班牙
- 義大利
- 其他歐洲國家
- 亞太地區
- 中國
- 印度
- 日本
- 澳洲
- 韓國
- 其他亞太國家
- 中東和非洲
- 中東
- 沙烏地阿拉伯
- 阿拉伯聯合大公國
- 土耳其
- 其他中東國家
- 非洲
- 南非
- 肯亞
- 其他非洲地區
- 中東
- 北美洲
第6章 競爭情勢
- 市場集中度
- 策略趨勢
- 市佔率分析
- 公司簡介
- ActiveOps PLC
- NICE Ltd.
- Infor Group
- Oracle Corporation
- UKG Inc.
- SAP SE
- ADP LLC
- Blue Yonder Group, Inc.(Panasonic)
- IBM Corporation
- Workday Inc.
- Reflexis Systems Inc.(Zebra)
- SISQUAL Workforce Management, Lda
- ServiceMax Inc.
- Atoss Software AG
- Mitrefinch Ltd(Advanced)
- Deputy Group Pty Ltd
- 7shifts Employee Scheduling Software Inc.
- Sage Group plc
- Roubler Australia Pty Ltd
- tamigo ApS
- Verint Systems Inc.
- ClickSoftware(Salesforce Field Service)
- Ceridian HCM Holding Inc.
- Humanity(TCP Software)
第7章 市場機會與未來展望
According to Mordor Intelligence, the workforce management software market size is expected to increase from USD 9.36 billion in 2025 to USD 9.76 billion in 2026 and reach USD 12.04 billion by 2031, growing at a CAGR of 4.29% over 2026-2031.
This report is Segmented by Component (Software, and Services), Software Type (Time and Attendance Management, Workforce Scheduling, and More), Deployment Mode (Cloud, and On-Premise), Organization Size (Large Enterprises, and Small and Medium Enterprises), End-Use Industry (BFSI, Consumer Goods and Retail, and More), and Geography. The Market Forecasts are Provided in Terms of Value (USD).
Global Workforce Management Software Market Trends and Insights
AI-Driven Labor Forecasting Pilots Accelerate Adoption in EU Shift-Based Industries
European manufacturers and logistics operators utilize machine-learning models that ingest point-of-sale and weather data to enhance hourly labor forecasts by 15-20% compared to static templates. Workday's Skills Intelligence feature matches certifications to shift requirements, reducing dependence on temporary agencies. EU Platform Work Directive provisions require algorithmic transparency, pushing vendors to build auditable scheduling trails. Deloitte's 2024 survey found that 68% of shift-based employers in Germany, France, and the Netherlands plan to pilot AI forecasting by the end of 2025, up from 42% in 2023. SAP and ATOSS respond by bundling predictive scheduling compliant with works council rights. Competitive pressure now outweighs transparency concerns, accelerating the roll-out of solutions.
Mobile-First WFM Penetration in Southeast Asian Multi-Site Retail Chains
Retailers with 50-500 stores across Indonesia, Thailand, and Vietnam are abandoning desktop systems for smartphone apps that enable managers to approve leave and broadcast callouts in minutes. Telkomsel cited 47% growth in enterprise mobile data in 2024, driven by workforce applications. Boston Consulting Group reported that schedule-change cycle times fell from 48 hours to under 4 hours among adopters, improving responsiveness during Ramadan and Lunar New Year. The ASEAN Digital Economy Framework reduces cross-border compliance costs, while 72% of regional CEOs rank workforce productivity as the top operational priority. Deputy and Roubler localize Bahasa Indonesia and Thai, integrate with payroll providers, and undercut legacy vendors on price.
Legacy MES/ERP Integration Costs among German Mittelstand Manufacturers
Many German firms still run Siemens SIMATIC or SAP ECC from early 2000s vintages that lack modern APIs, incurring EUR 200,000-500,000 (USD 225,000-565,000) in integration bills and 12-18 month timelines.[2] SAP's 2024 survey noted 62% of sub-1,000-employee manufacturers remain on-premise. Rockwell Automation reported that 47% cited integration complexity as the key barrier, over cost and security. VDMA found Mittelstand IT budgets average just 3.2% of revenue, limiting large-scale digital projects. Pre-built connectors help, but often require customization, which sustains manual data transfer and slows cloud migration.
Other drivers and restraints analyzed in the detailed report include:
- GCC Healthcare Staffing Shortages Spur Cloud-Based WFM Investments
- Real-Time Payroll Tax Reporting Mandates in Australia and New Zealand
- China's Data Residency Rules Limiting Foreign SaaS WFM Deployments
For complete list of drivers and restraints, kindly check the Table Of Contents.
Segment Analysis
Software represented 71.34% of revenue in 2025, primarily driven by multi-year subscriptions that bundle scheduling, time and attendance, and analytics services. Services, however, are growing 130 basis points faster at a 5.61% CAGR because enterprises need outside experts to fine-tune generative AI features. PwC found 67% of organizations deploying AI in HR required consulting to set guardrails and train staff. Large integrators capitalize on this gap, earning USD 1-2 million in services for every USD 0.5 million in software deals. Managed services now command a 20% premium, allowing mid-size hospitals to outsource compliance monitoring.
Software growth remains solid as vendors offer 10-15% discounts on three-year agreements, stabilizing annual recurring revenue. The workforce management software market size for services is on a higher trajectory as AI spreads beyond pilots, ensuring consultant pipelines remain full. Vendors hedge churn risk by stitching services into renewal discussions, locking customers into broader ecosystems.
Time and attendance accounted for a 29.63% share in 2025, driven by payroll statutes; however, analytics led to growth at a 6.81% CAGR through 2031. McKinsey estimated predictive models cut voluntary turnover 18%, saving USD 3-5 million for a 1,000-employee firm. As 71% of CHROs now report directly to CEOs, board-level visibility drives increased analytics spending. Scheduling software grows roughly in line with the workforce management software market, aided by AI pattern recognition. Fatigue-risk tools are being adopted from aviation into mining and utilities, reflecting broader safety mandates.
The workforce management software market share for analytics is expected to increase as predictive dashboards become a table stake in CFO presentations. Vendors differentiate themselves by incorporating external signals, such as weather and social media, into forecasts that help justify overtime budgets.
Complete Report Scope:
- By Component
- Software
- Services
- By Software Type
- Time and Attendance Management
- Workforce Scheduling
- Workforce Analytics
- Absence and Leave Management
- Fatigue and Task Management
- By Deployment Mode
- Cloud
- On-Premise
- By Organization Size
- Large Enterprises
- Small and Medium Enterprises
- By End-Use Industry
- BFSI
- Consumer Goods and Retail
- Automotive
- Energy and Utilities
- Healthcare
- Manufacturing
- IT and Telecommunications
- Logistics and Transportation
- Other End-Use Industries
- By Geography
- North America
- United States
- Canada
- Mexico
- South America
- Brazil
- Argentina
- Rest of South America
- Europe
- United Kingdom
- Germany
- France
- Spain
- Italy
- Rest of Europe
- Asia Pacific
- China
- India
- Japan
- Australia
- South Korea
- Rest of Asia Pacific
- Middle East and Africa
- Middle East
- Saudi Arabia
- United Arab Emirates
- Turkey
- Rest of Middle East
- Africa
- South Africa
- Kenya
- Rest of Africa
- Middle East
- North America
Geography Analysis
North America accounted for 38.91% of the 2025 revenue, driven by early adoption of cloud human capital management and stringent record-keeping laws. Market maturity tempers growth to 3.8% CAGR, yet replacement cycles spur AI upgrades. Mexico's USD 36 billion near-shoring inflows in 2024 boost bilingual solution demand and profit-sharing compliance. Canada's provincial overtime rules drive niches for region-specific absence trackers.
Europe contributed about 28% and shows mixed dynamics. The U.K.'s 2024 Employment Rights Bill accelerates retail conversions, while Germany's works council approvals slow full-stack rollouts. Southern Europe outpaces continental averages at 5.2% CAGR as tourism rebounds. Nordic countries, with their generous leave policies, require sophisticated absence management modules that global suites have historically lacked.
The Asia Pacific is the fastest-growing territory, with a 6.17% CAGR. India's 5.4 million IT-services workforce relies on solutions that combine project billing and state-wise compliance. Japan's projected 6.4 million labor deficit by 2030 drives the need for AI scheduling among aging staff. South Korea's 52-hour cap enforces precise time tracking, benefiting vendors integrated with biometric clocks. Australia and New Zealand see tailwinds from payroll-tax mandates that expose compliance gaps in spreadsheet-driven environments.
South America, the Middle East and Africa comprise roughly 15% of revenue but expand at 5.5-6% CAGR. Brazil's tougher fraud penalties spur biometric adoption, while GCC healthcare bed targets create a USD 300 million opportunity for roster optimization. Sub-Saharan Africa adoption centers on South Africa, Kenya, and Nigeria where mobile-money pay runs circumvent limited banking access. Poor broadband outside capitals means offline-first design is non-negotiable.
- ActiveOps PLC
- NICE Ltd.
- Infor Group
- Oracle Corporation
- UKG Inc.
- SAP SE
- ADP LLC
- Blue Yonder Group, Inc. (Panasonic)
- IBM Corporation
- Workday Inc.
- Reflexis Systems Inc. (Zebra)
- SISQUAL Workforce Management, Lda
- ServiceMax Inc.
- Atoss Software AG
- Mitrefinch Ltd (Advanced)
- Deputy Group Pty Ltd
- 7shifts Employee Scheduling Software Inc.
- Sage Group plc
- Roubler Australia Pty Ltd
- tamigo ApS
- Verint Systems Inc.
- ClickSoftware (Salesforce Field Service)
- Ceridian HCM Holding Inc.
- Humanity (TCP Software)
Additional Benefits:
- The market estimate (ME) sheet in Excel format
- 3 months of analyst support
TABLE OF CONTENTS
1 INTRODUCTION
- 1.1 Study Assumptions and Market Definition
- 1.2 Scope of the Study
2 RESEARCH METHODOLOGY
3 EXECUTIVE SUMMARY
4 MARKET LANDSCAPE
- 4.1 Market Overview
- 4.2 Market Drivers
- 4.2.1 AI-Driven Labor Forecasting Pilots Accelerate Adoption in EU Shift-Based Industries
- 4.2.2 Mobile-First WFM Penetration in Southeast Asian Multi-Site Retail Chains
- 4.2.3 GCC Healthcare Staffing Shortages Spur Cloud-Based WFM Investments
- 4.2.4 Real-Time Payroll Tax Reporting Mandates in Australia and New Zealand Boost Integrated Suites
- 4.2.5 Biometric Time and Attendance to Curb Payroll Fraud in South American Logistics Hubs
- 4.2.6 Adoption of Generative AI Copilots for Frontline Scheduling Optimization
- 4.3 Market Restraints
- 4.3.1 Legacy MES/ERP Integration Costs among German Mittelstand Manufacturers
- 4.3.2 China's Data Residency Rules Limiting Foreign SaaS WFM Deployments
- 4.3.3 Unreliable Broadband Infrastructure Hindering Cloud Adoption in Sub-Saharan Africa
- 4.3.4 French Union Pushback Against Algorithmic Shift Scheduling
- 4.4 Industry Value Chain Analysis
- 4.5 Regulatory Outlook
- 4.6 Technological Outlook
- 4.7 Porter's Five Forces Analysis
- 4.7.1 Threat of New Entrants
- 4.7.2 Bargaining Power of Buyers
- 4.7.3 Bargaining Power of Suppliers
- 4.7.4 Threat of Substitutes
- 4.7.5 Intensity of Competitive Rivalry
- 4.8 Impact of Macroeconomic Factors on the Market
- 4.9 Investment Analysis (Capital Flow and VC Funding Trends)
5 MARKET SIZE AND GROWTH FORECASTS (VALUES)
- 5.1 By Component
- 5.1.1 Software
- 5.1.2 Services
- 5.2 By Software Type
- 5.2.1 Time and Attendance Management
- 5.2.2 Workforce Scheduling
- 5.2.3 Workforce Analytics
- 5.2.4 Absence and Leave Management
- 5.2.5 Fatigue and Task Management
- 5.3 By Deployment Mode
- 5.3.1 Cloud
- 5.3.2 On-Premise
- 5.4 By Organization Size
- 5.4.1 Large Enterprises
- 5.4.2 Small and Medium Enterprises
- 5.5 By End-Use Industry
- 5.5.1 BFSI
- 5.5.2 Consumer Goods and Retail
- 5.5.3 Automotive
- 5.5.4 Energy and Utilities
- 5.5.5 Healthcare
- 5.5.6 Manufacturing
- 5.5.7 IT and Telecommunications
- 5.5.8 Logistics and Transportation
- 5.5.9 Other End-Use Industries
- 5.6 By Geography
- 5.6.1 North America
- 5.6.1.1 United States
- 5.6.1.2 Canada
- 5.6.1.3 Mexico
- 5.6.2 South America
- 5.6.2.1 Brazil
- 5.6.2.2 Argentina
- 5.6.2.3 Rest of South America
- 5.6.3 Europe
- 5.6.3.1 United Kingdom
- 5.6.3.2 Germany
- 5.6.3.3 France
- 5.6.3.4 Spain
- 5.6.3.5 Italy
- 5.6.3.6 Rest of Europe
- 5.6.4 Asia Pacific
- 5.6.4.1 China
- 5.6.4.2 India
- 5.6.4.3 Japan
- 5.6.4.4 Australia
- 5.6.4.5 South Korea
- 5.6.4.6 Rest of Asia Pacific
- 5.6.5 Middle East and Africa
- 5.6.5.1 Middle East
- 5.6.5.1.1 Saudi Arabia
- 5.6.5.1.2 United Arab Emirates
- 5.6.5.1.3 Turkey
- 5.6.5.1.4 Rest of Middle East
- 5.6.5.2 Africa
- 5.6.5.2.1 South Africa
- 5.6.5.2.2 Kenya
- 5.6.5.2.3 Rest of Africa
- 5.6.5.1 Middle East
- 5.6.1 North America
6 COMPETITIVE LANDSCAPE
- 6.1 Market Concentration
- 6.2 Strategic Moves
- 6.3 Market Share Analysis
- 6.4 Company Profiles (includes Global-Level Overview, Market-Level Overview, Core Segments, Financials, Strategic Information, Market Rank/Share, Products and Services, Recent Developments)
- 6.4.1 ActiveOps PLC
- 6.4.2 NICE Ltd.
- 6.4.3 Infor Group
- 6.4.4 Oracle Corporation
- 6.4.5 UKG Inc.
- 6.4.6 SAP SE
- 6.4.7 ADP LLC
- 6.4.8 Blue Yonder Group, Inc. (Panasonic)
- 6.4.9 IBM Corporation
- 6.4.10 Workday Inc.
- 6.4.11 Reflexis Systems Inc. (Zebra)
- 6.4.12 SISQUAL Workforce Management, Lda
- 6.4.13 ServiceMax Inc.
- 6.4.14 Atoss Software AG
- 6.4.15 Mitrefinch Ltd (Advanced)
- 6.4.16 Deputy Group Pty Ltd
- 6.4.17 7shifts Employee Scheduling Software Inc.
- 6.4.18 Sage Group plc
- 6.4.19 Roubler Australia Pty Ltd
- 6.4.20 tamigo ApS
- 6.4.21 Verint Systems Inc.
- 6.4.22 ClickSoftware (Salesforce Field Service)
- 6.4.23 Ceridian HCM Holding Inc.
- 6.4.24 Humanity (TCP Software)
7 MARKET OPPORTUNITIES AND FUTURE OUTLOOK
- 7.1 White-Space and Unmet-Need Assessment

 勞動力追蹤軟體市場分析及預測(至2035年):依類型、產品、服務、技術、組件、應用、部署模式、最終用戶、模組及功能分類
 神經多樣性勞動力管理市場預測至2034年—按管理解決方案、人才管理職能、支援職能、人才分析、最終用戶和地區分類的全球分析
 中東和非洲(MEA)勞動力管理軟體:市場佔有率分析、行業趨勢和統計數據以及成長預測(2026-2031 年)物流人力資源管理軟體:市場佔有率分析、產業趨勢與統計、成長預測(2026-2031)歐洲勞動力管理軟體:市場佔有率分析、產業趨勢與統計及成長預測(2026-2031 年)
 勞動力管理軟體市場:按組件、部署類型、組織規模和產業分類-2026-2032年全球市場預測
 2026年全球員工敬業度管理領域的成長機會
 2026-2030年全球人力資源管理軟體市場旅館業勞動力管理(WFM):市場佔有率分析、產業趨勢與統計、成長預測(2026-2031)臨時勞動力管理平台:市場佔有率分析、產業趨勢與統計、成長預測(2026-2031)