


 |
市場調查報告書
商品編碼
2120371
北美汽車市場:市場佔有率分析、產業趨勢與統計、成長預測(2026-2031)North America Automotive - Market Share Analysis, Industry Trends & Statistics, Growth Forecasts (2026 - 2031) |
||||||

※ 本網頁內容可能與最新版本有所差異。詳細情況請與我們聯繫。
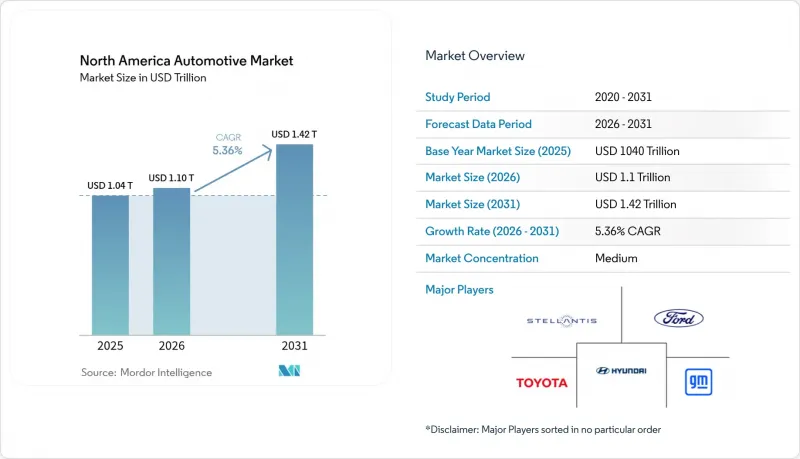
據 Mordor Intelligence 稱,2025 年北美汽車市值為 1.04 兆美元,預計到 2031 年將達到 1.4222 兆美元,而 2026 年為 1.0957 兆美元,預測期(2026-2031 年)的複合成長率為 5.36%。
本報告按車輛類型(乘用車、輕型商用車等)、驅動方式(內燃機等)、銷售管道(OEM自有經銷商等)、自動化等級(0-1級、2級、3級、4-5級)和國家(美國、加拿大、北美等)進行細分。市場預測以價值(美元)和銷售(輛)表示。
北美汽車市場趨勢與洞察
聯邦和州零排放車輛法規
加州的「先進清潔汽車II」法規規定,到2026年,零排放汽車的銷售量必須佔總銷售量的35%,到2035年必須達到100%。其他11個州和華盛頓特區也採用了類似的計畫。加拿大的聯邦零排放汽車法規也設定了2035年的最後期限,並制定了2026年和2030年的中期目標,分別為20%和60%。美國環保署(EPA)提案的法規要求,到2030年,中型和重型卡車的零排放銷售量必須佔總銷售量的30%,到2040年必須達到100%。信用銀行機制將使早期採用者能夠享受合規的好處,而落後者將面臨更嚴厲的處罰。因此,這個法律規範將鼓勵北美汽車市場所有參與企業積極投資電氣化,並加速供應商的重組。
“自動陣列”電池的定位
截至2023年底,北美電池供應鏈的累計投資超過2,500億美元,電池工廠距離最終組裝廠的平均距離為284英里。約一半的投資用於電池製造,其餘部分則平均分配於上游礦物加工和下游電動車組裝。加拿大憑藉本田投資150億加元的綜合工廠(計劃於2028年運作)躍居鋰離子電池供應鏈排名榜首。墨西哥的類似項目,例如寶馬在聖路易斯波托西投資8億美元的擴建項目,確保了具有成本競爭力的產能,同時維持了美墨加協定(USMCA)的貿易合格。這種區域集中的叢集有助於降低整個北美汽車市場的物流成本和關稅風險。
由於價格飆升,購車困難
創紀錄的汽車價格已將平均月供推至歷史高位,令許多普通購車者望而卻步。儘管政府加大了獎勵力度,但利潤空間依然被壓縮,汽車價格也未能恢復到可負擔的水平。自2023年以來,租賃成本飆升,消費者紛紛轉向二手車。對於電池式電動車(BEV)車型而言,這種困境尤其嚴重,因為對許多家庭來說,高昂的初始成本遠遠超過了其生命週期成本的節省。雖然利率下調的預期是一個利好因素,但價格敏感度仍將限制北美汽車市場短期內的銷售成長。
細分市場分析
儘管中型和重型商用車的絕對銷量可能較小,但預計到2031年,其複合年成長率將達到8.22%,增速顯著超過乘用車在北美汽車市場的主導地位。加州的《先進清潔卡車法規》和美國環保署(EPA)的提案等監管措施旨在2040年實現卡車銷售100%零排放。車隊採購商正在積極擁抱電氣化,因為電氣化具有集中充電和可預測運作週期的優勢。
到2025年,乘用車仍將佔總銷售量的68.63%,但它們面臨價格壓力和不斷上漲的合規成本。改造工廠設施,使其能夠柔軟性處理多種動力傳動系統,將使製造商能夠根據需求波動調整產量。到2035年,隨著零排放卡車的總擁有成本(TCO)達到相同水平,投資將進一步轉向商用領域,從而進一步鞏固北美汽車市場這一細分領域的結構性成長。
預計到 2025 年,內燃機動力傳動系統將佔據 82.11% 的市場佔有率,而電池式電動車(BEV) 的市場佔有率預計將以 9.58% 的複合年成長率成長,這得益於高達 7,500 美元的清潔車輛稅額扣抵。混合動力汽車正在發揮過渡作用,福特報告稱,2024 年混合動力汽車的銷量將實現兩位數成長。
插電式混合動力汽車為長途駕駛者提供了更長的續航里程,同時也滿足了部分電氣化的需求。由於氫基礎設施的匱乏,燃料電池汽車仍然是一個小眾市場。動力系統的多元化使汽車製造商能夠降低資本配置風險,同時擴展對不斷發展的北美汽車市場至關重要的電池和軟體平台。
其他好處:
- Excel格式的市場預測(ME)表
- 3個月的分析師支持
目錄
第1章:引言
- 研究假設和市場定義
- 調查範圍
第2章:調查方法
第3章執行摘要
第4章 市場狀況
- 市場概覽
- 市場促進因素
- 聯邦和州政府的零能耗汽車(ZEV)強制規定
- 汽車貸款利率降低和需求受到抑制
- 由NEVI資助的電動車充電基礎設施建設
- 輕型卡車和SUV構成比的變化正在提高利潤率。
- “自動陣列”電池的定位
- 軟體定義車輛(SDV)的收入模式
- 市場限制因素
- 購車負擔加重
- 半導體和電池用礦物供應瓶頸
- 圍繞美墨加協定審查的關稅問題,各方展開了邊緣政策博弈
- 尖峰時段「排隊收費」引發擔憂
- 價值供應鏈分析
- 監理情勢
- 技術展望
- 波特五力模型
第5章 市場規模與成長預測
- 車輛類型
- 搭乘用車
- 輕型商用車
- 中型和大型商用車輛
- 摩托車
- 透過驅動系統
- 內燃機(ICE)
- 混合動力電動車(HEV)
- 插電式混合動力汽車(PHEV)
- 電池式電動車(BEV)
- 燃料電池汽車(FCEV)
- 天然氣汽車(NGV)
- 按銷售管道
- 透過OEM廠商和授權經銷商銷售
- 直接面對消費者(線上)
- 車隊和租賃銷售
- 按自動化級別
- 0-1級(基礎/無ADAS)
- 二級(部分自動化)
- 3級(條件自動化)
- 4-5級(高級/全自動)
- 國家
- 美國
- 加拿大
- 其他北美國家
第6章 競爭情勢
- 市場集中度
- 策略趨勢
- 市佔率分析
- 公司簡介
- General Motors Company
- Toyota Motor Corporation
- Ford Motor Company
- Stellantis NV
- Hyundai Motor Company
- Honda Motor Co., Ltd.
- Nissan Motor Co., Ltd.
- BMW AG
- Tesla, Inc.
- Volkswagen AG
- Mercedes-Benz Group AG
- Kia Corporation
- Subaru Corporation
- Mazda Motor Corporation
- Rivian Automotive, Inc.
- Lucid Group, Inc.
- BYD Company Ltd.
- Volvo Car Corporation
- Mitsubishi Motors Corporation
- Daimler Truck Holding AG
- PACCAR Inc.
- Navistar International Corp.
- Harley-Davidson, Inc.
- Yamaha Motor Co., Ltd.
第7章 市場機會與未來展望
According to Mordor Intelligence, the North America automotive market size was valued at USD 1040 billion in 2025 and estimated to grow from USD 1095.7 billion in 2026 to reach USD 1422.2 billion by 2031, at a CAGR of 5.36% during the forecast period (2026-2031).
This report is Segmented by Vehicle Type (Passenger Cars, Light Commercial Vehicles, and More), Propulsion Type (ICE, and More), Sales Channel (OEM-Franchised Dealer, and More), Level of Automation (Level 0-1, Level 2, Level 3, and Level 4-5), and Country (United States, Canada, Rest of North America). The Market Forecasts are Provided in Terms of Value (USD) and Volume in Units.
North America Automotive Market Trends and Insights
Federal and State ZEV Mandates
California's Advanced Clean Cars II regulation requires 35% zero-emission sales by 2026 and 100% by 2035; eleven additional states and Washington, D.C. have adopted identical timelines. Canada's federal ZEV rule mirrors the 2035 deadline with interim 20% and 60% milestones for 2026 and 2030, respectively. Proposed U.S. EPA limits push 30% zero-emission medium- and heavy-truck sales by 2030, rising to 100% by 2040. Credit banking lets early movers monetize compliance, whereas laggards face increasing penalties. The mandate architecture, therefore, rewards proactive electrification investments and accelerates supplier realignment across North America automotive market participants.
Battery "Auto-Alley" Localization
Cumulative North American battery supply-chain commitments topped USD 250 billion by end-2023, with cell plants positioned a median 284 miles from final assembly sites. Cell fabrication absorbs roughly half of the outlays, with upstream mineral processing and downstream EV assembly splitting the remainder. Canada rose first in the lithium-ion supply-chain ranking, buoyed by Honda's CAD 15 billion integrated complex slated for 2028. Parallel Mexican projects, such as BMW's USD 800 million San Luis Potosi expansion, secure cost-competitive capacity while preserving USMCA trade eligibility. Localized clusters mitigate logistics expense and tariff risk across the North America automotive market.
Vehicle Affordability Squeeze
Record transaction prices have pushed average monthly payments to historic highs, sidelining a swath of mainstream buyers. Rising incentives strain margins yet fail to restore affordability. Leasing costs have climbed sharply since 2023, nudging consumers toward used-vehicle substitutes. The pinch is most acute for battery-electric models whose upfront premiums outweigh lifetime savings for many households. Although falling interest-rate expectations offer relief, price sensitivity will cap near-term volume upside in the North America automotive market.
Other drivers and restraints analyzed in the detailed report include:
- NEVI-Funded EV-Charging Build-Out
- Software-Defined-Vehicle Revenue Model
- Peak-Hour "Charging-Queue" Anxiety
For complete list of drivers and restraints, kindly check the Table Of Contents.
Segment Analysis
Medium-and heavy-commercial vehicles, though smaller in absolute volume, expand at 8.22% CAGR through 2031, materially outpacing passenger cars' dominion in the North American automotive market. A regulatory push-California's Advanced Clean Trucks rule and U.S. EPA proposals-targets 100% zero-emission truck sales by 2040. Fleet buyers embrace electrification, where charging can be centralized and duty cycles predictable.
Passenger cars still anchor 68.63% 2025 revenue but contend with affordability pressures and rising compliance outlays. Plant retooling for multi-powertrain flexibility enables manufacturers to modulate output amid shifting demand. Total cost-of-ownership parity for zero-emission trucks by 2035 will further tilt investment toward commercial applications, reinforcing structural growth in this segment of the North America automotive market.
Internal-combustion powertrains command an 82.11% share in 2025; however, battery-electric vehicles will capture incremental gains at 9.58% CAGR, supported by up to USD 7,500 clean-vehicle tax credits. Hybrid models act as a bridge technology, with Ford reporting double-digit hybrid sales gains in 2024.
Plug-in hybrids provide range assurance for long-distance drivers while meeting partial electrification quotas. Fuel-cell offerings remain niche, limited by hydrogen infrastructure gaps. Propulsion diversification allows OEMs to de-risk capital allocation while scaling batteries and software platforms central to the evolving North America automotive market size.
Complete Report Scope:
- By Vehicle Type
- Passenger Cars
- Light Commercial Vehicles
- Medium & Heavy Commercial Vehicles
- Two-Wheelers
- By Propulsion Type
- Internal Combustion Engine (ICE)
- Hybrid Electric Vehicles (HEV)
- Plug-in Hybrid Vehicles (PHEV)
- Battery Electric Vehicles (BEV)
- Fuel-Cell Electric Vehicles (FCEV)
- Natural-Gas Vehicles (NGV)
- By Sales Channel
- OEM-Franchised Dealer Sales
- Direct-to-Consumer (Online)
- Fleet and Rental Sales
- By Level of Automation (Value)
- Level 0 - 1 (Basic / No ADAS)
- Level 2 (Partial Automation)
- Level 3 (Conditional Automation)
- Level 4 - 5 (High / Full Automation)
- By Country
- United States
- Canada
- Rest of North America
List of Companies Covered in this Report:
- General Motors Company
- Toyota Motor Corporation
- Ford Motor Company
- Stellantis N.V.
- Hyundai Motor Company
- Honda Motor Co., Ltd.
- Nissan Motor Co., Ltd.
- BMW AG
- Tesla, Inc.
- Volkswagen AG
- Mercedes-Benz Group AG
- Kia Corporation
- Subaru Corporation
- Mazda Motor Corporation
- Rivian Automotive, Inc.
- Lucid Group, Inc.
- BYD Company Ltd.
- Volvo Car Corporation
- Mitsubishi Motors Corporation
- Daimler Truck Holding AG
- PACCAR Inc.
- Navistar International Corp.
- Harley-Davidson, Inc.
- Yamaha Motor Co., Ltd.
Additional Benefits:
- The market estimate (ME) sheet in Excel format
- 3 months of analyst support
TABLE OF CONTENTS
1 Introduction
- 1.1 Study Assumptions and Market Definition
- 1.2 Scope of the Study
2 Research Methodology
3 Executive Summary
4 Market Landscape
- 4.1 Market Overview
- 4.2 Market Drivers
- 4.2.1 Federal and State ZEV Mandates
- 4.2.2 Falling Auto-Loan Rates and Pent-Up Demand
- 4.2.3 NEVI-Funded EV-Charging Build-Out
- 4.2.4 Light-Truck/SUV Mix Shift Lifts Margins.
- 4.2.5 Battery "Auto-Alley" Localization
- 4.2.6 Software-Defined-Vehicle Revenue Model
- 4.3 Market Restraints
- 4.3.1 Vehicle Affordability Squeeze
- 4.3.2 Chip and Battery-Grade Mineral Bottlenecks
- 4.3.3 Tariff Brinkmanship Under USMCA Review
- 4.3.4 Peak-Hour "Charging-Queue" Anxiety
- 4.4 Value / Supply-Chain Analysis
- 4.5 Regulatory Landscape
- 4.6 Technological Outlook
- 4.7 Porter's Five Forces
- 4.7.1 Threat of New Entrants
- 4.7.2 Bargaining Power of Buyers
- 4.7.3 Bargaining Power of Suppliers
- 4.7.4 Threat of Substitutes
- 4.7.5 Intensity of Competitive Rivalry
5 Market Size and Growth Forecasts
- 5.1 By Vehicle Type
- 5.1.1 Passenger Cars
- 5.1.2 Light Commercial Vehicles
- 5.1.3 Medium & Heavy Commercial Vehicles
- 5.1.4 Two-Wheelers
- 5.2 By Propulsion Type
- 5.2.1 Internal Combustion Engine (ICE)
- 5.2.2 Hybrid Electric Vehicles (HEV)
- 5.2.3 Plug-in Hybrid Vehicles (PHEV)
- 5.2.4 Battery Electric Vehicles (BEV)
- 5.2.5 Fuel-Cell Electric Vehicles (FCEV)
- 5.2.6 Natural-Gas Vehicles (NGV)
- 5.3 By Sales Channel
- 5.3.1 OEM-Franchised Dealer Sales
- 5.3.2 Direct-to-Consumer (Online)
- 5.3.3 Fleet and Rental Sales
- 5.4 By Level of Automation (Value)
- 5.4.1 Level 0 - 1 (Basic / No ADAS)
- 5.4.2 Level 2 (Partial Automation)
- 5.4.3 Level 3 (Conditional Automation)
- 5.4.4 Level 4 - 5 (High / Full Automation)
- 5.5 By Country
- 5.5.1 United States
- 5.5.2 Canada
- 5.5.3 Rest of North America
6 Competitive Landscape
- 6.1 Market Concentration
- 6.2 Strategic Moves
- 6.3 Market Share Analysis
- 6.4 Company Profiles (includes Global level Overview, Market level overview, Core Segments, Financials as available, Strategic Information, Market Rank/Share for key companies, Products & Services, and Recent Developments)
- 6.4.1 General Motors Company
- 6.4.2 Toyota Motor Corporation
- 6.4.3 Ford Motor Company
- 6.4.4 Stellantis N.V.
- 6.4.5 Hyundai Motor Company
- 6.4.6 Honda Motor Co., Ltd.
- 6.4.7 Nissan Motor Co., Ltd.
- 6.4.8 BMW AG
- 6.4.9 Tesla, Inc.
- 6.4.10 Volkswagen AG
- 6.4.11 Mercedes-Benz Group AG
- 6.4.12 Kia Corporation
- 6.4.13 Subaru Corporation
- 6.4.14 Mazda Motor Corporation
- 6.4.15 Rivian Automotive, Inc.
- 6.4.16 Lucid Group, Inc.
- 6.4.17 BYD Company Ltd.
- 6.4.18 Volvo Car Corporation
- 6.4.19 Mitsubishi Motors Corporation
- 6.4.20 Daimler Truck Holding AG
- 6.4.21 PACCAR Inc.
- 6.4.22 Navistar International Corp.
- 6.4.23 Harley-Davidson, Inc.
- 6.4.24 Yamaha Motor Co., Ltd.
7 Market Opportunities and Future Outlook

 拉丁美洲汽車產業的成長機會,2026年推動全球汽車市場發展的關鍵趨勢:2026 年展望
 撒哈拉以南非洲汽車產業:市場佔有率分析、產業趨勢與統計及成長預測(2026-2031 年)南美汽車市場:市場佔有率分析、產業趨勢與統計、成長預測(2026-2031)非洲汽車產業:市場佔有率分析、產業趨勢與統計、成長預測(2026-2031)
 2034年汽車銷售市場預測-按車輛類型、驅動方式、所有權類型、價格範圍、自動化程度、銷售管道和地區分類的全球分析
 2026年全球汽車市場報告中國汽車市場展望(2026年)2026年東協汽車產業的成長機遇
 越南汽車塗料市場(2025)