


 |
市場調查報告書
商品編碼
2119073
淨零能耗建築:市場佔有率分析、產業趨勢與統計及成長預測(2026-2031 年)Net-Zero Energy Buildings - Market Share Analysis, Industry Trends & Statistics, Growth Forecasts (2026 - 2031) |
||||||

※ 本網頁內容可能與最新版本有所差異。詳細情況請與我們聯繫。
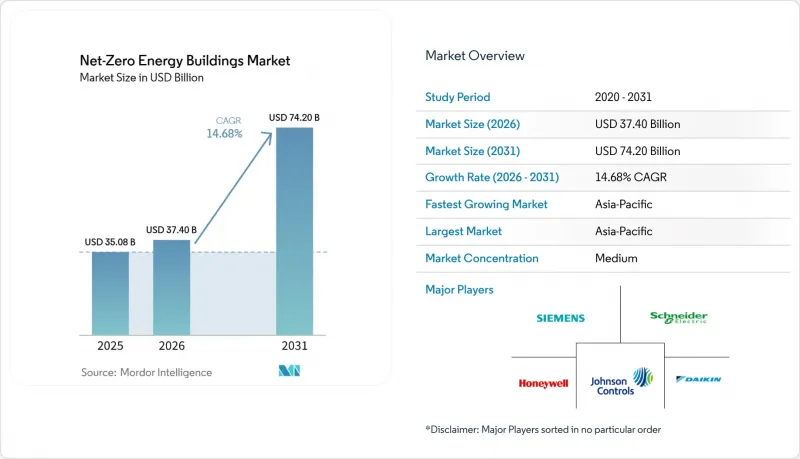
據 Mordor Intelligence 稱,2025 年淨零能耗建築市場價值為 350.8 億美元,預計到 2031 年將達到 742 億美元,而 2026 年為 374 億美元,預測期(2026-2031 年)的複合年成長率為 14.68%。
本報告按建築類型(住宅、商業、公共、工業)、產品/服務(解決方案和服務)、施工類型(新建和維修)以及地區(北美、歐洲、亞太、南美、中東和非洲)進行細分。市場預測以美元計價。
全球淨零能耗建築市場趨勢與洞察
監管要求和建築規範
建築規範不再只是設定最低標準,它們正日益成為專案需求的促進因素。歐盟修訂後的《建築能源性能指令》於2024年5月生效,該指令規定,自2028年1月起,所有公共實體擁有的新建築必須實現零排放。自2030年1月起,該要求將擴展至所有其他新建建築。成員國被要求在2026年5月29日之前將該指令納入本國法律。歐盟委員會也注意到,所有27個成員國均未能按期完成,並於2026年7月對每個成員國啟動了強制執行程序。
英國的「未來住宅和建築標準」將於 2027 年 3 月 24 日生效。這些標準將依法強制要求新建住宅使用現場可再生能源發電(主要是屋頂太陽能發電),並安裝低碳加熱系統。
歐洲以外的地區也在加強相關法規。加州2025年頒布的第24號建築能源效率標準將太陽能發電和電池儲能裝置的安裝要求擴大到非住宅建築和高層多用戶住宅。這些標準建立在該州現有的強制性住宅太陽能發電要求之上,並將推動市場朝著加州到2045年實現淨零排放的更廣泛目標邁進。
可再生能源併網與智慧技術
建築物的管理方式決定了其建成後能否維持淨零能耗性能。特靈科技和亞馬遜在三個履約中心開展的試點計畫中,利用BrainBox AI系統,實現了約15%的能耗降低。兩家公司宣布,到2026年,他們將在超過30個亞馬遜生鮮履約中心部署該系統。這套智慧控制系統能夠全面調節暖通空調設備、分散式發電、儲能系統和能源使用情況。隨著建築規範日益強調可衡量的性能,監控和最佳化對於合規性變得愈發重要。這使得淨零能耗建築市場對數位化建築管理工具的需求持續成長。
高初始投資
建造一座淨零能耗建築的成本通常比傳統建築高出 5% 至 15%。增加成本的原因在於:需要採用更優質的隔熱材料、高性能門窗和氣密性良好的建築圍護結構、高效的暖通空調和熱泵系統,以及現場可再生能源發電(例如太陽能發電)。對於典型的住宅項目,額外的前期成本約為 15,000 美元至 50,000 美元;而對於商業項目,成本則會根據系統規模和複雜程度按比例增加。
隨著時間的推移,節能帶來的成本節約可以抵銷這些費用。住宅建築的投資回收期通常為 8 至 15 年,商業建築的投資回收期通常為 10 至 20 年,在此期間,公用事業成本要么為零,要么大幅降低。然而,初始投資與實際節能收益之間的差距仍然是持續存在的經濟障礙。對於在建設期間面臨融資限制的開發商和購屋者,或者那些預計持有資產時間不足以完全收回投資的人來說,這項挑戰尤其嚴峻。
細分市場分析
預計到2031年,公共設施的複合年成長率將達到15.6%,在所有建築類型中成長最高。醫院、學校和公共設施都面臨公共部門設定的減排要求。英國國家醫療服務體系(NHS)的目標是在2028年至2032年間將排放量減少80%,並在2040年達到淨零排放。 2025年9月,切斯特伯爵夫人醫院成為英格蘭首座獲得認證的NHS淨零排放建築。這些公共承諾正在降低公共設施項目對可自由支配投資週期的依賴。
到2025年,商業建築將佔淨零能耗建築市場的43.8%。企業報告要求、租戶對認證空間的需求以及可衡量的節能效果都支撐了這一地位。投資者可以更輕鬆地評估大規模商業資產的營運成本。住宅和工業項目所佔佔有率較小,這得益於新的建築規範要求和企業設施脫碳計劃。因此,儘管淨零能耗建築業在多種建築用途方面都有需求,但商業資產仍然是最大的收入來源。
區域分析
預計到2025年,亞太地區將佔全球淨零能耗建築市場的37.1%,並在2031年之前以16.8%的複合年成長率成長。中國在太陽能、熱泵和隔熱材料方面的製造規模正在推動該地區對淨零能耗建築的採用。印度的永續發展框架和綠色金融政策正引導資本流向商業和公共建築資產。日本透過其「頂級跑者」計畫持續收緊能源標準。韓國、新加坡和澳洲也在新建築和公共部門維修中推廣零排放建築概念。
北美地區貢獻位居第二。加州2025年能源法規第24章第六部分(將於2026年1月1日生效)擴大了非住宅建築和高層多用戶住宅太陽能發電和電池儲能裝置的要求。紐約州一項耗資54億美元的計畫將於2026年至2030年實施,該計畫將極大地推動節能和電氣化工程的需求。加拿大的「深度改裝舉措計畫」也在支持商業、公共和住宅的維修活動。這些政策正在促進淨零能耗建築市場的新建和維修。
在所討論的區域中,歐洲擁有最完善的監管架構。歐盟成員國已按期於2026年5月前將修訂後的《建築能源性能指令》納入本國法律。該指令統一了全部區域新建公共和私人建築的合規時間表。南美洲、中東和非洲仍處於起步階段,目前主要集中在商業和政府所有項目。這些地區的專案儲備依賴國家評估計劃和發展融資支援。
其他好處:
- Excel格式的市場預測(ME)表
- 3個月的分析師支持
目錄
第1章:引言
- 研究假設和市場定義
- 調查範圍
第2章:調查方法
第3章執行摘要
第4章 市場趨勢與分析
- 市場概覽
- 市場促進因素
- 監管要求和建築規範
- 可再生能源併網與智慧技術
- 大規模節能維修和電氣化項目
- 建築物的能源成本波動和建築能源韌性
- 併網建築解決方案
- 基於結果的交付
- 市場限制因素
- 需要大量的初始投資。
- 缺乏熟練的脫碳專家
- 複雜建築系統的整合
- 互通性和網路安全風險
- 價值和供應鏈分析
- 監理情勢
- 技術展望
- 市場變化和採用趨勢
- 大型淨零能耗建築項目
- 波特五力分析
第5章 市場規模及成長預測(2020-2031年)
- 依建築類型
- 住宅
- 商業的
- 公共設施
- 產業
- 透過提供的內容
- 解決方案(開發新型淨零能耗建築、對現有建築進行淨零能耗維修、一體化設計與施工以及智慧淨零能耗建築解決方案)
- 服務(建築和工程設計、施工服務、試運行和認證服務、諮詢服務)
- 依建築類型
- 新建工程
- 維修
- 按地區
- 北美洲
- 美國
- 加拿大
- 墨西哥
- 歐洲
- 英國
- 德國
- 法國
- 義大利
- 西班牙
- 俄羅斯
- 其他歐洲國家
- 亞太地區
- 中國
- 印度
- 日本
- 澳洲
- 韓國
- 東南亞(新加坡、馬來西亞、泰國、印尼、越南、菲律賓)
- 其他亞太國家
- 南美洲
- 巴西
- 阿根廷
- 其他南美國家
- 中東和非洲
- 沙烏地阿拉伯
- 阿拉伯聯合大公國
- 土耳其
- 南非
- 奈及利亞
- 其他中東和非洲國家
- 北美洲
第6章 競爭情勢
- 市場集中度
- 策略趨勢
- 市佔率分析
- 公司簡介
- Siemens AG
- Schneider Electric SE
- Johnson Controls International plc
- Honeywell International Inc.
- Daikin Industries, Ltd.
- Carrier Global Corporation
- Trane Technologies plc
- ABB Ltd.
- Mitsubishi Electric Corporation
- Panasonic Holdings Corporation
- Saint-Gobain SA
- Kingspan Group plc
- ROCKWOOL A/S
- Lutron Electronics Co., Inc.
- Legrand SA
- Emerson Electric Co.
- Canadian Solar Inc.
- Sika AG
- SageGlass
- Integrated Environmental Solutions Limited
- Skanska AB
- Lendlease Group
- Velux Group
- Bouygues Construction
第7章 市場機會與未來展望
According to Mordor Intelligence, the Net-Zero energy buildings market size was valued at USD 35.08 billion in 2025 and is estimated to grow from USD 37.40 billion in 2026 to reach USD 74.20 billion by 2031, at a CAGR of 14.68% during the forecast period (2026-2031).
This report is Segmented by Building Type (Residential, Commercial, Institutional, and Industrial), Offerings (Solutions and Services), Construction Type (New Construction and Renovation), and Geography (North America, Europe, Asia-Pacific, South America, and Middle East and Africa). The Market Forecasts are Provided in Terms of Value (USD).
Global Net-Zero Energy Buildings Market Trends and Insights
Regulatory Mandates and Building Standards
Building codes increasingly drive project demand rather than merely set minimum standards. The EU's recast Energy Performance of Buildings Directive, in force since May 2024, requires all new buildings owned by public bodies to be zero-emission from January 2028. The requirement will extend to all other new buildings from January 2030. Member states must transpose the directive into national law by May 29, 2026. The text also notes that the European Commission confirmed that all 27 member states missed this deadline and opened infringement procedures against them in July 2026.
The UK's Future Homes and Buildings Standards will take effect on March 24, 2027. They will introduce a legal requirement for on-site renewable electricity generation, effectively rooftop solar, in new dwellings, along with mandatory low-carbon heating.
Mandates are also tightening outside Europe. California's 2025 Title 24 Building Energy Efficiency Standards will extend photovoltaic and battery storage requirements to nonresidential and high-rise multifamily buildings. These standards build on the state's existing residential solar mandate and support the market's progress toward California's broader net-zero-by-2045 target.
Renewable Integration and Smart Technologies
Operational controls determine whether a building maintains net-zero performance after construction. Trane Technologies and Amazon reported nearly 15% reductions in energy use across 3 fulfillment-center pilots using BrainBox AI. The companies announced deployment across more than 30 Amazon Grocery fulfillment centers in 2026. Smart controls can coordinate HVAC equipment, distributed generation, storage, and occupancy conditions. As codes shift toward measured performance, monitoring and optimization become more important to compliance. This creates recurring demand for digital building-management tools in the net-zero energy buildings market.
High Upfront Capital Requirements
Net-zero energy buildings typically cost 5-15% more to construct than conventional buildings. This premium stems from enhanced insulation, high-performance windows and airtight envelopes, efficient HVAC and heat pump systems, and on-site renewable generation, such as solar PV. For a typical residential project, the additional upfront cost ranges from approximately USD 15,000 to USD 50,000, while commercial projects incur proportionally higher costs depending on size and system complexity.
Energy savings offset these costs over time. Payback periods typically range from 8 to 15 years for residential buildings and 10 to 20 years for commercial buildings, with energy bills eliminated or sharply reduced. However, the gap between upfront capital expenditure and the realization of savings creates a persistent affordability barrier. This challenge is particularly acute for developers and buyers who face capital constraints during construction or do not expect to hold the asset long enough to capture the full payback.
Other drivers and restraints analyzed in the detailed report include:
- Deep Energy Retrofits and Electrification Programs
- Energy Cost Volatility and Building Energy Resilience
- Shortage of Skilled Decarbonization Professionals
For complete list of drivers and restraints, kindly check the Table Of Contents.
Segment Analysis
Institutional buildings are forecast to grow at a 15.6% CAGR through 2031, the highest rate within the building-type category. Hospitals, schools, and public facilities face defined public-sector emissions requirements. The NHS aims to reduce emissions by 80% by 2028 to 2032 and reach net-zero by 2040. The Countess of Chester Hospital was confirmed as England's first verified NHS net-zero building in September 2025. These public commitments make institutional projects less dependent on discretionary investment cycles.
Commercial buildings accounted for 43.8% of the net-zero energy market share in 2025. Corporate reporting requirements, tenant demand for certified space, and measurable energy savings supported this position. Investors can assess operating-cost outcomes more easily in large commercial assets. Residential and industrial projects had smaller shares but were supported by new code requirements and corporate facility-decarbonization programs. The net-zero energy buildings industry, therefore, has demand across several building uses, while commercial assets remain the largest current source of revenue.
Complete Report Scope:
- By Building Type
- Residential
- Commercial
- Institutional
- Industrial
- By Offerings
- Solutions (New Net-Zero Energy Building Development, Net-Zero Building Retrofit, Integrated Design & Delivery and Smart Net-Zero Building Solutions)
- Services (Architectural & Engineering Design, Construction Services, Commissioning & Certification Services and Consulting Services)
- By Construction Type
- New Construction
- Renovation
- By Geography
- North America
- United States
- Canada
- Mexico
- Europe
- United Kingdom
- Germany
- France
- Italy
- Spain
- Russia
- Rest of Europe
- Asia-Pacific
- China
- India
- Japan
- Australia
- South Korea
- SouthEast Asia (Singapore, Malaysia, Thailand, Indonesia, Vietnam, and Philippines)
- Rest of Asia-Pacific
- South America
- Brazil
- Argentina
- Rest of South America
- Middle East and Africa
- Saudi Arabia
- United Arab Emirates
- Turkey
- South Africa
- Nigeria
- Rest of Middle East and Africa
- North America
Geography Analysis
Asia-Pacific held 37.1% of the net-zero energy buildings market share in 2025 and is projected to grow at a 16.8% CAGR through 2031. China's manufacturing scale in solar photovoltaics, heat pumps, and insulation supports regional adoption. India's sustainability frameworks and green-finance measures direct capital toward commercial and institutional assets. Japan continues to tighten energy benchmarks through the Top Runner program. South Korea, Singapore, and Australia are also advancing zero-emission building activity in new construction and public-sector renovation.
North America was the second-largest regional contributor. California's 2025 Title 24 Part 6 Energy Code took effect on January 1, 2026, and expands photovoltaic and battery-storage requirements for nonresidential and high-rise multifamily buildings. New York's USD 5.4 billion program for 2026 through 2030 adds a large pool of demand for efficiency and electrification work. Canada's Deep Retrofit Accelerator Initiative also supports commercial, institutional, and residential retrofit activity. These policies support both new construction and renovation across the net-zero energy buildings market.
Europe has the most developed regulatory architecture among the regions discussed. EU member states reached the May 2026 transposition deadline for the revised Energy Performance of Buildings Directive. The directive aligns compliance timelines for new public and private buildings across the region. South America and the Middle East and Africa remain earlier-stage areas where adoption is concentrated in commercial and sovereign-owned projects. Their pipeline depends on national rating programs and development-finance support.
- Siemens AG
- Schneider Electric SE
- Johnson Controls International plc
- Honeywell International Inc.
- Daikin Industries, Ltd.
- Carrier Global Corporation
- Trane Technologies plc
- ABB Ltd.
- Mitsubishi Electric Corporation
- Panasonic Holdings Corporation
- Saint-Gobain S.A.
- Kingspan Group plc
- ROCKWOOL A/S
- Lutron Electronics Co., Inc.
- Legrand SA
- Emerson Electric Co.
- Canadian Solar Inc.
- Sika AG
- SageGlass
- Integrated Environmental Solutions Limited
- Skanska AB
- Lendlease Group
- Velux Group
- Bouygues Construction
Additional Benefits:
- The market estimate (ME) sheet in Excel format
- 3 months of analyst support
TABLE OF CONTENTS
1 Introduction
- 1.1 Study Assumptions and Market Definition
- 1.2 Scope of the Study
2 Research Methodology
3 Executive Summary
4 Market Insights and Dynamics
- 4.1 Market Overview
- 4.2 Market Drivers
- 4.2.1 Regulatory Mandates and Building Standards
- 4.2.2 Renewable Integration and Smart Technologies
- 4.2.3 Deep Energy Retrofits and Electrification Programs
- 4.2.4 Energy Cost Volatility and Building Energy Resilience
- 4.2.5 Grid-Interactive Building Solutions
- 4.2.6 Performance-Based Delivery
- 4.3 Market Restraints
- 4.3.1 High Upfront Capital Requirements
- 4.3.2 Shortage of Skilled Decarbonization Professionals
- 4.3.3 Complex Building System Integration
- 4.3.4 Interoperability and Cybersecurity Risks
- 4.4 Value and Supply-Chain Analysis
- 4.5 Regulatory Landscape
- 4.6 Technological Outlook
- 4.7 Market Evolution and Adoption Trends
- 4.8 Key Net-Zero Energy Building Projects
- 4.9 Porter's Five Forces Analysis
- 4.9.1 Bargaining Power of Suppliers
- 4.9.2 Bargaining Power of Consumers
- 4.9.3 Threat of New Entrants
- 4.9.4 Threat of Substitutes
- 4.9.5 Intensity of Competitive Rivalry
5 Market Size & Growth Forecasts (Value, USD), 2020-2031
- 5.1 By Building Type
- 5.1.1 Residential
- 5.1.2 Commercial
- 5.1.3 Institutional
- 5.1.4 Industrial
- 5.2 By Offerings
- 5.2.1 Solutions (New Net-Zero Energy Building Development, Net-Zero Building Retrofit, Integrated Design & Delivery and Smart Net-Zero Building Solutions)
- 5.2.2 Services (Architectural & Engineering Design, Construction Services, Commissioning & Certification Services and Consulting Services)
- 5.3 By Construction Type
- 5.3.1 New Construction
- 5.3.2 Renovation
- 5.4 By Geography
- 5.4.1 North America
- 5.4.1.1 United States
- 5.4.1.2 Canada
- 5.4.1.3 Mexico
- 5.4.2 Europe
- 5.4.2.1 United Kingdom
- 5.4.2.2 Germany
- 5.4.2.3 France
- 5.4.2.4 Italy
- 5.4.2.5 Spain
- 5.4.2.6 Russia
- 5.4.2.7 Rest of Europe
- 5.4.3 Asia-Pacific
- 5.4.3.1 China
- 5.4.3.2 India
- 5.4.3.3 Japan
- 5.4.3.4 Australia
- 5.4.3.5 South Korea
- 5.4.3.6 SouthEast Asia (Singapore, Malaysia, Thailand, Indonesia, Vietnam, and Philippines)
- 5.4.3.7 Rest of Asia-Pacific
- 5.4.4 South America
- 5.4.4.1 Brazil
- 5.4.4.2 Argentina
- 5.4.4.3 Rest of South America
- 5.4.5 Middle East and Africa
- 5.4.5.1 Saudi Arabia
- 5.4.5.2 United Arab Emirates
- 5.4.5.3 Turkey
- 5.4.5.4 South Africa
- 5.4.5.5 Nigeria
- 5.4.5.6 Rest of Middle East and Africa
- 5.4.1 North America
6 Competitive Landscape
- 6.1 Market Concentration
- 6.2 Strategic Moves
- 6.3 Market Share Analysis
- 6.4 Company Profiles (Includes Global Level Overview, Market Level Overview, Core Segments, Financials as Available, Strategic Information, Products & Services, and Recent Developments)
- 6.4.1 Siemens AG
- 6.4.2 Schneider Electric SE
- 6.4.3 Johnson Controls International plc
- 6.4.4 Honeywell International Inc.
- 6.4.5 Daikin Industries, Ltd.
- 6.4.6 Carrier Global Corporation
- 6.4.7 Trane Technologies plc
- 6.4.8 ABB Ltd.
- 6.4.9 Mitsubishi Electric Corporation
- 6.4.10 Panasonic Holdings Corporation
- 6.4.11 Saint-Gobain S.A.
- 6.4.12 Kingspan Group plc
- 6.4.13 ROCKWOOL A/S
- 6.4.14 Lutron Electronics Co., Inc.
- 6.4.15 Legrand SA
- 6.4.16 Emerson Electric Co.
- 6.4.17 Canadian Solar Inc.
- 6.4.18 Sika AG
- 6.4.19 SageGlass
- 6.4.20 Integrated Environmental Solutions Limited
- 6.4.21 Skanska AB
- 6.4.22 Lendlease Group
- 6.4.23 Velux Group
- 6.4.24 Bouygues Construction
7 Market Opportunities & Future Outlook
- 7.1 White-Space and Unmet-Need Assessment

 亞太地區淨零能耗建築:市場佔有率分析、產業趨勢與統計及成長預測(2026-2031年)北美淨零能耗建築:市場佔有率分析、產業趨勢與統計及成長預測(2026-2031 年)南美洲淨零能耗建築:市場佔有率分析、產業趨勢與統計及成長預測(2026-2031 年)中東和非洲淨零能耗建築:市場佔有率分析、行業趨勢和統計數據以及成長預測(2026-2031 年)
 淨零能耗建築市場-2026-2032年全球市場預測
 全球淨零能耗住宅市場規模、佔有率、趨勢和成長分析報告(2026-2034年)
 電子百葉窗技術市場-全球產業規模、佔有率、趨勢、機會、預測:依技術、百葉窗類型、應用、地區和競爭格局分類,2021-2031年
 2034年淨零排放諮詢市場預測:按服務類型、合約模式、組織規模、最終用戶和地區分類的全球分析
 淨零能耗建築市場報告:按產品、建築類型和地區分類(2026-2034 年)
 2026年全球淨零能耗建築(ZEB)市場報告