


 |
市場調查報告書
商品編碼
2118124
美國塑膠廢棄物管理服務:市場佔有率分析、行業趨勢和統計數據以及成長預測(2026-2031 年)United States Plastic Waste Management Services - Market Share Analysis, Industry Trends & Statistics, Growth Forecasts (2026 - 2031) |
||||||

※ 本網頁內容可能與最新版本有所差異。詳細情況請與我們聯繫。
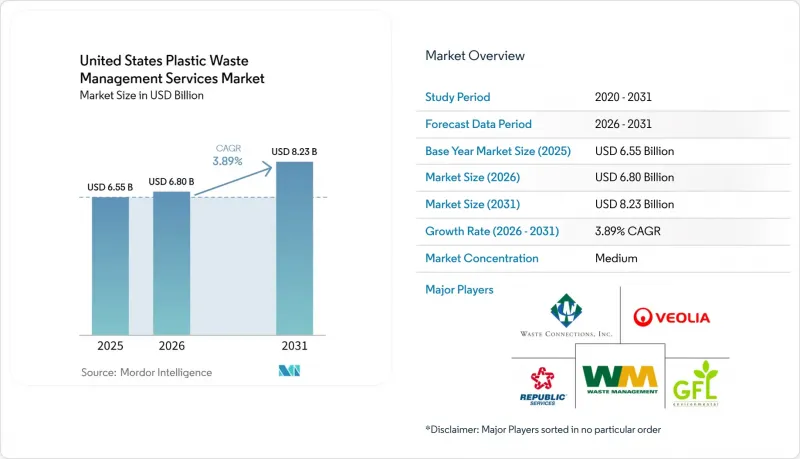
根據 Mordor Intelligence 預測,美國塑膠廢棄物管理服務市場規模將從 2025 年的 65.5 億美元和 2026 年的 68 億美元成長到 2031 年的 82.3 億美元,2026 年至 2031 年的複合年成長率為 3.89%。
本報告按來源(住宅、商業、工業及其他)、服務提供者(公共/市政、私人廢棄物管理公司及其他)和服務類型(收集、運輸、分類/分離、處置/處理及其他)進行分類。市場預測以貨幣價值(美元)和數量(噸)兩種形式呈現。
美國塑膠廢棄物管理服務市場趨勢與洞察
塑膠包裝必須含有強制性再生材料成分
美國各州透過制定再生材料含量法規,提高了塑膠廢棄物管理服務市場對再生塑膠的最低要求,從而擴大了包裝材料的需求,使其不再局限於自願承諾。截至2025年8月,已有五個州頒布法律,要求塑膠包裝中必須含有最低比例的再生材料;緬因州也於2026年1月1日起強制規定塑膠飲料容器的再生材料含量必須達到25%。加州也正在推動包裝轉型,SB 54法案規定,到2032年,所有一次性包裝都必須可回收或可堆肥,該法案已開始影響品牌重新設計和供應商選擇。美國公共關係協會(APR)引用的一項2024年加州大學柏克萊分校的研究表明,到2050年,如果全國範圍內強制規定再生材料含量達到40%,則可減少美國50%的塑膠廢棄物、44%的原生塑膠產量和17%的溫室氣體排放。這有助於解釋為什麼長期基礎設施規劃現在越來越注重擴大回收能力。此外,隨著各州利用 APR 認證方法和 CalRecycle 的監管框架等檢驗工具,合規結構正變得越來越正式,從而為分類和再加工項目提供了更有利的資金籌措條件。
掩埋處理成本的上升提高了回收利用的經濟可行性。
美國塑膠廢棄物管理服務市場正受益於垃圾處理成本的上漲。即使再生產品的價格仍然較低,廢棄物回收的經濟效益也因此提升。在擁有垃圾焚化發電發電廠的州,平均垃圾處理成本達到每噸71.30美元,而沒有此類基礎設施的州則為每噸55.60美元,這表明人口稠密的沿海地區面臨的垃圾處理壓力最大。這種壓力促使美國塑膠廢棄物管理服務市場向「按服務收費」的定價模式轉變,因為營運商可以根據避免的垃圾處理成本更直接地證明其處理費的合理性。 Waste Connections在年度報告中指出,該公司已提高回收收集和處理費用,以更好地反映實際成本。
對物料回收設施進行資本密集現代化改造
美國塑膠廢棄物管理服務市場仍面臨巨大的資金壁壘,因為許多設施需要進行大規模維修才能達到政策目標。項目案例說明了這些項目的規模:萊恩縣的設施預計耗資1.5億美元,蘭普基公司的哥倫布中心預計耗資1億美元,大西洋海岸回收公司帕塞克重建項目預計耗資4700萬美元。對於小規模的公共系統和地方政府,如果沒有大量津貼和穩定的生產者責任制,這些投資的融資將十分困難。不斷上漲的資金籌措成本和原料供應的長期不確定性進一步延緩了投資決策,尤其是對於獨立回收商和地方政府設施而言。此外,可接受材料清單的變化也加劇了這個問題。換句話說,為處理目前廢棄物流量而維修的設施,可能在3-5年內就需要添置新的設備,因為包裝法規正在不斷擴展。
細分市場分析
預計到2025年,工業來源將占美國塑膠廢棄物管理服務市場佔有率的41.2%,成為此來源類別中最大的收入來源。這一地位反映了來自汽車、電子、化學和物流行業的工業廢料的持續流入,這些行業會產生大量的塑膠。這些廢棄物通常包括相對清潔的清理材料、不合格的顆粒、薄膜碎片和缺陷產品,因此與消費後廢棄物相比,所需的分類和污染控制較少。這些清潔原料的特性使得服務供應商能夠在美國塑膠廢棄物管理服務市場獲得更高的利潤率和更可預測的業務量。
這一優勢在當前的投資趨勢中得到了清晰體現。美國塑膠回收公司Plastics Recovery於2026年1月將其位於喬治亞勞倫斯維爾的工廠的切碎機和造粒產能加倍,使其每年能夠處理約5000萬磅工業聚合物。商業領域是成長最快的類別,這主要得益於零售商、連鎖餐廳、辦公室和其他適合規劃專用收集路線的集中場所,預計到2031年,其複合年成長率將達到4.7%。住宅垃圾仍佔相當大的比例,但由於收集路線分散以及家庭垃圾分類習慣差異很大,其收集和污染物處理成本往往較高。 「其他」類別(機構、醫療、農業等)規模較小,但隨著中西部各州農業薄膜的堆積引起了州政府和專業回收商的關注,該類別也日益受到重視。
其他好處:
- Excel格式的市場預測(ME)表
- 3個月的分析師支持
目錄
第1章:引言
- 研究假設和市場定義
- 調查範圍
第2章:調查方法
第3章執行摘要
第4章 市場狀況
- 市場概覽
- 市場促進因素
- 塑膠包裝中再生材料含量的強制性要求
- 掩埋處理成本的不斷上漲,提高了回收利用的經濟可行性。
- 綜合廢棄物管理公司加大對回收能力的投資
- 擴大市政回收項目中的公私合營
- 製造業收集的工業塑膠廢料數量增加
- 對閉合迴路包裝供應鏈的需求日益成長
- 市場限制因素
- 對物料回收設施進行資本密集現代化改造
- 軟性薄膜和多層包裝的回收率低。
- 可回收塑膠標準化不足
- 低密度塑膠廢棄物運輸成本高昂
- 價值供應鏈分析
- 監理情勢
- 技術展望
- 創業生態系分析
- 再生塑膠與原生塑膠的比較分析
- 塑膠捆包和再生樹脂分析
- 全球貿易趨勢和進口限制(廢棄塑膠)
第5章 市場規模與成長預測
- 來源
- 住宅
- 商業設施(零售、辦公室等)
- 產業
- 其他(組織、農業等)
- 透過服務供應商
- 公共/市政
- 私人廢棄物管理公司
- 其他組織包括生產者責任組織(PRO)等。
- 按服務類型
- 收集、運輸、分類和分離
- 處置/處理
- 掩埋處置
- 回收和資源回收
- 焚燒和垃圾焚化發電
- 其他(化學加工等)
- 其他服務(諮詢、審計、訓練等)
第6章 競爭情勢
- 市場集中度
- 策略趨勢
- 市佔率分析
- 公司簡介
- WM(Waste Management, Inc.)
- Republic Services
- Waste Connections
- Veolia North America
- GFL Environmental
- Clean Harbors
- Reworld
- Recology Inc.
- Casella Waste Systems
- Rumpke Waste & Recycling
- Sims Municipal Recycling
- PreZero US
- FCC Environmental Services
- Remondis Americas
- LRS(Lakeshore Recycling Systems)
- TerraCycle
- KW Plastics
- Balcones Resources
- Nexus Circular
- Circular Services(Closed Loop Partners)
第7章 市場機會與未來展望
According to Mordor Intelligence, the United States plastic waste management services market size is projected to expand from USD 6.55 billion in 2025 and USD 6.80 billion in 2026 to USD 8.23 billion by 2031, registering a CAGR of 3.89% between 2026 to 2031.
This report is Segmented by Source (Residential, Commercial, Industrial, and Others), by Service Provider (Public/Municipal, Private Waste Management Companies, and Others), and by Service Type (Collection, Transportation, Sorting & Segregation, Disposal / Treatment, and Others). The Market Forecasts are Provided in Terms of Value (USD) and Volume (Tons).
United States Plastic Waste Management Services Market Trends and Insights
Mandatory Recycled Content Requirements for Plastic Packaging
State recycled-content laws are creating a firmer demand floor for recovered resin in the United States plastic waste management services market, as they move demand beyond voluntary packaging pledges. By August 2025, 5 states had enacted minimum post-consumer recycled content laws for plastic packaging, and Maine moved to a 25% requirement for plastic beverage containers effective January 1, 2026. California is also pushing a broad packaging shift under SB 54, which requires all single-use packaging to be recyclable or compostable by 2032 and is already influencing brand redesigns and supplier choices. A 2024 UC Berkeley study cited by APR found that a 40% national recycled content requirement by 2050 could cut United States plastic waste by 50%, lower virgin plastic production by 44%, and reduce greenhouse gas emissions by 17%, which helps explain why long-range infrastructure planning is now leaning more heavily toward recovery capacity. Compliance systems are also becoming more formal as states use verification tools such as APR certification approaches and CalRecycle rulemaking structures, which support more bankable demand conditions for sorting and reprocessing projects.
Escalating Landfill Tipping Fees Improving Recycling Economics
The United States plastic waste management services market is benefiting from rising disposal costs, which improve the relative economics of diversion even when recycled commodity prices are weak. In states with waste-to-energy capacity, the average fee reached USD 71.3 per ton, compared with USD 55.6 per ton in states without that infrastructure, indicating that disposal pressure is strongest in denser coastal systems. That pressure is helping the United States plastic waste management services market move toward fee-for-service pricing, as operators can more directly justify processing charges against avoided disposal costs. Waste Connections stated in its annual filing that it increased recycling collection and processing fees to reflect actual costs better.
Capital-Intensive Modernization of Material Recovery Facilities
The United States plastic waste management services market still faces a significant capital barrier, as many facilities require major upgrades before policy targets can be met. Project examples clearly show the scale, with Lane County's facility estimated at USD 150 million, Rumpke's Columbus center at USD 100 million, and Atlantic Coast Recycling's Passaic redevelopment at USD 47 million. For smaller public systems and rural municipalities, those investment levels are difficult to absorb without deep grant support or a stable producer responsibility funding stream. Higher financing costs and uncertainty over long-term feedstock volumes further delay investment decisions, particularly for independent recyclers and local government-owned facilities. The problem is also recurring because accepted material lists are changing, so sites upgraded for current streams may need more equipment again within 3 to 5 years as packaging rules expand.
Other drivers and restraints analyzed in the detailed report include:
- Growing Investments by Integrated Waste Companies in Recycling Capacity
- Growth in Public-Private Partnerships for Municipal Recycling Operations
- Low Recovery Rates for Flexible Films and Multi-Layer Packaging
For complete list of drivers and restraints, kindly check the Table Of Contents.
Segment Analysis
Industrial sources accounted for 41.2% of the United States plastic waste management services market share in 2025, which made them the largest revenue base among source categories. That position reflects the steady flow of post-industrial scrap from automotive, electronics, chemical, and logistics operations, where plastics are generated in concentrated volumes. These streams usually contain cleaner purges, off-spec pellets, film trim, and molded rejects, so they need less sorting and contamination control than post-consumer loads. The cleaner input profile gives service providers better margins and more predictable throughput in the United States plastic waste management services market.
This advantage is evident in current investment patterns: United States Plastics Recovery doubled shredding and granulating capacity at its Lawrenceville, Georgia, site in January 2026 to handle nearly 50 million pounds of post-industrial polymer a year. Commercial sources are the fastest-growing category and are projected to grow at a 4.7% CAGR through 2031, supported by retailers, food service chains, offices, and other clustered generators that lend themselves well to dedicated route planning. Residential volumes remain important, but they bring higher collection and contamination costs because routes are fragmented and sorting behavior varies widely across households. The others segment, which includes institutions, healthcare, and agriculture, remains smaller but is gaining attention as agricultural film accumulation in Midwestern states draws more notice from state agencies and specialist collectors.
Complete Report Scope:
- By Source
- Residential
- Commercial (Retail, Office, etc.)
- Industrial
- Others (institutional, Agricultural, etc)
- By Service Provider
- Public/Municipal
- Private Waste Management Companies
- Others - Producer Responsibility Organizations (PROs), etc.
- By Service Type
- Collection, Transportation, Sorting & Segregation
- Disposal / Treatment
- Landfill
- Recycling & Resource Recovery
- Incineration & Waste-to-Energy
- Others (Chemical Treatment, etc.)
- Others (Consulting, Audit & Training, etc.)
List of Companies Covered in this Report:
- WM (Waste Management, Inc.)
- Republic Services
- Waste Connections
- Veolia North America
- GFL Environmental
- Clean Harbors
- Reworld
- Recology Inc.
- Casella Waste Systems
- Rumpke Waste & Recycling
- Sims Municipal Recycling
- PreZero US
- FCC Environmental Services
- Remondis Americas
- LRS (Lakeshore Recycling Systems)
- TerraCycle
- KW Plastics
- Balcones Resources
- Nexus Circular
- Circular Services (Closed Loop Partners)
Additional Benefits:
- The market estimate (ME) sheet in Excel format
- 3 months of analyst support
TABLE OF CONTENTS
1 Introduction
- 1.1 Study Assumptions & Market Definition
- 1.2 Scope of the Study
2 Research Methodology
3 Executive Summary
4 Market Landscape
- 4.1 Market Overview
- 4.2 Market Drivers
- 4.2.1 Mandatory Recycled Content Requirements for Plastic Packaging
- 4.2.2 Escalating Landfill Tipping Fees Improving Recycling Economics
- 4.2.3 Growing Investments by Integrated Waste Companies in Recycling Capacity
- 4.2.4 Growth in Public-Private Partnerships for Municipal Recycling Operations
- 4.2.5 Increasing Industrial Plastic Scrap Recovery from Manufacturing
- 4.2.6 Increasing Demand for Closed-Loop Packaging Supply Chains
- 4.3 Market Restraints
- 4.3.1 Capital-Intensive Modernization of Material Recovery Facilities
- 4.3.2 Low Recovery Rates for Flexible Films and Multi-Layer Packaging
- 4.3.3 Insufficient Standardization of Accepted Recyclable Plastics
- 4.3.4 High Transportation Costs for Low-Density Plastic Waste
- 4.4 Value / Supply-Chain Analysis
- 4.5 Regulatory Landscape
- 4.6 Technological Outlook
- 4.7 Startup Ecosystem Analysis
- 4.8 Analysis of Recycled Plastics on Virgin Plastics
- 4.9 Analysis of Plastic Bale & Recycled Resin
- 4.10 Global Trade Flows & Import Restrictions (Waste Plastics)
5 Market Size and Growth Forecasts
- 5.1 By Source
- 5.1.1 Residential
- 5.1.2 Commercial (Retail, Office, etc.)
- 5.1.3 Industrial
- 5.1.4 Others (institutional, Agricultural, etc)
- 5.2 By Service Provider
- 5.2.1 Public/Municipal
- 5.2.2 Private Waste Management Companies
- 5.2.3 Others - Producer Responsibility Organizations (PROs), etc.
- 5.3 By Service Type
- 5.3.1 Collection, Transportation, Sorting & Segregation
- 5.3.2 Disposal / Treatment
- 5.3.2.1 Landfill
- 5.3.2.2 Recycling & Resource Recovery
- 5.3.2.3 Incineration & Waste-to-Energy
- 5.3.2.4 Others (Chemical Treatment, etc.)
- 5.3.3 Others (Consulting, Audit & Training, etc.)
6 Competitive Landscape
- 6.1 Market Concentration
- 6.2 Strategic Moves
- 6.3 Market Share Analysis
- 6.4 Company Profiles {(Includes Global Level Overview, Market Level Overview, Core Segments, Financials as Available, Strategic Information, Products & Services, and Recent Developments)}
- 6.4.1 WM (Waste Management, Inc.)
- 6.4.2 Republic Services
- 6.4.3 Waste Connections
- 6.4.4 Veolia North America
- 6.4.5 GFL Environmental
- 6.4.6 Clean Harbors
- 6.4.7 Reworld
- 6.4.8 Recology Inc.
- 6.4.9 Casella Waste Systems
- 6.4.10 Rumpke Waste & Recycling
- 6.4.11 Sims Municipal Recycling
- 6.4.12 PreZero US
- 6.4.13 FCC Environmental Services
- 6.4.14 Remondis Americas
- 6.4.15 LRS (Lakeshore Recycling Systems)
- 6.4.16 TerraCycle
- 6.4.17 KW Plastics
- 6.4.18 Balcones Resources
- 6.4.19 Nexus Circular
- 6.4.20 Circular Services (Closed Loop Partners)
7 Market Opportunities & Future Outlook
- 7.1 White-space & Unmet-need Assessment

 新加坡塑膠廢棄物管理服務:市場佔有率分析、行業趨勢和統計數據以及成長預測(2026-2031 年)英國塑膠廢棄物管理服務:市場佔有率分析、行業趨勢和統計數據、成長預測(2026-2031 年)日本塑膠廢棄物管理服務:市場佔有率分析、產業趨勢與統計及成長預測(2026-2031)德國塑膠廢棄物管理服務:市場佔有率分析、產業趨勢與統計及成長預測(2026-2031)
 塑膠廢棄物管理服務市場:按服務類型、塑膠類型、來源和最終用途產業分類-2026-2032年全球市場預測塑膠廢棄物管理與回收:市場佔有率分析、產業趨勢與統計、成長預測(2026-2031)
 全球塑膠廢棄物管理市場規模、佔有率、趨勢和成長分析報告(2026-2034年)
 塑膠廢棄物管理市場:依塑膠類型、應用、回收方法、技術、國家及地區分類-全球產業分析、市場規模、市場佔有率及2026年至2033年預測
 寵物水族箱及池塘維護系統市場預測至2034年-全球水族箱設備及系統、池塘設備及系統、水族箱及池塘耗材、水族箱及池塘配件、服務及解決方案以及區域分析自動化寵物護理系統市場預測至2034年—按系統類型、寵物類型、連接方式、技術、最終用戶、分銷管道和地區分類的全球分析