

 |
市場調查報告書
商品編碼
2114823
天然氣燃料基礎設施:市場佔有率分析、產業趨勢與統計、成長預測(2026-2031 年)Natural Gas Refueling Infrastructure - Market Share Analysis, Industry Trends & Statistics, Growth Forecasts (2026 - 2031) |
||||||

※ 本網頁內容可能與最新版本有所差異。詳細情況請與我們聯繫。
據 Mordor Intelligence 稱,2025 年天然氣加註基礎設施市場價值為 253.8 億美元,預計到 2031 年將達到 369.8 億美元,而 2026 年為 270.2 億美元,預測期(2026-2031 年)的複合年成長率為 6.47%。
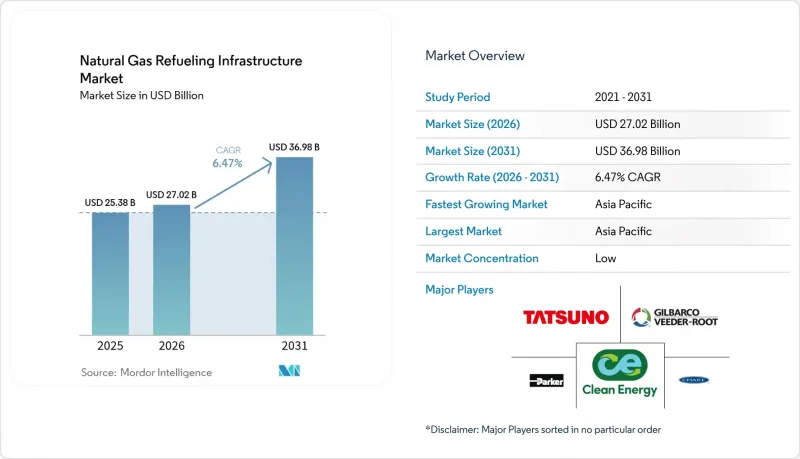
本報告按天然氣類型(壓縮天然氣、可再生/生物壓縮天然氣等)、加氣站類型(快速加氣站、移動/可攜式加氣站、液化天然氣燃料庫等)、組件(壓縮機、控制和監控系統等)、最終用戶(公共交通巴士、船舶等)和地區(北美、歐洲、亞太地區、南美、中東和非洲)進行分類。
全球天然氣燃料基礎設施市場趨勢與洞察
對大型車輛更嚴格的二氧化碳排放法規,使得基礎建設的迫切性日益凸顯。
歐洲VII排放標準要求重型卡車的氮氧化物排放量在2025年前減少90%,而美國第三階段的排放標準則要求二氧化碳排放量在2027年前減少50%。因此,在電動卡車普及之前,車主們尋求短期合規措施,天然氣加氣基礎設施市場正在迅速擴張。主要貨運走廊沿線的物流營運商正在加速採用天然氣汽車,並簽訂多年燃料供應合約以支持加氣站的利用。
井口天然氣價格的下降為我們帶來了競爭優勢。
2024年,亨利樞紐天然氣基準價格降至2.21美元/百萬英熱單位,將降低燃料成本,並將北美地區改造投資的投資回收期縮短至不到兩年。巴西也出現了類似的趨勢,一條連接瓦卡穆爾塔天然氣廠的新管道預計到2025年將使工業天然氣價格降低40%,進一步增強投資者對天然氣加氣基礎設施市場的信心。
高額資本投入和授權核准延誤限制了液化天然氣的擴張。
液化天然氣(LNG)設施的建設成本在300萬美元至500萬美元之間,而壓縮天然氣(CNG)設施的建設成本僅為180萬美元。此外,歐洲的環境評估核准流程耗時超過24個月,減緩了天然氣加氣基礎設施市場的資金週轉。因此,市場集中在資金雄厚的大規模開發商手中,而小規模專案則被擱置。
細分市場分析
到2025年,壓縮天然氣(CNG)將佔天然氣加氣基礎設施市場62.10%的佔有率,這得益於現有的車輛、標準化的壓縮機以及較低的進入門檻。液化天然氣(LNG)對於長途卡車運輸仍然至關重要,因為僅靠CNG無法滿足其續航里程要求,同時LNG也是新興船舶燃料庫航線的必需燃料。清潔能源燃料公司(Clean Energy Fuels)、巴西石油公司(Petrobras)以及區域性沼氣聯盟正在擴大沼氣池的規模併升級沼氣廠,推動可再生能源/生物壓縮天然氣(bio-CNG)市場以19.35%的複合年成長率成長,並擴大低碳應用天然氣加氣基礎設施的市場規模。
根據美國45Z和加州排碳權附加的溢價使營運商能夠從每個標準空氣資源單位(SARM)中獲得額外利潤,從而將可再生能源設施的投資回收期縮短至四年以內。然而,穩定的基本客群至關重要。巴西一家生物甲烷工廠在2024年日產量達到417,100立方米,但卻難以找到願意支付溢價的買家,凸顯了天然氣加氣基礎設施市場的價格敏感度風險。
到2025年,快速加註將主導市場,佔據42.60%的市場佔有率,因為商用車輛優先考慮在與柴油相同的5分鐘加註時間內完成加註。同時,移動式和可攜式模組正以8.72%的複合年成長率推動市場成長,開發商正在部署拖車式裝置來檢驗市場需求,然後再建造永久性加註站。奈及利亞的六個加註點以及林德公司的可攜式液化天然氣撬裝設備就反映了這種趨勢。
定時加氣島繼續為專用公車場站提供服務,但其處理能力仍有限。同時,混合加氣配置正吸引需要容錯能力的大型場站的注意。在需要雙燃料相容性的港口,用於液化天然氣-壓縮天然氣混合加氣站的天然氣加氣基礎設施市場規模正在擴大,但與簡單的壓縮天然氣設施相比,高壓泵的引入使得資本投資成本居高不下。
區域分析
預計到2025年,亞太地區將佔據全球天然氣加氣基礎設施市場佔有率的45.80%,並在2031年之前以7.41%的複合年成長率持續成長。這主要得益於中國創紀錄的蘊藏量成長及其作為全球最大液化天然氣進口國的地位。政府的空氣品質法規和補貼計畫持續刺激著都市區公車和物流走廊的資本投資,而澳洲和卡達的液化天然氣出口樞紐則增強了區域供應的穩定性。印度城市燃氣管網的進一步發展以及日本能源來源結構多元化、逐步擺脫核能發電的舉措也進一步推動了這一成長,促使各方規劃建設高密度加氣站,從而擴大南亞和東亞天然氣加氣基礎設施市場的規模。
北美憑藉豐富的頁岩氣資源位居第二。這推動亨利樞紐天然氣價格在2024年上漲至2.21美元/百萬英熱單位,與柴油相比,這將使車輛營運商的加氣成本降低40%至60%。自2022年以來,超過5億美元的聯邦公共交通津貼用於支持大規模公共交通CNG終端的建設,而加州的甲烷洩漏稅額扣抵計劃正在加速低洩漏設施的升級改造。加拿大正利用加拿大西部沉積盆地為其國內汽車車隊和新興的西海岸液化天然氣燃料庫中心供應天然氣,而與墨西哥能源轉型相關的管道項目正在為移動式CNG模組開闢新的運輸路線。
在歐洲,如何在世界上最嚴格的車輛排放氣體法規和所需的大量投資之間取得平衡,是亟待解決的問題。儘管如此,隨著歐VII排放標準將於2025年生效,迫使貨輪在電池續航里程提升之前使用天然氣,加氣站的需求仍在逐步成長,即便許可證核准週期較長。德國計劃在2025年將液化天然氣(LNG)加氣站擴建至200座,荷蘭則專注於生物壓縮天然氣(bio-CNG),而斯堪地那維亞半島的港口燃料庫叢集也表明,儘管各國戰略不盡相同,但在低碳天然氣解決方案方面卻趨於一致。在南美洲,多個地區也呈現發展動能。巴西塞爾希培州一家私營LNG接收站的管道連接,加上巴西石油公司(Petrobras)的生物甲烷競標,預計到2025年將使天然氣供應價格降低40%,並擴大內陸車輛的天然氣供應。在中東和非洲,ADNOC 的低碳 Luwais LNG 項目以及在奈及利亞六個地點部署 CNG 的項目,凸顯了國家主導的舉措如何能夠成為出口導向型經濟體快速擴張網路的催化劑。
其他好處:
- Excel格式的市場預測(ME)表
- 3個月的分析師支持
目錄
第1章:引言
- 研究假設和市場定義
- 調查範圍
第2章:調查方法
第3章執行摘要
第4章 市場狀況
- 市場概覽
- 市場促進因素
- 加強大型車輛二氧化碳排放法規(歐盟第七階段,美國第三階段)
- 與和原油價格掛鉤的柴油相比,井口天然氣的價格較低。
- 政府對車輛更換的補貼
- 新興的液化天然氣燃料庫通道
- 對洩漏量低的電站給予甲烷洩漏稅額扣抵
- 利用 NGV 車載資訊技術,透過人工智慧最佳化站點位置選擇。
- 市場限制因素
- 液化天然氣加工廠高額資本投資/授權程序延誤
- 與電池式電動車充電站的競爭
- 低溫用不銹鋼供不應求
- 高風險資產的保險費
- 供應鏈分析
- 監理情勢
- 技術展望
- 波特五力模型
第5章 市場規模與成長預測
- 依天然氣類型
- 壓縮天然氣(CNG)
- 液化天然氣(LNG)
- 可再生能源/生物壓縮天然氣
- 液化壓縮天然氣(L-CNG)
- 依站點類型
- 高速加油
- 時間填充
- 複合填充
- 行動/可攜式
- 液化天然氣燃料庫站
- 液化天然氣站
- 按組件
- 壓縮機
- 自動販賣機
- 儲存槽
- 冷卻/溫度管理
- 控制和監控系統
- 輔助設備
- 最終用戶
- 小型乘用車
- 中型和大型公路車輛
- 大眾運輸巴士
- 船舶(燃料庫)
- 鐵路
- 工業和商用車輛
- 按地區
- 北美洲
- 美國
- 加拿大
- 墨西哥
- 歐洲
- 德國
- 英國
- 法國
- 義大利
- 北歐國家
- 俄羅斯
- 其他歐洲國家
- 亞太地區
- 中國
- 印度
- 日本
- 韓國
- 東南亞國協
- 澳洲和紐西蘭
- 其他亞太國家
- 南美洲
- 巴西
- 阿根廷
- 其他南美國家
- 中東和非洲
- 沙烏地阿拉伯
- 阿拉伯聯合大公國
- 南非
- 埃及
- 其他中東和非洲國家
- 北美洲
第6章 競爭情勢
- 市場集中度
- 策略趨勢(併購、聯盟、購電協議)
- 市場佔有率分析(主要公司的市場排名和市場佔有率)
- 公司簡介
- Clean Energy Fuels
- Parker Hannifin Corp
- Chart Industries
- Gilbarco Veeder-Root
- Tatsuno Corp
- Scheidt & Bachmann
- Sanki Industry Group
- Greka Engineering
- Tulsa Gas Technologies
- Cryostar SAS
- FTI International Group
- Westport Fuel Systems
- Agility Fuel Solutions
- Galileo Technologies
- Landi Renzo
- Kraus Global
- Hexagon Agility
- Bennett Pump
- WEH GmbH
- HAM Group
第7章 市場機會與未來展望
According to Mordor Intelligence, the natural gas refueling infrastructure market size was valued at USD 25.38 billion in 2025 and estimated to grow from USD 27.02 billion in 2026 to reach USD 36.98 billion by 2031, at a CAGR of 6.47% during the forecast period (2026-2031).
This report is Segmented by Natural Gas Type (Compressed Natural Gas, Renewable/Bio-CNG, and More), Station Type (Fast-Fill, Mobile/Portable, LNG Bunkering Station, and More), Component (Compressors, Control and Monitoring Systems, and More), End-User (Public Transit Buses, Marine, and More), and Geography (North America, Europe, Asia-Pacific, South America, and Middle East and Africa).
Global Natural Gas Refueling Infrastructure Market Trends and Insights
Stricter HD-vehicle CO2 rules drive infrastructure urgency
Euro VII mandates a 90% NOx reduction for heavy-duty trucks by 2025, while U.S. Phase 3 standards require a 50% CO2 reduction by 2027, triggering a rapid expansion of the natural gas refueling infrastructure market as fleets seek near-term compliance paths before electric trucks mature. Logistics operators in core freight corridors are accelerating the adoption of natural gas vehicles, securing multi-year fuel contracts that underpin station utilization.
Lower well-head gas prices create competitive advantage
The Benchmark Henry Hub fell to USD 2.21/MMBtu in 2024, resulting in fuel savings that reduced conversion payback periods to under two years in North America. Similar trends are observed in Brazil, where new pipelines tied to Vaca Muerta flows are projected to reduce industrial gas rates by 40% in 2025, thereby reinforcing investor confidence in the natural gas refueling infrastructure market.
High CAPEX and permitting delays constrain LNG expansion
LNG sites cost USD 3-5 million, versus USD 1.8 million for CNG, and European environmental assessments extend approval cycles beyond 24 months, slowing capital rotation within the natural gas refueling infrastructure market. The result is a tilt toward larger, well-capitalized developers and a pause in smaller-scale projects.
Other drivers and restraints analyzed in the detailed report include:
- Government fleet-conversion subsidies accelerate adoption
- Methane-slip tax credits reward low-leak stations
- Competition from battery-electric charging hubs intensifies
For complete list of drivers and restraints, kindly check the Table Of Contents.
Segment Analysis
Compressed natural gas controlled 62.10% of the natural gas refueling infrastructure market in 2025, underpinned by legacy fleets, standardized compressors, and low entry costs. Liquefied natural gas remains essential for long-haul trucking and emerging marine bunkering lanes that cannot meet range needs with CNG alone. Clean Energy Fuels, Petrobras, and regional biogas consortia are scaling digesters and upgrading plants, propelling renewable/bio-CNG to a 19.35% CAGR and widening the natural gas refueling infrastructure market size for low-carbon applications.
The premium attached to carbon credits under U.S. 45Z and California LCFS pays operators an additional margin per therm, shortening the payback period for renewable sites to under four years. Still, a reliable customer base is vital: Brazil's biomethane plants produced 417,100 m3/day in 2024 but struggled to secure off-takers at premium rates, highlighting price-sensitivity risks within the natural gas refueling infrastructure market.
Fast-fill dominated the market with a 42.60% share in 2025, as commercial fleets value 5-minute refuels that mimic diesel behavior. Mobile and portable modules, however, lead growth at 8.72% CAGR, as developers deploy trailer-mounted units to validate demand before building permanent pads, an approach evident in Nigeria's six-site rollout and Linde's portable LNG skids.
Time-fill islands continue serving captive bus barns but remain throughput-limited, while combined-fill configurations attract megadepots seeking resilience. The natural gas refueling infrastructure market size for L-CNG hybrid depots is growing in ports that require dual fuel capability, yet high-pressure pumps keep capital expenditures elevated relative to simple CNG rigs.
Complete Report Scope:
- By Natural Gas Type
- Compressed Natural Gas (CNG)
- Liquefied Natural Gas (LNG)
- Renewable/Bio-CNG
- Liquefied-Compressed NG (L-CNG)
- By Station Type
- Fast-fill
- Time-fill
- Combined-fill
- Mobile/Portable
- LNG Bunkering Station
- L-CNG Station
- By Component
- Compressors
- Dispensers
- Storage Tanks
- Cooling/Temperature Mgmt.
- Control and Monitoring Systems
- Auxiliary Equipment
- By End User
- Light-Duty Vehicles
- Medium and Heavy-Duty Road Fleet
- Public Transit Buses
- Marine (Bunkering)
- Rail
- Industrial and Commercial Fleet
- By Geography
- North America
- United States
- Canada
- Mexico
- Europe
- Germany
- United Kingdom
- France
- Italy
- NORDIC Countries
- Russia
- Rest of Europe
- Asia-Pacific
- China
- India
- Japan
- South Korea
- ASEAN Countries
- Australia and New Zealand
- Rest of Asia-Pacific
- South America
- Brazil
- Argentina
- Rest of South America
- Middle East and Africa
- Saudi Arabia
- United Arab Emirates
- South Africa
- Egypt
- Rest of Middle East and Africa
- North America
Geography Analysis
Asia-Pacific commanded a 45.80% natural gas refueling infrastructure market share in 2025, and the region is forecast to advance at a 7.41% CAGR through 2031 as China couples record reserve additions with its status as the world's largest LNG importer. Government air-quality mandates and subsidy programs continue to funnel capital toward urban bus and logistics corridors, while LNG export hubs from Australia and Qatar reinforce regional supply security. India's city-gas build-out and Japan's diversification away from nuclear power add further tailwinds, creating a dense station pipeline that elevates the natural gas refueling infrastructure market size across South and East Asia.
North America ranks second, thanks to its abundant shale output, which pushed Henry Hub prices to USD 2.21/MMBtu in 2024 and delivered 40-60% pump-price savings compared to diesel for fleet operators. More than USD 500 million in federal transit grants since 2022 have underwritten large CNG depots for public agencies, while California's methane-slip tax credits accelerate upgrades to low-leak equipment. Canada leverages its Western Canadian Sedimentary Basin to supply both domestic fleets and emerging West-Coast LNG bunkering sites, and Mexico's energy-reform pipeline projects open fresh corridors for mobile CNG modules.
Europe balances some of the world's strictest vehicle-emission limits with high capital expenditure hurdles; nevertheless, Euro VII rules, effective 2025, compel freight operators to adopt natural gas until battery ranges improve, driving incremental station demand despite lengthy permitting cycles. Germany's plan to expand LNG stations to 200 by 2025, the Netherlands' focus on bio-CNG, and Scandinavia's port-based bunkering clusters illustrate how national strategies differ yet converge on low-carbon gas solutions. South America shows pockets of momentum: Brazil's pipeline link to Sergipe's private LNG terminal, combined with Petrobras' biomethane tender, is expected to cut delivered gas prices by 40% in 2025 and widen access for inland fleets. In the Middle East and Africa, ADNOC's low-carbon Ruwais LNG project and Nigeria's six-site CNG rollout highlight how state-backed initiatives can seed rapid network growth in export-oriented economies.
- Clean Energy Fuels
- Parker Hannifin Corp
- Chart Industries
- Gilbarco Veeder-Root
- Tatsuno Corp
- Scheidt & Bachmann
- Sanki Industry Group
- Greka Engineering
- Tulsa Gas Technologies
- Cryostar SAS
- FTI International Group
- Westport Fuel Systems
- Agility Fuel Solutions
- Galileo Technologies
- Landi Renzo
- Kraus Global
- Hexagon Agility
- Bennett Pump
- WEH GmbH
- HAM Group
Additional Benefits:
- The market estimate (ME) sheet in Excel format
- 3 months of analyst support
TABLE OF CONTENTS
1 Introduction
- 1.1 Study Assumptions & Market Definition
- 1.2 Scope of the Study
2 Research Methodology
3 Executive Summary
4 Market Landscape
- 4.1 Market Overview
- 4.2 Market Drivers
- 4.2.1 Stricter HD-vehicle CO? rules (EU VII, US Phase 3)
- 4.2.2 Lower well-head gas prices vs. oil-linked diesel
- 4.2.3 Government fleet-conversion subsidies
- 4.2.4 Emerging LNG bunkering corridors
- 4.2.5 Methane-slip tax credits for low-leak stations
- 4.2.6 AI-optimised station siting via NGV telematics
- 4.3 Market Restraints
- 4.3.1 High CAPEX/permitting delays for LNG stations
- 4.3.2 Competition from battery-electric charging hubs
- 4.3.3 Scarcity of cryogenic-grade stainless steel
- 4.3.4 Insurance premiums for high-pressure assets
- 4.4 Supply-Chain Analysis
- 4.5 Regulatory Landscape
- 4.6 Technological Outlook
- 4.7 Porter's Five Forces
- 4.7.1 Bargaining Power of Suppliers
- 4.7.2 Bargaining Power of Consumers
- 4.7.3 Threat of New Entrants
- 4.7.4 Threat of Substitutes
- 4.7.5 Competitive Rivalry
5 Market Size & Growth Forecasts
- 5.1 By Natural Gas Type
- 5.1.1 Compressed Natural Gas (CNG)
- 5.1.2 Liquefied Natural Gas (LNG)
- 5.1.3 Renewable/Bio-CNG
- 5.1.4 Liquefied-Compressed NG (L-CNG)
- 5.2 By Station Type
- 5.2.1 Fast-fill
- 5.2.2 Time-fill
- 5.2.3 Combined-fill
- 5.2.4 Mobile/Portable
- 5.2.5 LNG Bunkering Station
- 5.2.6 L-CNG Station
- 5.3 By Component
- 5.3.1 Compressors
- 5.3.2 Dispensers
- 5.3.3 Storage Tanks
- 5.3.4 Cooling/Temperature Mgmt.
- 5.3.5 Control and Monitoring Systems
- 5.3.6 Auxiliary Equipment
- 5.4 By End User
- 5.4.1 Light-Duty Vehicles
- 5.4.2 Medium and Heavy-Duty Road Fleet
- 5.4.3 Public Transit Buses
- 5.4.4 Marine (Bunkering)
- 5.4.5 Rail
- 5.4.6 Industrial and Commercial Fleet
- 5.5 By Geography
- 5.5.1 North America
- 5.5.1.1 United States
- 5.5.1.2 Canada
- 5.5.1.3 Mexico
- 5.5.2 Europe
- 5.5.2.1 Germany
- 5.5.2.2 United Kingdom
- 5.5.2.3 France
- 5.5.2.4 Italy
- 5.5.2.5 NORDIC Countries
- 5.5.2.6 Russia
- 5.5.2.7 Rest of Europe
- 5.5.3 Asia-Pacific
- 5.5.3.1 China
- 5.5.3.2 India
- 5.5.3.3 Japan
- 5.5.3.4 South Korea
- 5.5.3.5 ASEAN Countries
- 5.5.3.6 Australia and New Zealand
- 5.5.3.7 Rest of Asia-Pacific
- 5.5.4 South America
- 5.5.4.1 Brazil
- 5.5.4.2 Argentina
- 5.5.4.3 Rest of South America
- 5.5.5 Middle East and Africa
- 5.5.5.1 Saudi Arabia
- 5.5.5.2 United Arab Emirates
- 5.5.5.3 South Africa
- 5.5.5.4 Egypt
- 5.5.5.5 Rest of Middle East and Africa
- 5.5.1 North America
6 Competitive Landscape
- 6.1 Market Concentration
- 6.2 Strategic Moves (M&A, Partnerships, PPAs)
- 6.3 Market Share Analysis (Market Rank/Share for key companies)
- 6.4 Company Profiles (includes Global level Overview, Market level overview, Core Segments, Financials as available, Strategic Information, Products & Services, and Recent Developments)
- 6.4.1 Clean Energy Fuels
- 6.4.2 Parker Hannifin Corp
- 6.4.3 Chart Industries
- 6.4.4 Gilbarco Veeder-Root
- 6.4.5 Tatsuno Corp
- 6.4.6 Scheidt & Bachmann
- 6.4.7 Sanki Industry Group
- 6.4.8 Greka Engineering
- 6.4.9 Tulsa Gas Technologies
- 6.4.10 Cryostar SAS
- 6.4.11 FTI International Group
- 6.4.12 Westport Fuel Systems
- 6.4.13 Agility Fuel Solutions
- 6.4.14 Galileo Technologies
- 6.4.15 Landi Renzo
- 6.4.16 Kraus Global
- 6.4.17 Hexagon Agility
- 6.4.18 Bennett Pump
- 6.4.19 WEH GmbH
- 6.4.20 HAM Group
7 Market Opportunities & Future Outlook
- 7.1 White-space & Unmet-Need Assessment

 可再生天然氣市場分析及預測(至2035年):依類型、服務、技術、組件、應用、製程、部署、最終用戶、設備及解決方案分類
 天然氣充裝基礎設施市場:2026-2032年全球市場預測(依天然氣類型、站型、所有權、部署類型、應用程式和最終用戶分類)
 德國廢棄物製取可再生氣體:市場佔有率分析、產業趨勢與統計及成長預測(2026-2031 年)中國廢棄物衍生可再生氣體:市場佔有率分析、產業趨勢與統計及成長預測(2026-2031年)廢棄物衍生可再生氣體:市場佔有率分析、行業趨勢和統計數據以及成長預測(2026-2031 年)歐洲廢棄物衍生可再生氣體:市場佔有率分析、產業趨勢和統計數據以及成長預測(2026-2031 年)美國廢棄物衍生可再生氣體:市場佔有率分析、行業趨勢和統計數據以及成長預測(2026-2031 年)
 可再生天然氣市場預測至2034年-按來源、生產流程、分銷方式、應用、最終用戶和地區分類的全球分析認證氣體市場預測-全球按來源、分銷方式、應用、最終用戶和地區分類的分析——2034年
 天然氣市場-全球產業規模、佔有率、趨勢、機會和預測:按類型、應用、地區和競爭格局分類,2021-2031年