


 |
市場調查報告書
商品編碼
2073247
廢棄物衍生可再生氣體:市場佔有率分析、行業趨勢和統計數據以及成長預測(2026-2031 年)Renewable Gas From Waste - Market Share Analysis, Industry Trends & Statistics, Growth Forecasts (2026 - 2031) |
||||||

※ 本網頁內容可能與最新版本有所差異。詳細情況請與我們聯繫。
據 Mordor Intelligence 稱,2025 年廢棄物衍生可再生氣體市場價值為 187.5 億美元,預計到 2031 年將達到 314.2 億美元,而 2026 年為 203.4 億美元,預測期(2026-2031 年)的複合成長率為 9.09%。
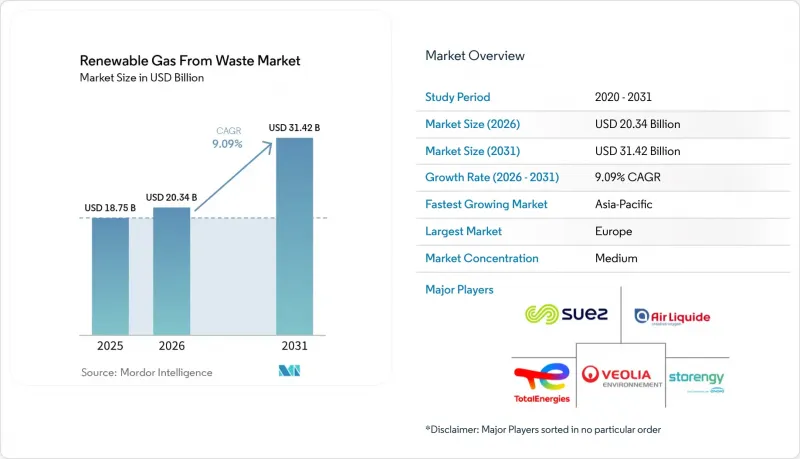
本報告依原料(食物廢棄物、畜禽糞便等)、技術(氣化、熱解等)、氣體類型(沼氣、合成氣等)、應用(發電等)、組件(氣體回收、消化器/發酵等)及地區(北美、歐洲等)分類。市場預測以美元計價。
全球廢棄物可再生氣體市場趨勢與洞察
政府獎勵,如基於費率的飼料 (RFS) 和低成本飼料 (LCFS) 以及生物甲烷定價方案,正在增加。
政府政策是目前對廢棄物衍生可再生天然氣市場最明確的商業性支持,為開發商提供了貸款機構可以擔保的收入基礎。美國環保署 (EPA) 於 2026 年 3 月最終確定了第二套可再生燃料標準 (RFS) 規則,規定纖維素生質燃料的強制性數量在 2026 年為 13.6 億個可再生識別碼 (RIN),在 2027 年為 14.3 億個 RIN。這確保了監管重點繼續放在沼氣衍生途徑上。這項決定意義重大,因為再生能源被排除在目標數量之外,對 D3可再生識別碼的需求將繼續進一步集中在垃圾掩埋沼氣和採用厭氧消化的可再生天然氣 (RNG) 項目中。此外,加州修訂後的低碳燃料標準(LCFS)規則於2025年7月1日實施,將用於電動車充電串聯發電機的生物甲烷的「登記申報」核算方式延長至2035年,進一步提高了專案的透明度。在歐洲,REPowerEU持續支持2030年生物甲烷年產量達到350億立方公尺的目標,歐盟委員會估計累積投資需求為370億歐元(400億美元)。這意味著,廢棄物衍生可再生氣體市場將繼續與大規模公共政策推動的擴張計畫保持一致。
嚴格的甲烷排放法規和強制使用掩埋氣體正在推動從垃圾掩埋氣體(LFG)到能源的轉型計畫。
甲烷法規正將掩埋氣回收從一項自願性的環保措施轉變為廢棄物天然氣市場的直接投資可再生。根據美國環保署(EPA)固態氣體報告計畫的數據,2023年共掩埋了1,287個市政和工業廢棄物,其中83%仍在積極接收廢棄物,為未來的合規活動留下了大規模的監測基礎。美國生物燃氣委員會報告稱,美國仍有470個掩埋在燃燒(焚燒)可轉化為可再生天然氣(RNG)的氣體,這代表相當於132.2萬標準立方英尺/分鐘(scfm)的未開發回收潛力。隨著回收法規的日益嚴格,預計會有更多運營商傾向於將垃圾填埋氣升級為RNG,而不是簡單地燃燒或直接燃燒,因為回收的氣體接入交通和電網後具有更高的價值。
升級垃圾掩埋氣系統、工廠和管道連接需要大量資金投入。
資本密集度仍然是廢棄物衍生可再生氣體市場的主要障礙,尤其是在需要新回收系統、氣體淨化設施和管道連接的項目中。美國生物氣體委員會估計,要充分發揮美國生物氣體回收潛力,需要在所有掩埋、食物廢棄物廠、農場和污水處理廠投入4,500億美元的資金。如此龐大的支出規模使得開發商繼續將目光投向擁有現有基礎設施、碳權額度較高或已簽訂長期協議的地點。管道互聯也增加了不確定性,因為位置從一開始就是一項財務挑戰,成本會根據距管網的距離、公共產業燃氣規格和計量要求而波動。這種資金籌措負擔正在減緩廢棄物衍生可再生氣體市場計畫的推出,對於缺乏足夠資金支持和投資組合合作夥伴的獨立開發商而言,這是一個特別嚴重的問題。
細分市場分析
2025年,都市固態廢棄物佔據最大佔有率,達35.4%,仍是廢棄物衍生可再生氣體市場已部署原料供應的核心。這一地位主要得益於三大持續優勢:規範的掩埋基礎設施、成熟廢棄物掩埋單元可預測的氣體產量,以及作為纖維素原料獲得認證,從而支持根據美國可再生燃料標準(RFS)生成D3可再生識別碼(RINs)。此外,掩埋專案在北美和歐洲擁有長期營運經驗,與相對較新的廢棄物處理方法相比,更容易被貸款人和開發商評估。食物廢棄物是成長最快的原料類別,預計2026年至2031年將以10.2%的複合年成長率成長。這反映了各州對有機廢棄物處置的禁令,以及將高水分有機廢棄物轉移至厭氧消化處理的經濟可行性。 2026 年 2 月,美國生物瓦斯委員會表示,食物廢棄物占美國一般城市固態廢棄物的 15%,其中超過 75% 最終仍被掩埋,這意味著未來仍有大量可重複使用的食物廢棄物。
報告顯示,美國目前僅有124座專門用於處理食物廢棄物的厭氧消化池,年處理能力僅276億立方英尺(Bcf)。這凸顯了該產業在資源基礎方面仍處於起步階段,遠低於其1,920億立方英尺的理論潛力。農業殘餘物和牲畜糞便是廢棄物衍生可再生天然氣(RNG)產業中獨特的價值來源。這是因為根據生命週期碳排放標準(LCFS)和聯邦可再生燃料標準(RFS),酪農糞便可以獲得非常優惠的生命週期碳評分。當碳排放強度夠低,能夠產生遠超氣體本身價值的附加價值時,糞便衍生RNG便成為極具吸引力的選擇。工業有機廢棄物也日益受到重視,因為食品加工商、啤酒廠和製藥廠可以將「入場費」機制與長期能源採購結合。聯合國糧食及農業組織(糧農組織)和經濟合作暨發展組織(經合組織)對2025年至2034年的預測支持此原物料結構的長期發展方向。這是因為中等收入國家收入的成長和都市化預計將導致食品消費量和相關浪費的增加。
到2025年,厭氧消化將佔技術組合的44.1%,成為廢棄物衍生可再生氣體市場中最重要的基礎技術。這項優勢源自於其廣泛的原料處理應對力。同一製程組可以處理污水污泥、食物廢棄物、牲畜糞便和混合有機物,其商業性化程度遠高於其他新興技術。厭氧消化還具有長期運作記錄的優勢,這降低了貸款方的不確定性,並促進了標準化工廠配置的形成。共消化進一步增強了這一優勢,因為它允許操作人員混合不同的有機物流,並透過平衡原料的季節性波動來提高利用率。 2025年發表的一項研究表明,在受控條件下,添加零價鐵奈米顆粒、生物炭和生物強化等製程干預措施可以提高沼氣產量和甲烷含量,這表明現有設施的性能還有進一步提升的空間。
掩埋氣回收仍然十分重要,因為它已融入受監管場所的廢棄物管理基礎設施中。然而,禁止掩埋有機物的法規可能會對其長期市場佔有率構成壓力。沼氣氣體純化是成長最快的技術領域,預計到2031年將以11.1%的複合年成長率成長。這反映了沼氣在諸如交通燃料和併網發電等領域具有更大的經濟可行性。近期技術研究表明,新型提純設計,例如四柱變壓式吸附(VPSA)系統和奈米氣泡增強膜技術,將降低能耗並提高氣體純度。這些改進意義重大,因為甲烷純度的提高和處理能耗的降低將直接提高廢棄物衍生可再生氣體市場中工廠的獲利能力。氣化和熱解也仍然佔據一定的市場佔有率。然而,由於其商業性基礎較小且適用原料範圍有限,與厭氧消化和純化相比,這些技術仍然屬於小眾技術。
區域分析
2025年,歐洲將佔據廢棄物衍生可再生天然氣市場38.5%的佔有率,成為本週期內最大的區域市場。該地區的領先地位源於其雄心勃勃的生物甲烷政策、完善的沼氣消化和純化設施,以及全部區域。在德國,約有9,605座沼氣廠(包括290座生物甲烷精煉廠)運作,預計2025年產量將達到12.8太瓦時。這表明該地區的基礎設施建設發展強勁。然而,在德國等市場,國內實施情況的差異以及持續存在的監管不確定性,仍然增加了開發商的資金籌措和專案執行風險。
北美仍然是廢棄物衍生廢棄物天然氣市場商業化程度最高的地區之一,這得益於聯邦可再生燃料標準(RFS)、加州低碳燃料標準(LCFS)、商業性有機資源利用法規以及豐富的掩埋氣體和厭氧可再生項目主導。到2025年,美國將運作21億美元的沼氣投資。其中,掩埋計畫將引領資本投資,其次是農業領域。這顯示各類原物料的資本投資範圍正在擴大。此外,美國仍有470個掩埋燃燒天然氣,這些天然氣可轉化為可再生天然氣(RNG),確保了短期內新增供應的穩定開發平臺。在加拿大,不列顛哥倫比亞省和安大略省等省份正在持續建立生物甲烷採購框架和市政計畫支援機制,展現出區域擴張的趨勢。
預計2026年至2031年,亞太地區將以13.62%的複合年成長率成長,成為廢棄物衍生可再生氣體市場成長最快的地區。這一成長與快速的都市化、有機廢棄物量的增加以及以中國主導的政策標準化進程密切相關。儘管中國的技術標準「NB/T 11925-2025」是更廣泛的產業推動計畫的一部分,但根據國際能源總署(IEA)的生質能源數據,目前的生物甲烷產能遠低於中國的長期資源潛力。在廢棄物量不斷增加和區域項目框架改善的推動下,印度和東南亞正在崛起為新的成長中心。以巴西為首的南美洲正在推動垃圾掩埋沼氣開發。同時,中東和非洲仍處於起步階段,面臨大量未回收有機廢棄物和基礎設施有限的困境。由於這些區域情況,預計到 2031 年,歐洲將成為最大的收入來源,北美將成為最發達的商業基地,而亞太地區將成為擴張的主要驅動力。
其他好處:
- Excel格式的市場預測(ME)表
- 3個月的分析師支持
目錄
第1章:引言
- 研究假設和市場定義
- 調查範圍
第2章:調查方法
第3章執行摘要
第4章 市場狀況
- 市場概覽
- 市場促進因素
- 嚴格的甲烷排放法規和強制性的掩埋氣利用正在推動掩埋氣(LFG)的能源轉化項目。
- 政府獎勵,如基於費率的飼料 (RFS) 和低成本飼料 (LCFS) 以及生物甲烷定價,正在增加。
- 企業為實現脫碳目標所做的努力正在推動對低碳再生天然氣的需求。
- 以掩埋產生的再生天然氣為驅動力,大規模交通運輸產業正轉型為壓縮天然氣/液化天然氣。
- 都市化和食物廢棄物確保了有機廢棄物的穩定供應。
- 沼氣氣體純化技術的進步提高了再生天然氣的產量和品質。
- 市場限制因素
- 垃圾掩埋氣系統、工廠維修和管道連接需要大量資金。
- 隨著廢棄物資源回收和再利用的進步,掩埋氣的產量正在下降。
- 監管和補貼政策不一致導致市場碎片化。
- 技術挑戰包括矽氧烷污染、硫化氫去除和氣體品質變化。
- 價值供應鏈分析
- 監理情勢
- 技術展望
- 波特五力模型
- 人工智慧驅動的廢棄物收集對服務供應商收入成長的影響
- 消費者行為轉向零浪費生活方式的轉變正在影響服務需求。
- 地緣政治事件對市場的影響
第5章 市場規模與成長預測
- 按原料
- 都市固態廢棄物(MSW)
- 農業殘餘物
- 牲畜糞便
- 工業有機廢棄物
- 污水污泥
- 食物廢棄物
- 其他
- 透過技術
- 厭氧消化
- 垃圾掩埋沼氣回收
- 氣化
- 熱解
- 沼氣氣體純化系統
- 其他
- 依氣體類型
- 沼氣
- 生物甲烷/可再生天然氣(RNG)
- 合成氣
- 透過使用
- 發電
- 熱電聯產(CHP)
- 注入電網
- 運輸燃料
- 工業加熱
- 住宅和商業供暖
- 其他
- 按組件
- 氣體收集系統
- 消化槽和發酵系統
- 氣體處理及淨化設備
- 壓縮機和儲能系統
- 發電設備
- 監控系統
- 其他
- 按地區
- 北美洲
- 美國
- 加拿大
- 墨西哥
- 南美洲
- 巴西
- 阿根廷
- 智利
- 其他南美國家
- 歐洲
- 德國
- 英國
- 法國
- 義大利
- 西班牙
- 俄羅斯
- 比荷盧經濟聯盟(比利時、荷蘭、盧森堡)
- 北歐國家(丹麥、芬蘭、冰島、挪威、瑞典)
- 其他歐洲國家
- 亞太地區
- 中國
- 印度
- 日本
- 韓國
- 澳洲
- 東南亞(印尼、越南、泰國、馬來西亞、菲律賓)
- 其他亞太國家
- 中東和非洲
- 阿拉伯聯合大公國
- 沙烏地阿拉伯
- 南非
- 奈及利亞
- 其他中東和非洲國家
- 北美洲
第6章 競爭情勢
- 市場集中度
- 策略趨勢
- 市佔率分析
- 公司簡介
- TotalEnergies SE
- Storengy SAS(ENGIE Group)
- Veolia Environnement SA
- SUEZ SA
- L'Air Liquide SA
- Gasum Oyj
- Waga Energy SA
- EnviTec Biogas AG
- Verbio SE
- Clean Energy Fuels Corp.
- Waste Management, Inc.
- Montauk Renewables, Inc.
- OPAL Fuels Inc.
- Gas Verde
- Orizon Valorizacao de Residuos SA
- Anaergia Inc.
- Future Biogas Ltd.
- Vanguard Renewables
- Shell plc
- bp plc
第7章 市場機會與未來展望
According to Mordor Intelligence, the renewable gas from waste market size was valued at USD 18.75 billion in 2025 and is estimated to grow from USD 20.34 billion in 2026 to reach USD 31.42 billion by 2031, at a CAGR of 9.09% during the forecast period (2026-2031).
This report is Segmented by Feedstock (Food Waste, Animal Manure, and More), by Technology (Gasification, Pyrolysis, and More), by Gas Type (Biogas, Syngas, and More), by Application (Electricity Generation, and More), by Component (Gas Collection, Digesters & Fermentation and More), and by Geography (North America, Europe, and More). The Market Forecasts are Provided in Terms of Value (USD).
Global Renewable Gas From Waste Market Trends and Insights
Government Incentives Like RFS, LCFS, and Biomethane Tariffs are Increasing
Government policy remains the clearest form of commercial support for the renewable gas from waste market, as it provides developers with a revenue base that lenders can underwrite. The United States EPA finalized its Set 2 Renewable Fuel Standard rule in March 2026 and set cellulosic biofuel obligations at 1.36 billion Renewable Identification Numbers (RINs) for 2026 and 1.43 billion RINs for 2027, keeping regulatory focus on biogas-derived pathways. That decision matters because renewable electricity was excluded from those qualifying volumes, which keeps D3 renewable identification number demand more concentrated on landfill-gas and anaerobic-digestion RNG projects. California also strengthened project visibility when its updated Low Carbon Fuel Standard (LCFS) rules took effect on July 1, 2025, and extended book-and-claim accounting for biomethane used in linear generators for EV charging through 2035. In Europe, REPowerEU continues to support the 35 bcm annual biomethane target for 2030, and the European Commission estimates cumulative investment needs at EUR 37 billion (USD 40 billion), keeping the renewable gas from waste market aligned with a large public policy build-out agenda.
Strict Methane-Emission Rules and Landfill-Gas Mandates Drive LFG-To-Energy Projects
Methane regulation is turning landfill gas capture from a voluntary environmental measure into a direct investment trigger in the renewable gas from waste market. The EPA Greenhouse Gas Reporting Program tracked 1,287 municipal solid waste and industrial waste landfills in 2023, and 83% of those sites were still actively receiving waste, leaving a large monitored base for further compliance activity. The American Biogas Council reported that 470 United States landfills are still flaring gas that could instead be converted into RNG, representing 1,322,000 scfm of untapped capture potential. As collection rules tighten, more operators are likely to favor RNG upgrades over simple flaring or direct combustion, since captured gas is more valuable when linked to transport and grid pathways.
High Capital is Required for LFG Systems, Upgrading Plants, and Pipeline Connections
Capital intensity remains a major barrier to the renewable gas from waste market, especially for projects that require new collection systems, gas-cleaning equipment, and pipeline connections. The American Biogas Council estimated that a full build-out of the United States biogas capture potential would require USD 450 billion in capital across candidate landfills, food waste facilities, farms, and wastewater sites. That scale of spending explains why developers continue to focus on sites with better existing infrastructure, stronger carbon-credit economics, or long-term off-take agreements. Pipeline interconnection also adds uncertainty because costs vary with distance from the network, utility gas specifications, and metering requirements, making site selection a financial issue from the start. This financing burden slows project formation in the renewable gas from waste market, particularly for independent developers without a large balance sheet or a portfolio partner.
Other drivers and restraints analyzed in the detailed report include:
- Corporate Decarbonization Pledges Boost Demand for Low-Carbon RNG
- The Heavy-Duty Transport Sector Shifts to CNG and LNG Fueled by Landfill RNG
- Inconsistent Regulations and Subsidies Create Market Fragmentation
For complete list of drivers and restraints, kindly check the Table Of Contents.
Segment Analysis
Municipal solid waste held the largest share at 35.4% in 2025, remaining at the core of the installed feedstock supply for the renewable gas from waste market. That position came from three durable advantages: regulated landfill infrastructure, predictable gas yield from mature waste cells, and the cellulosic qualification that supports D3 Renewable Identification Number generation under the United States RFS. Landfill projects also benefited from long operating histories in North America and Europe, which made them easier for lenders and developers to evaluate against newer waste pathways. Food waste is the fastest-growing feedstock segment and is projected to advance at a 10.2% CAGR from 2026 to 2031, reflecting state organics bans and the economics of diverting high-moisture organic material into anaerobic digestion. The American Biogas Council stated in February 2026 that food waste accounts for 15% of municipal solid waste streams in the United States and that more than 75% still ends up in landfills, leaving a large volume available for future diversion.
The same report counted only 124 standalone food waste anaerobic digestion facilities in the United States, with a combined capacity of 27.6 Bcf per year, versus a theoretical potential of 192 Bcf, underscoring how early this segment still is relative to its resource base. Agricultural residues and animal manure represent a distinct value pool in the renewable gas from waste industry, as dairy manure can earn very favorable lifecycle carbon scores under the LCFS and the federal RFS. That revenue stacking makes manure-based RNG especially attractive when carbon intensity is low enough to create value well above the gas's value. Industrial organic waste is also gaining ground because food processors, brewers, and pharmaceutical plants can combine gate-fee logic with long-term energy procurement. The Food and Agriculture Organization of the United Nations (FAO) and the Organization for Economic Co-operation and Development (OECD) outlook for 2025 to 2034 supports the long-term direction of this feedstock mix, as rising incomes and urbanization in middle-income countries are expected to lift food consumption and related waste volumes over time.
Anaerobic digestion accounted for 44.1% of the technology mix in 2025, making it the largest base in the renewable gas from waste market. Its lead reflects broad feedstock flexibility, as the same process family can work across wastewater sludge, food waste, animal manure, and mixed organics, with far greater commercial maturity than newer alternatives. Anaerobic digestion also benefits from a long operating record, which reduces lender uncertainty and supports standardized plant configurations. Co-digestion strengthens this advantage by allowing operators to blend different organic streams and smooth feedstock seasonality, thereby improving utilization rates. Research published in 2025 reported that process interventions such as zerovalent iron nanoparticles, biochar, and bioaugmentation can increase biogas yield and methane content under controlled conditions, suggesting further performance gains at existing facilities.
Landfill gas recovery remains important because it is embedded in the waste management infrastructure of regulated sites. Yet its long-term share is likely to come under pressure as diversion rules remove organics from landfills. Biogas upgrading is the fastest-growing technology segment and is projected to grow at a 11.1% CAGR through 2031, reflecting the stronger economics available in transport fuel and grid-injection pathways. Recent technical work points to lower energy use and higher gas purity across new upgrading designs, including four-column Vacuum Pressure Swing Adsorption (VPSA) systems and nanobubble-enhanced membrane approaches. Those improvements matter because higher methane purity and lower processing energy directly improve plant margins in the renewable gas from waste market. Gasification and pyrolysis remain part of the landscape. However, they are still more niche than anaerobic digestion and upgrading because their commercial base is smaller and their feedstock fit is narrower.
Complete Report Scope:
- By Feedstock
- Municipal Solid Waste (MSW)
- Agricultural Residues
- Animal Manure
- Industrial Organic Waste
- Sewage Sludge
- Food Waste
- Others
- By Technology
- Anaerobic Digestion
- Landfill Gas Recovery
- Gasification
- Pyrolysis
- Biogas Upgrading Systems
- Others
- By Gas Type
- Biogas
- Biomethane / Renewable Natural Gas (RNG)
- Syngas
- By Application
- Electricity Generation
- Combined Heat & Power (CHP)
- Grid Injection
- Transportation Fuel
- Industrial Heating
- Residential & Commercial Heating
- Others
- By Component
- Gas Collection Systems
- Digesters & Fermentation Systems
- Gas Processing & Upgrading Units
- Compressors & Storage Systems
- Power Generation Equipment
- Monitoring & Control Systems
- Others
- By Geography
- North America
- United States
- Canada
- Mexico
- South America
- Brazil
- Argentina
- Chile
- Rest of South America
- Europe
- Germany
- United Kingdom
- France
- Italy
- Spain
- Russia
- Benelux (Belgium, Netherlands, and Luxembourg)
- NORDICS (Denmark, Finland, Iceland, Norway, and Sweden)
- Rest of Europe
- Asia-Pacific
- China
- India
- Japan
- South Korea
- Australia
- Southeast Asia (Indonesia, Vietnam, Thailand, Malaysia, Philippines)
- Rest of Asia-Pacific
- Middle East & Africa
- United Arab Emirates
- Saudi Arabia
- South Africa
- Nigeria
- Rest of Middle East & Africa
- North America
Geography Analysis
Europe held 38.5% of the renewable gas from waste market share in 2025, making it the largest regional market in the current cycle. The region's lead comes from strong biomethane policy ambition, established digestion and upgrading assets, and broader gas network integration across multiple member states. REPowerEU's target of 35 bcm of biomethane per year by 2030, along with the estimated EUR 37 billion (USD 40 billion) investment requirement, continues to support long-term project pipelines across the region. Germany had approximately 9,605 biogas plants operating, including 290 biomethane upgrading facilities, which produced 12.8 TWh in 2025, demonstrating the depth of installed infrastructure in the region. At the same time, uneven national implementation and regulatory uncertainty in markets such as Germany continue to raise financing and execution risk for developers.
North America remained one of the most commercially advanced regions in the renewable gas from waste market, supported by the federal RFS, California's LCFS, state organics diversion rules, and a large installed base of landfill gas and anaerobic digestion projects. In 2025, USD 2.1 billion in new United States biogas investments came online, with landfill projects leading capital deployment and agriculture close behind, which shows that capital deployment is broadening across feedstock types. The United States also still has 470 landfills flaring gas that could be converted into RNG, preserving a visible near-term development pipeline for additional supply. Canada adds regional depth as provinces such as British Columbia and Ontario continue building biomethane procurement frameworks and municipal project support mechanisms.
Asia-Pacific is projected to expand at a 13.62% CAGR from 2026 to 2031, making it the fastest-growing region in the renewable gas from waste market. The region's growth is tied to rapid urbanization, rising organic waste volumes, and increasing policy standardization led by China. China's technical standard NB/T 11925-2025 took shape as part of a broader industrial push, while IEA (International Energy Agency) Bioenergy data show that current biomethane capacity remains far below the country's long-term resource potential. India and Southeast Asia are emerging as secondary growth centers as waste volumes rise and local project frameworks improve. South America, led by Brazil, is advancing landfill-gas development. At the same time, the Middle East and Africa remain early-stage markets with sizable volumes of uncaptured organic waste and more limited infrastructure. This regional mix leaves Europe as the largest revenue center, North America as a highly developed commercial base, and Asia-Pacific as the main runway for expansion through 2031.
- TotalEnergies SE
- Storengy SAS (ENGIE Group)
- Veolia Environnement S.A.
- SUEZ S.A.
- L'Air Liquide S.A.
- Gasum Oyj
- Waga Energy S.A.
- EnvITec Biogas AG
- Verbio SE
- Clean Energy Fuels Corp.
- Waste Management, Inc.
- Montauk Renewables, Inc.
- OPAL Fuels Inc.
- Gas Verde
- Orizon Valorizacao de Residuos S.A.
- Anaergia Inc.
- Future Biogas Ltd.
- Vanguard Renewables
- Shell plc
- bp plc
Additional Benefits:
- The market estimate (ME) sheet in Excel format
- 3 months of analyst support
TABLE OF CONTENTS
1 Introduction
- 1.1 Study Assumptions & Market Definition
- 1.2 Scope of the Study
2 Research Methodology
3 Executive Summary
4 Market Landscape
- 4.1 Market Overview
- 4.2 Market Drivers
- 4.2.1 Strict Methane-Emission Rules and Landfill-Gas Mandates Drive LFG-To-Energy Projects
- 4.2.2 Government Incentives Like RFS, LCFS, and Biomethane Tariffs Are Increasing
- 4.2.3 Corporate Decarbonization Pledges Boost Demand for Low-Carbon RNG
- 4.2.4 The Heavy-Duty Transport Sector Shifts To CNG/LNG Fueled by Landfill RNG
- 4.2.5 Urbanization And Food Waste Ensure a Steady Supply of Organic Waste
- 4.2.6 Advances In Biogas Upgrading Improve RNG Yield and Quality
- 4.3 Market Restraints
- 4.3.1 High Capital is Required for LFG Systems, Upgrading Plants, And Pipeline Connections
- 4.3.2 Landfill Gas Yields Decline as Waste Diversion and Recycling Improve
- 4.3.3 Inconsistent Regulations and Subsidies Create Market Fragmentation
- 4.3.4 Technical Issues Include Siloxane Contamination, Hydrogen Sulfide Removal, and Gas Quality Variability
- 4.4 Value / Supply-Chain Analysis
- 4.5 Regulatory Landscape
- 4.6 Technological Outlook
- 4.7 Porter's Five Forces
- 4.7.1 Threat of New Entrants
- 4.7.2 Bargaining Power of Suppliers
- 4.7.3 Bargaining Power of Buyers
- 4.7.4 Threat of Substitutes
- 4.7.5 Industry Rivalry
- 4.8 Impact of Artificial Intelligence-Powered Waste Collection on Service Providers' Revenue Growth
- 4.9 Consumer Behavior Shifts Toward Zero-Waste Lifestyles Influencing Service Demand
- 4.10 Impact of Geopolitical Events on the Market
5 Market Size & Growth Forecasts
- 5.1 By Feedstock
- 5.1.1 Municipal Solid Waste (MSW)
- 5.1.2 Agricultural Residues
- 5.1.3 Animal Manure
- 5.1.4 Industrial Organic Waste
- 5.1.5 Sewage Sludge
- 5.1.6 Food Waste
- 5.1.7 Others
- 5.2 By Technology
- 5.2.1 Anaerobic Digestion
- 5.2.2 Landfill Gas Recovery
- 5.2.3 Gasification
- 5.2.4 Pyrolysis
- 5.2.5 Biogas Upgrading Systems
- 5.2.6 Others
- 5.3 By Gas Type
- 5.3.1 Biogas
- 5.3.2 Biomethane / Renewable Natural Gas (RNG)
- 5.3.3 Syngas
- 5.4 By Application
- 5.4.1 Electricity Generation
- 5.4.2 Combined Heat & Power (CHP)
- 5.4.3 Grid Injection
- 5.4.4 Transportation Fuel
- 5.4.5 Industrial Heating
- 5.4.6 Residential & Commercial Heating
- 5.4.7 Others
- 5.5 By Component
- 5.5.1 Gas Collection Systems
- 5.5.2 Digesters & Fermentation Systems
- 5.5.3 Gas Processing & Upgrading Units
- 5.5.4 Compressors & Storage Systems
- 5.5.5 Power Generation Equipment
- 5.5.6 Monitoring & Control Systems
- 5.5.7 Others
- 5.6 By Geography
- 5.6.1 North America
- 5.6.1.1 United States
- 5.6.1.2 Canada
- 5.6.1.3 Mexico
- 5.6.2 South America
- 5.6.2.1 Brazil
- 5.6.2.2 Argentina
- 5.6.2.3 Chile
- 5.6.2.4 Rest of South America
- 5.6.3 Europe
- 5.6.3.1 Germany
- 5.6.3.2 United Kingdom
- 5.6.3.3 France
- 5.6.3.4 Italy
- 5.6.3.5 Spain
- 5.6.3.6 Russia
- 5.6.3.7 Benelux (Belgium, Netherlands, and Luxembourg)
- 5.6.3.8 NORDICS (Denmark, Finland, Iceland, Norway, and Sweden)
- 5.6.3.9 Rest of Europe
- 5.6.4 Asia-Pacific
- 5.6.4.1 China
- 5.6.4.2 India
- 5.6.4.3 Japan
- 5.6.4.4 South Korea
- 5.6.4.5 Australia
- 5.6.4.6 Southeast Asia (Indonesia, Vietnam, Thailand, Malaysia, Philippines)
- 5.6.4.7 Rest of Asia-Pacific
- 5.6.5 Middle East & Africa
- 5.6.5.1 United Arab Emirates
- 5.6.5.2 Saudi Arabia
- 5.6.5.3 South Africa
- 5.6.5.4 Nigeria
- 5.6.5.5 Rest of Middle East & Africa
- 5.6.1 North America
6 Competitive Landscape
- 6.1 Market Concentration
- 6.2 Strategic Moves
- 6.3 Market Share Analysis
- 6.4 Company Profiles (Includes Global Level Overview, Market Level Overview, Core Segments, Financials as Available, Strategic Information, Products & Services, and Recent Developments)
- 6.4.1 TotalEnergies SE
- 6.4.2 Storengy SAS (ENGIE Group)
- 6.4.3 Veolia Environnement S.A.
- 6.4.4 SUEZ S.A.
- 6.4.5 L'Air Liquide S.A.
- 6.4.6 Gasum Oyj
- 6.4.7 Waga Energy S.A.
- 6.4.8 EnviTec Biogas AG
- 6.4.9 Verbio SE
- 6.4.10 Clean Energy Fuels Corp.
- 6.4.11 Waste Management, Inc.
- 6.4.12 Montauk Renewables, Inc.
- 6.4.13 OPAL Fuels Inc.
- 6.4.14 Gas Verde
- 6.4.15 Orizon Valorizacao de Residuos S.A.
- 6.4.16 Anaergia Inc.
- 6.4.17 Future Biogas Ltd.
- 6.4.18 Vanguard Renewables
- 6.4.19 Shell plc
- 6.4.20 bp plc
7 Market Opportunities & Future Outlook
- 7.1 White-Space & Unmet-Need Assessment

 全球可再生天然氣市場規模、佔有率、趨勢和成長分析報告(2026-2034年)
 印度天然氣:市場佔有率分析、產業趨勢與統計及成長預測(2026-2031)天然氣燃料基礎設施:市場佔有率分析、產業趨勢與統計、成長預測(2026-2031 年)
 可再生天然氣市場分析及預測(至2035年):依類型、服務、技術、組件、應用、製程、部署、最終用戶、設備及解決方案分類可再生天然氣市場規模、佔有率、成長、全球產業分析、區域趨勢及2026年至2034年預測。
 天然氣充裝基礎設施市場:2026-2032年全球市場預測(依天然氣類型、站型、所有權、部署類型、應用程式和最終用戶分類)德國廢棄物製取可再生氣體:市場佔有率分析、產業趨勢與統計及成長預測(2026-2031 年)中國廢棄物衍生可再生氣體:市場佔有率分析、產業趨勢與統計及成長預測(2026-2031年)歐洲廢棄物衍生可再生氣體:市場佔有率分析、產業趨勢和統計數據以及成長預測(2026-2031 年)美國廢棄物衍生可再生氣體:市場佔有率分析、行業趨勢和統計數據以及成長預測(2026-2031 年)