


 |
市場調查報告書
商品編碼
2073206
美國廢棄物衍生可再生氣體:市場佔有率分析、行業趨勢和統計數據以及成長預測(2026-2031 年)United States Renewable Gas From Waste - Market Share Analysis, Industry Trends & Statistics, Growth Forecasts (2026 - 2031) |
||||||

※ 本網頁內容可能與最新版本有所差異。詳細情況請與我們聯繫。
根據 Mordor Intelligence 預測,美國廢棄物衍生可再生氣體市場規模預計將在 2025 年達到 48.2 億美元,2026 年達到 52.9 億美元,到 2031 年達到 89.8 億美元,2026 年至 2031 年的複合年成長率為 11.16%。
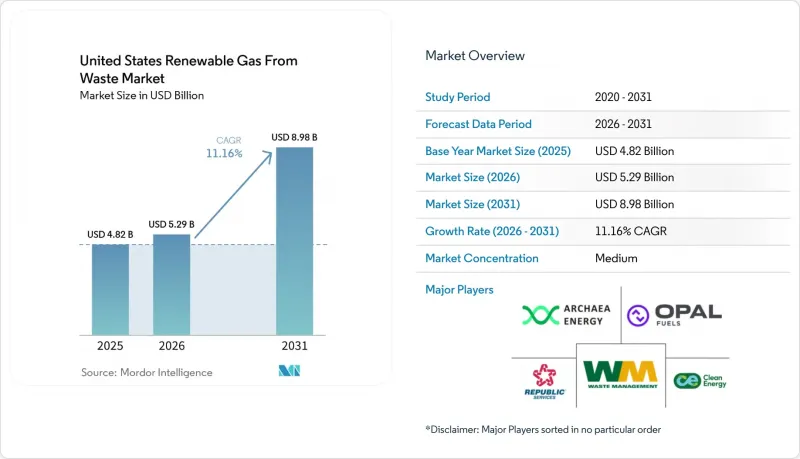
本報告依原料(都市固態廢棄物、畜禽糞便、食物廢棄物等)、技術(氣化、熱解等)、氣體種類(沼氣、合成氣等)、應用(發電、併網等)及組件(氣體回收、消化器/發酵等)分類。市場預測以美元計價。
美國廢棄物衍生可再生氣體市場的趨勢與洞察
IRA稅額扣抵鼓勵大規模資本注入。
根據《通貨膨脹控制法案》(IRA)第45Z條,無污染燃料生產稅額扣抵是美國廢棄物衍生可再生氣體市場企劃案融資的最大驅動力。與傳統的基於產量的機制不同,第45Z條將稅額扣抵的價值與生命週期內的碳排放掛鉤,這使得使用乳牛糞便和食物廢棄物的工藝比使用高碳原料的工藝具有明顯的經濟優勢。 「一項宏偉法案」將該稅額扣抵延長至2029年,顯著提高了從開發到運作需要5-7年的項目的資金籌措潛力。此外,美國財政部和國稅局(IRS)於2026年2月提案的一項法規草案確認,提煉成管道級生物甲烷的沼氣也將有資格獲得稅額扣抵,從而消除了市場資金籌措中最大的不確定性之一。這些抵免額的可轉讓性擴大了潛在買家的範圍。這一效應在 2025 年變得尤為明顯,屆時將有 40 個新的農場氣體系統和 20 個新的垃圾掩埋沼氣系統投入運作,總投資額達 17.5 億美元。
聯邦再生燃料標準 (RFS) 再生能源識別碼 (RIN) 信用額度改善了再生天然氣 (RNG) 專案的經濟效益。
在美國,可再生燃料標準 (RFS) 仍然是廢棄物衍生可再生天然氣市場的主要收入來源。 2026 年 3 月的最終規則規定,2026 年和 2027 年,受 RIN 約束的纖維素生質燃料總量分別為 13.6 億 RIN 和 14.3 億 RIN。該規則將 eRIN 排除在該計劃之外,縮小了合規途徑,並將需求主要集中在 RNG 專案生產的 D3 纖維素 RIN 上。此外,生物燃氣監管改革規則透過在 40 CFR 第 80 部分 E 子部分規定的運輸燃料示範要求中將 RIN 生產與 RNG 生產分開,降低了合規摩擦。市場需求已與此框架保持一致,預計到 2025 年,RNG 將占美國道路天然氣汽車燃料消費量的 94%,相當於 7.55 億加侖當量 (GGE),而總消費量為 8.06 億加侖當量 (GGE)。此外,汽車燃料中再生天然氣的使用量較去年同期成長了13%。監管政策的明朗化和燃料消耗量的穩定成長,持續為美國廢棄物衍生可再生天然氣市場的機構投資者提供了極具吸引力的項目盈利。
RFS價格波動和LCFS信用價格下跌正在對獲利前景產生負面影響。
美國廢棄物衍生可再生氣體市場的許多項目仍然依賴以聯邦再生能源識別碼 (RIN) 和加州低碳燃料標準 (LCFS) 積分為中心的複雜收入模式,這使得收入預測容易受到政策和價格波動的影響。 2026 年 4 月的最終規則將 2025 年纖維素生質燃料配額從 13.8 億 RIN 部分削減至 12.1 億 RIN,原因是產量低於預期。這表明,如果供應低於預期,美國環保署 (EPA) 願意減少配額。在 LCFS 方面,儘管 2025 年下半年連續兩季出現淨短缺,但平均年度積分價格仍維持在每噸 57 美元,低於 2024 年的平均價格 60 美元。這一差異反映出 2025 年底積分庫盈餘 3,969 萬噸,導致基於每噸 100 美元以上 LCFS 積分價格資金籌措的專案出現顯著的收入缺口。收入預測也受到第 45Z 節規定的臨時排放計算過程的影響,該過程延遲了尚未獲得碳強度評分的聯合消化項目的評估,因此這些項目無法獲得銀行融資。
細分市場分析
到2025年,都市固態廢棄物占美國可再生廢棄物市場佔有率的39.2%。這反映了美國各地掩埋氣回收系統長期以來的成熟應用。根據美國沼氣委員會統計,599座垃圾掩埋場每年生產5,590億立方英尺沼氣,2023年及2024年垃圾掩埋沼氣投資均超過10億美元。食物廢棄物是成長最快的原料,預計2026年至2031年複合年成長率將達到13.8%。這主要得益於2024年至2025年間,專用食物廢棄物消化設施的投資成長近三倍,達到3.25億美元,以及2025年沼氣回收量成長18%,達到280億立方英尺。這一趨勢表明,儘管有機物掩埋正在減少,成長動力轉向更分散的來源,但美國廢棄物衍生可再生氣體市場仍依賴成熟的掩埋設施。
由於低碳排放強度可享有更高的稅額扣抵(根據第45Z條規定),畜禽糞便,尤其是乳牛和豬的糞便,正迅速增加。污水污泥仍然是一種數量龐大且供應充足的原料,目前已有超過1240個水回收設施運作著厭氧消化池,但由於市政採購週期和基礎設施老化,新建設的速度正在放緩。工業有機廢棄物由於其原料供應穩定,在食品加工和飲料製造業的重要性日益凸顯。同時,理論上可以回收和提純的氣體仍在超過470個運作中的運作中被掩埋,這使得美國廢棄物衍生可再生氣體市場存在大量可衡量的項目。
預計到2025年,厭氧消化將佔41.8%的市場佔有率,並繼續保持領先地位,其在畜禽糞便、食物廢棄物、污水污泥和工業有機物處理方面均展現出卓越的成效。這一主導地位與專案設計的重大轉變密切相關,以農業為基礎的厭氧消化可再生天然氣(RNG)設施數量從2020年的90座增加到2025年的414座,五年內增加了360%。沼氣氣體純化系統是成長最快的技術領域,預計2026年至2031年的複合年成長率將達到12.3%。淨化技術的加速發展與以下事實相符:從2024年起,美國95%的新建沼氣計畫都將以生產RNG而非現場發電為目標。
掩埋氣回收仍然佔據技術組合的很大一部分。這得歸功於聯邦排放法規對大規模掩埋回收的支持,以及伊利諾州在2023年至2025年間大規模擴建掩埋氣體處理能力。氣化和熱解雖然目前應用規模較小,但正成為美國廢棄物衍生可再生氣體市場的新興選擇。它們在都市固態廢棄物和農業殘渣領域的應用尤其廣泛,因為傳統的消化方法在這些領域生物甲烷產量較低。隨著政策支持的擴大以及開發商尋求更有效的難消化原料商業化途徑,這些熱化學製程在發電領域正日益受到關注。 ASTM D8452及相關氣體品質標準持續影響商業設施的技術選擇,因為在升級和氣體輸送階段遵守品質標準也至關重要。
其他好處:
- Excel格式的市場預測(ME)表
- 3個月的分析師支持
目錄
第1章:引言
- 研究假設和市場定義
- 調查範圍
第2章:調查方法
第3章執行摘要
第4章 市場狀況
- 市場概覽
- 市場促進因素
- IRA稅額扣抵正在鼓勵大規模資本注入。
- 聯邦 RFS RIN 積分正在改善 RNG 計畫的經濟效益。
- 加州的低碳燃料標準:對負碳強度原料給予優先待遇
- 企業車隊的脫碳正在推動對再生天然氣的長期需求。
- 該州強制回收有機材料的做法正在增加原料的供應。
- 人工智慧帶來的電力需求成長提升了可調式沼氣的價值。
- 市場限制因素
- RFS價格波動和LCFS信用價格下跌正在對獲利前景產生負面影響。
- 聯邦政府政策缺乏透明度,導致最終投資決策延誤。
- 管道連接的延誤導致RNG專案運作延遲。
- 原料的地理分佈分散限制了經濟上可行的位置數量。
- 價值供應鏈分析
- 監理情勢
- 技術展望
- 波特五力模型
- 透過數位化原料管理和製程最佳化,提高可再生燃氣發電廠的效率。
- 制定有機廢棄物再利用和分類政策,以支持擴大原料供應
- 地緣政治事件對市場的影響
第5章 市場規模與成長預測
- 按原料
- 都市固態廢棄物(MSW)
- 農業殘餘物
- 牲畜糞便
- 工業有機廢棄物
- 污水污泥
- 食物廢棄物
- 其他
- 透過技術
- 厭氧消化
- 垃圾掩埋沼氣回收
- 氣化
- 熱解
- 沼氣氣體純化系統
- 其他
- 依氣體類型
- 沼氣
- 生物甲烷/可再生天然氣(RNG)
- 合成氣
- 透過使用
- 發電
- 熱電聯產(CHP)
- 注入電網
- 運輸燃料
- 工業加熱
- 住宅和商業供暖
- 其他
- 按組件
- 氣體收集系統
- 消化槽和發酵系統
- 氣體處理及淨化設備
- 壓縮機和儲能系統
- 發電設備
- 監控系統
- 其他
第6章 競爭情勢
- 市場集中度
- 策略趨勢
- 市佔率分析
- 公司簡介
- Archaea Energy
- Clean Energy Fuels Corp.
- Waste Management Inc.
- Republic Services
- OPAL Fuels
- Ameresco
- Vanguard Renewables
- Aemetis Biogas
- Montauk Renewables
- Brightmark
- Chesapeake Utilities Corporation
- Fortistar
- Amp Americas
- Rumpke Consolidated Companies
- GFL Environmental
- Reworld
- Kinder Morgan
- TotalEnergies
- DTE Vantage
- Morrow Renewables
第7章 市場機會與未來展望
According to Mordor Intelligence, the united states renewable gas from waste market size is projected to be USD 4.82 billion in 2025, USD 5.29 billion in 2026, and reach USD 8.98 billion by 2031, growing at a CAGR of 11.16% from 2026 to 2031.
This report is Segmented by Feedstock (Municipal Solid Waste, Animal Manure, Food Waste, and More), by Technology (Gasification, Pyrolysis, and More), by Gas Type (Biogas, Syngas, and More), by Application (Electricity Generation, Grid Injection, and More), and by Component (Gas Collection, Digesters & Fermentation, and More). The Market Forecasts are Provided in Terms of Value (USD).
United States Renewable Gas From Waste Market Trends and Insights
IRA Tax Credits Catalyzing Large-Scale Capital Deployment
The Inflation Reduction Act's Section 45Z clean fuel production credit has become the strongest project finance catalyst in the United States renewable gas from waste market. Unlike older volume-based structures, Section 45Z ties credit value to lifecycle carbon intensity, giving dairy manure and food waste pathways a clear economic edge over higher-carbon feedstocks. The One Big Beautiful Bill Act extended the credit through 2029, materially improving the bankability of projects that require 5 to 7 years from development to operation. The February 2026 proposed regulations from the United States Treasury and IRS also confirmed that biogas upgraded to pipeline-quality biomethane qualifies for the credit, removing one of the biggest financing uncertainties in the market. Transferability has widened the buyer pool for these credits, and this effect was evident in 2025, when 40 new farm-based systems and 20 new landfill gas systems came online, totaling a combined capital of USD 1.75 billion.
Federal RFS RIN Credits Boosting RNG Project Economics
The Renewable Fuel Standard remains the primary revenue stream for the United States renewable gas from waste market, and the March 2026 final rule set total applicable cellulosic biofuel volumes at 1.36 billion RINs for 2026 and 1.43 billion RINs for 2027. The same rule removed eRINs from the program, narrowing the compliance pathway and concentrating demand on D3 cellulosic RINs generated largely by RNG projects. The Biogas Regulatory Reform Rule also reduced compliance friction by decoupling RNG RIN generation from transportation fuel demonstration requirements under 40 CFR Part 80 Subpart E. Market demand has kept pace with that framework because 94% of all on-road natural gas vehicle fuel consumed in the United States in 2025 was RNG, equal to 755 million GGE out of 806 million GGE total, while RNG motor fuel use rose 13% year over year. This combination of regulatory clarity and verified fuel consumption continues to support project returns at levels that remain attractive to institutional capital in the United States renewable gas from waste market.
RFS Volatility and Declining LCFS Credit Prices Hurting Revenue Visibility
Many projects in the United States renewable gas from waste market still rely on a stacked revenue model built around federal RINs and California LCFS credits, which makes revenue forecasts sensitive to policy and pricing changes. The April 2026 final rule partially waived the 2025 cellulosic biofuel volume from 1.38 billion RINs to 1.21 billion RINs because production fell short, which showed that the EPA is willing to reduce obligations when supply does not meet expectations. On the LCFS side, the second half of 2025 produced two net-deficit quarters, yet the annual average credit price remained at USD 57 per metric ton, below the 2024 average of USD 60. That disconnect reflects the overhang from a 39.69 million metric ton credit bank at the end of 2025, leaving a meaningful revenue gap for projects underwritten at LCFS values above USD 100 per metric ton. Revenue visibility is further affected by the provisional emissions rate process under Section 45Z, which slows appraisal for co-digestion projects that still need a bankable carbon intensity score.
Other drivers and restraints analyzed in the detailed report include:
- California LCFS Rewarding Negative Carbon Intensity Feedstocks
- Corporate Fleet Decarbonization Driving Long-Term RNG Offtake
- Federal Policy Uncertainty Stalling Final Investment Decisions
For complete list of drivers and restraints, kindly check the Table Of Contents.
Segment Analysis
Municipal Solid Waste accounted for 39.2% of the United States renewable gas from waste market share in 2025, reflecting the long-established installed base of landfill gas capture systems across the country. The American Biogas Council counted 599 landfill gas facilities producing 559 billion cubic feet per year, and landfill biogas investment exceeded USD 1 billion annually in both 2023 and 2024. Food waste is the fastest-growing feedstock, with a forecast CAGR of 13.8% from 2026 to 2031, supported by a near tripling of investment in food waste-only digestion facilities between 2024 and 2025 to USD 325 million and an 18% rise in biogas capture to 28 billion cubic feet in 2025. This pattern shows that the United States renewable gas from waste market is still anchored by mature landfill assets even as organics diversion is shifting the growth center toward more distributed feedstocks.
Animal manure, especially dairy and swine waste, has grown rapidly because lower carbon-intensity scores translate into greater tax credit value under Section 45Z. Sewage sludge remains a large and widely available feedstock, with more than 1,240 water resource recovery facilities operating anaerobic digesters, although municipal procurement cycles and aging infrastructure slow new-build activity. Industrial organic waste is becoming more relevant in food processing and beverage operations, where feedstock supply is predictable. At the same time, more than 470 active landfills still flare gas that could, in theory, be captured and upgraded, leaving a measurable project pipeline for the United States renewable gas from waste market.
Anaerobic digestion held 41.8% share in 2025 and remains the lead technology because it is proven across manure, food waste, wastewater sludge, and industrial organics. That lead is tied to a major project design shift, as farm-based anaerobic digestion RNG facilities increased from 90 in 2020 to 414 in 2025, representing 360% growth in five years. Biogas upgrading systems are the fastest-growing technology segment, with a forecast CAGR of 12.3% from 2026 to 2031. The acceleration in upgrading is consistent with the fact that 95% of new United States biogas projects since 2024 have been designed for RNG production rather than onsite power generation.
Landfill gas recovery still accounts for a large share of the technology mix because federal emissions rules support capture at larger landfill sites, and Illinois added the most new landfill gas capacity from 2023 to 2025. Gasification and pyrolysis remain smaller but developing options in the United States renewable gas from waste market, especially for municipal solid waste and agricultural residues, where conventional digestion can deliver lower biomethane yield. These thermochemical routes are attracting attention for electricity generation as policy support broadens and developers seek better ways to monetize harder-to-digest feedstocks. Quality compliance also matters at the point of upgrading and injection, so ASTM D8452 and related gas quality standards continue to shape technology selection at commercial sites.
Complete Report Scope:
- By Feedstock
- Municipal Solid Waste (MSW)
- Agricultural Residues
- Animal Manure
- Industrial Organic Waste
- Sewage Sludge
- Food Waste
- Others
- By Technology
- Anaerobic Digestion
- Landfill Gas Recovery
- Gasification
- Pyrolysis
- Biogas Upgrading Systems
- Others
- By Gas Type
- Biogas
- Biomethane / Renewable Natural Gas (RNG)
- Syngas
- By Application
- Electricity Generation
- Combined Heat & Power (CHP)
- Grid Injection
- Transportation Fuel
- Industrial Heating
- Residential & Commercial Heating
- Others
- By Component
- Gas Collection Systems
- Digesters & Fermentation Systems
- Gas Processing & Upgrading Units
- Compressors & Storage Systems
- Power Generation Equipment
- Monitoring & Control Systems
- Others
List of Companies Covered in this Report:
- Archaea Energy
- Clean Energy Fuels Corp.
- Waste Management Inc.
- Republic Services
- OPAL Fuels
- Ameresco
- Vanguard Renewables
- Aemetis Biogas
- Montauk Renewables
- Brightmark
- Chesapeake Utilities Corporation
- Fortistar
- Amp Americas
- Rumpke Consolidated Companies
- GFL Environmental
- Reworld
- Kinder Morgan
- TotalEnergies
- DTE Vantage
- Morrow Renewables
Additional Benefits:
- The market estimate (ME) sheet in Excel format
- 3 months of analyst support
TABLE OF CONTENTS
1 Introduction
- 1.1 Study Assumptions & Market Definition
- 1.2 Scope of the Study
2 Research Methodology
3 Executive Summary
4 Market Landscape
- 4.1 Market Overview
- 4.2 Market Drivers
- 4.2.1 IRA Tax Credits Catalyzing Large-Scale Capital Deployment
- 4.2.2 Federal RFS RIN Credits Boosting RNG Project Economics
- 4.2.3 California LCFS Rewarding Negative Carbon Intensity Feedstocks
- 4.2.4 Corporate Fleet Decarbonization Driving Long-Term RNG Offtake
- 4.2.5 State Organics Diversion Mandates Expanding Feedstock Availability
- 4.2.6 AI-Driven Electricity Demand Strengthening Dispatchable Biogas Value
- 4.3 Market Restraints
- 4.3.1 RFS Volatility and Declining LCFS Credit Prices Hurting Revenue Visibility
- 4.3.2 Federal Policy Uncertainty Stalling Final Investment Decisions
- 4.3.3 Pipeline Interconnection Backlogs Delaying RNG Project Commissioning
- 4.3.4 Geographic Feedstock Dispersal Limiting Viable Economic-Scale Sites
- 4.4 Value / Supply-Chain Analysis
- 4.5 Regulatory Landscape
- 4.6 Technological Outlook
- 4.7 Porter's Five Forces
- 4.7.1 Threat of New Entrants
- 4.7.2 Bargaining Power of Suppliers
- 4.7.3 Bargaining Power of Buyers
- 4.7.4 Threat of Substitutes
- 4.7.5 Industry Rivalry
- 4.8 Digital Feedstock Management and Process Optimization Improving Renewable Gas Plant Efficiency
- 4.9 Organic Waste Diversion and Segregation Policies Supporting Feedstock Supply Growth
- 4.10 Impact of Geopolitical Events on the Market
5 Market Size & Growth Forecasts
- 5.1 By Feedstock
- 5.1.1 Municipal Solid Waste (MSW)
- 5.1.2 Agricultural Residues
- 5.1.3 Animal Manure
- 5.1.4 Industrial Organic Waste
- 5.1.5 Sewage Sludge
- 5.1.6 Food Waste
- 5.1.7 Others
- 5.2 By Technology
- 5.2.1 Anaerobic Digestion
- 5.2.2 Landfill Gas Recovery
- 5.2.3 Gasification
- 5.2.4 Pyrolysis
- 5.2.5 Biogas Upgrading Systems
- 5.2.6 Others
- 5.3 By Gas Type
- 5.3.1 Biogas
- 5.3.2 Biomethane / Renewable Natural Gas (RNG)
- 5.3.3 Syngas
- 5.4 By Application
- 5.4.1 Electricity Generation
- 5.4.2 Combined Heat & Power (CHP)
- 5.4.3 Grid Injection
- 5.4.4 Transportation Fuel
- 5.4.5 Industrial Heating
- 5.4.6 Residential & Commercial Heating
- 5.4.7 Others
- 5.5 By Component
- 5.5.1 Gas Collection Systems
- 5.5.2 Digesters & Fermentation Systems
- 5.5.3 Gas Processing & Upgrading Units
- 5.5.4 Compressors & Storage Systems
- 5.5.5 Power Generation Equipment
- 5.5.6 Monitoring & Control Systems
- 5.5.7 Others
6 Competitive Landscape
- 6.1 Market Concentration
- 6.2 Strategic Moves
- 6.3 Market Share Analysis
- 6.4 Company Profiles (Includes Global Level Overview, Market Level Overview, Core Segments, Financials as Available, Strategic Information, Products & Services, and Recent Developments)
- 6.4.1 Archaea Energy
- 6.4.2 Clean Energy Fuels Corp.
- 6.4.3 Waste Management Inc.
- 6.4.4 Republic Services
- 6.4.5 OPAL Fuels
- 6.4.6 Ameresco
- 6.4.7 Vanguard Renewables
- 6.4.8 Aemetis Biogas
- 6.4.9 Montauk Renewables
- 6.4.10 Brightmark
- 6.4.11 Chesapeake Utilities Corporation
- 6.4.12 Fortistar
- 6.4.13 Amp Americas
- 6.4.14 Rumpke Consolidated Companies
- 6.4.15 GFL Environmental
- 6.4.16 Reworld
- 6.4.17 Kinder Morgan
- 6.4.18 TotalEnergies
- 6.4.19 DTE Vantage
- 6.4.20 Morrow Renewables
7 Market Opportunities & Future Outlook
- 7.1 White-space & Unmet-Need Assessment

 全球可再生天然氣市場規模、佔有率、趨勢和成長分析報告(2026-2034年)
 印度天然氣:市場佔有率分析、產業趨勢與統計及成長預測(2026-2031)天然氣燃料基礎設施:市場佔有率分析、產業趨勢與統計、成長預測(2026-2031 年)
 可再生天然氣市場分析及預測(至2035年):依類型、服務、技術、組件、應用、製程、部署、最終用戶、設備及解決方案分類可再生天然氣市場規模、佔有率、成長、全球產業分析、區域趨勢及2026年至2034年預測。
 天然氣充裝基礎設施市場:2026-2032年全球市場預測(依天然氣類型、站型、所有權、部署類型、應用程式和最終用戶分類)德國廢棄物製取可再生氣體:市場佔有率分析、產業趨勢與統計及成長預測(2026-2031 年)中國廢棄物衍生可再生氣體:市場佔有率分析、產業趨勢與統計及成長預測(2026-2031年)廢棄物衍生可再生氣體:市場佔有率分析、行業趨勢和統計數據以及成長預測(2026-2031 年)歐洲廢棄物衍生可再生氣體:市場佔有率分析、產業趨勢和統計數據以及成長預測(2026-2031 年)