


 |
市場調查報告書
商品編碼
2073244
歐洲廢棄物衍生可再生氣體:市場佔有率分析、產業趨勢和統計數據以及成長預測(2026-2031 年)Europe Renewable Gas From Waste - Market Share Analysis, Industry Trends & Statistics, Growth Forecasts (2026 - 2031) |
||||||

※ 本網頁內容可能與最新版本有所差異。詳細情況請與我們聯繫。
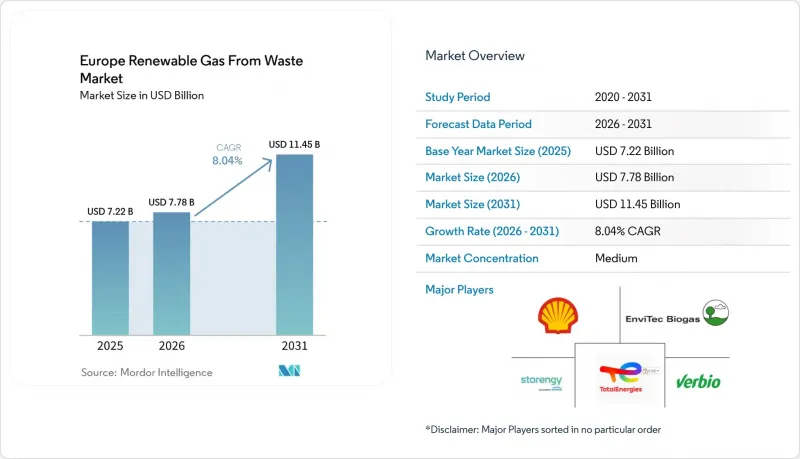
據 Mordor Intelligence 稱,2025 年歐洲廢棄物衍生可再生氣體市場價值為 72.2 億美元,預計到 2031 年將從 2026 年的 77.8 億美元成長至 114.5 億美元,預測期(2026-2031 年)複合年成長率為 8.04%。
本報告按原料(食物廢棄物、牲畜糞便等)、技術(氣化、熱解等)、氣體類型(沼氣等)、應用(發電、併網等)、組件(氣體回收、發電設備等)和地區(德國等)進行分類。市場預測以美元計價。
歐洲廢棄物衍生可再生氣體市場的趨勢與洞察
REPowerEU具有法律約束力的生物甲烷目標正在推動對廢棄物衍生氣體的投資。
REPowerEU計畫設定了2030年生物甲烷產量達到350億立方公尺的目標,顯著提高了歐洲可再生天然氣投資的政策確定性。這一目標遠超以往的政策預測,並為歐洲廢棄物衍生可再生天然氣市場帶來了更大、更永續的需求前景。相關投資需求預計為370億歐元(435億美元),顯示公共政策設想的是基礎建設規模的部署,而非分階段、試點計畫主導的擴張。 2026年4月,歐洲生物燃氣協會報告稱,畜禽糞便、農業殘餘物和工業污水合計佔歐洲技術上可實現生物甲烷潛力的81%,凸顯了取得廢棄物衍生原料對計畫經濟效益的重要性。這將改變投資者選擇投資機會的方式,因為擁有可靠廢棄物來源的開發商可以比那些仍然依賴公開市場生質能資源的開發商更快地推動專案。此外,將 2030 年目標轉化為具體財政援助和授權支持的國家措施可能意味著,未來幾年歐洲廢棄物衍生可再生氣體市場的專案決策將會加快。
歐盟禁止掩埋廚餘垃圾的政策擴大了厭氧消化所需的原料供應。
歐盟的《廢棄物框架指令》規定,自2024年1月1日起,所有成員國必須對廢棄物進行分類收集,以擴大厭氧消化計畫的正規供應基礎。這對歐洲廢棄物衍生可再生氣體市場具有重大意義,因為它降低了原料採購受作物產量和農產品價格季節性波動的影響。此外,《生物甲烷行動計畫》指出,避免廢棄物掩埋具有雙重益處:每減少一噸掩埋,就能生產可用的氣體,同時減少甲烷和二氧化碳當量排放。歐洲生物氣體協會已將德國、法國、義大利、波蘭和英國確定為生物甲烷潛力集中的關鍵地區,這些國家的生物廢棄物收集品質將對未來的供應產生至關重要的影響。歐盟仍預計,隨著其努力實現2030年將城市固體廢棄物掩埋率降至10%以下的目標,對掩埋的依賴程度將持續下降,這將進一步增加掩埋框架的壓力。隨著監管合規性日益嚴格,歐洲廢棄物衍生可再生氣體市場將受益於更穩定和規範的分類有機廢棄物供應鏈。
與批發天然氣相比,生產成本較低的劣勢依然存在。
在歐洲,透過厭氧消化生產生物甲烷的成本仍維持在每兆瓦時50至175歐元(每兆瓦時58.8至205.9美元),並且在預測期內的大部分時間裡,這一成本將繼續高於天然氣批發價格。牛津能源研究所於2026年1月指出,與2010年代相比,生產成本顯著下降的證據仍然有限,導致許多計畫仍依賴補助。與太陽能或風能相比,生物甲烷生產成本的降低更為困難,因為原料運輸成本、生物轉化的限制以及併網成本的下降速度遠不及製造硬體的成本。諸如產地保證(GO)和上網電價補貼(FIT)等支持措施有助於縮小這一差距,但其價值在不同國家之間仍然存在很大差異,導致商業性環境的差異。天然氣價格的下跌將進一步阻礙無補貼計畫的實現,尤其是在那些補貼更具選擇性的國家。因此,到 2031 年,歐洲廢棄物衍生可再生氣體市場尚未找到實現大規模、無補貼擴張的明確途徑。
細分市場分析
到2025年,都市固態廢棄物將佔歐洲廢棄物衍生可再生氣體市場的34.8%,成為該地區最大的原料類別。這一主導地位反映了德國、法國、荷蘭和英國在收集、分類和處理系統方面的成熟度。與較有限的農業和工業原料來源相比,這些成熟的城市廢棄物流為專案開發商提供了更穩定可靠的供應基礎。農業殘餘物和牲畜糞便仍然是第二大原料類別,其中糞便繼續享有監管優勢,因為根據RED III(可再生能源指令III),其在運輸燃料使用方面可享受雙重計算。工業有機廢棄物和污水污泥仍然是重要的中等規模類別,尤其是在污水基礎設施已經能夠減輕消化和氣體回收計畫資本負擔的地區。
在歐洲廢棄物衍生可再生氣體市場,預計食物廢棄物將實現最快成長,2026年至2031年的複合年成長率將達到9.9%。這一成長趨勢與歐盟強制性廢棄物收集政策密切相關,該政策穩步增加了可回收利用的食物廢棄物數量。這項政策支持也改善了以廢棄物廢棄物原料建設天然氣資產的開發商的長期原料供應前景。掩埋廢棄物仍佔據重要地位,尤其是在老舊掩埋,隨著掩埋和排放法規日益嚴格,甲烷回收有助於實現環境合規和能源回收目標。因此,原料構成正向能夠管理受監管有機物流動的廢物流運營商轉變,這鞏固了他們在整個歐洲廢棄物衍生可再生氣體市場中的地位。
2025年,厭氧消化在歐洲廢棄物衍生可再生氣體市場佔有45.1%的佔有率,並持續維持在全部區域領先技術平台的地位。這一地位基於其長期的營運經驗、完善的法律規範以及與來自城市、農業和工業的有機原料的廣泛相容性。該技術還具有產生消化殘渣的優勢,這可以支持生物肥料需求量大的工廠的經濟效益。掩埋氣回收利用仍然是第二大途徑,這得益於商業性可行性,它允許將現有掩埋改造為可再生氣體生產基地,而無需在新建的待開發區上建造厭氧消化設施。這種模式已在多個歐洲市場得到驗證,並採用貨櫃式升級裝置直接安裝在掩埋。氣化和熱解仍處於商業化初期,但在乾燥殘渣廢物流不適合消化處理的地區,它們仍然備受關注。
預計到2031年,氣體純化系統將以9.3%的複合年成長率成長,成為歐洲廢棄物衍生可再生氣體市場中成長最快的技術領域。主要促進因素是老舊沼氣廠向生物甲烷相容設施的改造,尤其是在德國,因為這些設施在補貼到期後尋求新的收入來源。與新建案(待開發區開發)相比,這種改造方式更具資本效率,因為消化製程已經到位,許多設施也已併入電網。這也符合從單純發電轉向更高附加價值氣體注入和用作運輸燃料的更廣泛趨勢。在整個歐洲,這一趨勢正在推動廢棄物衍生可再生氣體產業對膜系統、洗滌設備、壓縮機組和維修工程服務的需求成長。
其他好處:
- Excel格式的市場預測(ME)表
- 3個月的分析師支持
目錄
第1章:引言
- 研究假設和市場定義
- 調查範圍
第2章:調查方法
第3章執行摘要
第4章 市場狀況
- 市場概覽
- 市場促進因素
- REPowerEU具有法律約束力的生物甲烷目標正在促進對利用廢棄物生產氣體的投資。
- 歐盟禁止掩埋廚餘垃圾的政策擴大了厭氧消化所需的原料供應。
- 可調功率發電能力的下降正在推高對可儲存可再生天然氣的需求。
- 德國的EEG上網電價補貼計畫到期,引發了從沼氣到生物甲烷的大規模轉變。
- RED III 的雙重計算規則提高了交通運輸領域的商業性可行性。
- 碳排放交易體系中不斷上漲的碳價正在加速工業部門擺脫化石氣體的進程。
- 市場限制因素
- 與批發天然氣相比,生產成本持續處於劣勢
- 各國許可證制度的差異導致計畫運作延遲。
- 不相容的原產地登記制度阻礙了跨境貿易。
- 以有機廢棄物為原料的競爭限制了生質能的供應。
- 價值供應鏈分析
- 監理情勢
- 技術展望
- 波特五力模型
- 人工智慧驅動的廢棄物收集對服務供應商收入成長的影響
- 消費者行為轉向零浪費生活方式的轉變正在影響服務需求。
- 地緣政治事件對市場的影響
第5章 市場規模與成長預測
- 按原料
- 都市固態廢棄物(MSW)
- 農業殘餘物
- 牲畜糞便
- 工業有機廢棄物
- 污水污泥
- 食物廢棄物
- 其他
- 透過技術
- 厭氧消化
- 垃圾掩埋沼氣回收
- 氣化
- 熱解
- 沼氣氣體純化系統
- 其他
- 依氣體類型
- 沼氣
- 生物甲烷/可再生天然氣(RNG)
- 合成氣
- 透過使用
- 發電
- 熱電聯產(CHP)
- 注入電網
- 運輸燃料
- 工業加熱
- 住宅和商業供暖
- 其他
- 按組件
- 氣體收集系統
- 消化槽和發酵系統
- 氣體處理及淨化設備
- 壓縮機和儲能系統
- 發電設備
- 監控系統
- 其他
- 按地區
- 德國
- 英國
- 法國
- 義大利
- 西班牙
- 俄羅斯
- 比荷盧經濟聯盟(比利時、荷蘭、盧森堡)
- 北歐國家(丹麥、芬蘭、冰島、挪威、瑞典)
- 其他歐洲國家
第6章 競爭情勢
- 市場集中度
- 策略趨勢
- 市佔率分析
- 公司簡介
- Shell Plc
- EnviTec Biogas AG
- Verbio SE
- Storengy SAS
- TotalEnergies SE
- Waga Energy SA
- SUEZ SA
- Veolia Environnement SA
- Attero BV
- BALANCE Erneuerbare Energien GmbH
- Biogen(UK)Limited
- BTS Biogas Srl
- Gasum Oyj
- PlanET Biogas Group GmbH
- Enagas, SA
- Naturgy Energy Group, SA
- Archaea Energy
- Andion CH4 Holding BV
- Future Biogas Ltd
- SARIA SE & Co. KG
第7章 市場機會與未來展望
According to Mordor Intelligence, the europe renewable gas from waste market size was valued at USD 7.22 billion in 2025 and is estimated to grow from USD 7.78 billion in 2026 to reach USD 11.45 billion by 2031, at a CAGR of 8.04% during the forecast period (2026-2031).
This report is Segmented by Feedstock (Food Waste, Animal Manure, and More), by Technology (Gasification, Pyrolysis, and More), by Gas Type (Biogas, and More), by Application (Electricity Generation, Grid Injection, and More), by Component (Gas Collection, Power Generation Equipment, and More), and by Geography (Germany, and More). The Market Forecasts are Provided in Terms of Value (USD).
Europe Renewable Gas From Waste Market Trends and Insights
REPowerEU Binding Biomethane Target Driving Waste-to-Gas Investment
The REPowerEU plan set a target of 35 bcm of biomethane production by 2030, sharply raising policy certainty for renewable gas investment in Europe. That target is materially higher than earlier policy expectations, so it has given the Europe renewable gas from waste market a larger and more durable demand horizon. The related investment need was estimated at EUR 37 billion (USD 43.5 billion), indicating that public policy expects infrastructure-scale deployment rather than a gradual, pilot-led expansion. The European Biogas Association reported in April 2026 that animal manure, agricultural residues, and industrial wastewater together account for 81% of Europe's technically achievable biomethane potential, underscoring the importance of waste-linked feedstock access to project economics. This changes how investors screen opportunities, because developers with reliable access to waste streams can move faster than players still dependent on open-market biomass procurement. It also means national schemes that translate the 2030 target into funding and permitting support are likely to pull forward project decisions in the Europe renewable gas from waste market over the next several years.
European Union Biowaste Landfill Ban Expanding Anaerobic Digestion Feedstock Supply
The European Union Waste Framework Directive required separate biowaste collection across member states from January 1, 2024, which expanded the formal supply base for anaerobic digestion projects. This matters for the Europe renewable gas from waste market because feedstock access becomes less exposed to seasonal swings in crop output and agricultural commodity pricing. The Biomethane Action Plan also linked biowaste diversion to dual benefits: each tonne diverted from landfill can reduce methane and CO2-equivalent emissions while producing usable gas. The European Biogas Association identified Germany, France, Italy, Poland, and the United Kingdom as the main concentration of mobilizable biomethane potential, so collection quality in those countries will have an outsized effect on future supply. The landfill framework adds further pressure because the EU still expects landfill dependence to decline toward the 2030 target of no more than 10% of municipal waste. As compliance tightens, the Europe renewable gas from waste market stands to benefit from a steadier, more regulated flow of segregated organic waste.
Persistent Production Cost Disadvantage Relative to Wholesale Natural Gas
Biomethane production from anaerobic digestion in Europe still costs EUR 50 to EUR 175 per MWh (USD 58.8 to USD 205.9 per MWh), which remains above wholesale natural gas pricing for much of the forecast period. The Oxford Institute for Energy Studies stated in January 2026 that there is still limited evidence of meaningful reductions in production costs compared with the 2010s, which keeps subsidy dependence in place for many projects. This constraint is harder to solve than it was in solar or wind, because feedstock transport, biological conversion limits, and grid injection costs do not decline as quickly as manufactured hardware. Support instruments such as Guarantees of Origin and feed-in premiums help narrow the gap, but their value still varies widely across countries, creating uneven commercial conditions. Lower gas prices would further complicate the case for unsubsidized projects, especially in countries where support has become more selective. As a result, the Europe renewable gas from waste market is still not on a clear path to large-scale subsidy-free expansion by 2031.
Other drivers and restraints analyzed in the detailed report include:
- Declining Dispatchable Power Capacity Boosting Demand for Storable Renewable Gas
- German EEG Tariff Expiry Triggering Mass Biogas-to-Biomethane Conversion
- Fragmented National Permitting Frameworks Delaying Project Commissioning
For complete list of drivers and restraints, kindly check the Table Of Contents.
Segment Analysis
Municipal solid waste accounted for 34.8% of the Europe renewable gas from waste market in 2025, making it the largest feedstock group in the region. Its lead reflects the maturity of collection, sorting, and processing systems across Germany, France, the Netherlands, and the United Kingdom. These established municipal waste flows give project developers a more stable and visible supply base than several narrower agricultural or industrial streams. Agricultural residues and animal manure remained the next major feedstock block, and manure continues to benefit from a regulatory edge because RED III gives it double-counting status in transport fuel applications. Industrial organic waste and sewage sludge remained important middle-tier categories, especially where wastewater infrastructure already lowers the capital burden for digestion and gas recovery projects.
Food waste is projected to record the fastest growth at 9.9% CAGR from 2026 to 2031 in the Europe renewable gas from waste market. This trajectory is closely tied to the EU requirement for separate biowaste collection, which has steadily increased the volume of segregated food waste available for valorization. That policy support also improves long-term visibility into feedstocks for developers building urban and municipal waste-based gas assets. Landfill waste remains relevant, particularly at legacy sites, where methane capture serves both environmental compliance and energy recovery goals under tighter landfill and emissions rules. The feedstock mix is therefore moving toward waste-stream operators with control over regulated organic flows, which strengthens their position across the Europe renewable gas from waste market.
Anaerobic digestion held 45.1% of the Europe renewable gas from waste market share in 2025, keeping it as the leading technology platform across the region. Its position rests on a long operating history, an established regulatory framework, and broad compatibility with municipal, agricultural, and industrial organic feedstocks. The technology also benefits from digestate output, which can support plant economics where biofertilizer demand is present. Landfill gas recovery remained the second key route, supported by the commercial viability of converting existing landfill assets into renewable gas production sites without requiring greenfield anaerobic digestion development, a model demonstrated by containerized upgrading units deployed directly at landfill sites across several European markets. Gasification and pyrolysis remained earlier in the commercial cycle, but they continue to attract interest where dry residual waste streams are less suitable for digestion.
Biogas upgrading systems are projected to expand at 9.3% CAGR through 2031, making them the fastest-growing technology segment in the Europe renewable gas from waste market. The main driver is the conversion of older biogas plants into biomethane-capable assets, especially in Germany, as post-subsidy facilities seek new revenue pathways. This conversion route is more capital-efficient than greenfield development because the digestion process is already in place, and many sites already have grid access. It also fits the broader shift from electricity-only generation toward higher-value gas injection and transport fuel use. Across Europe, in the renewable gas from waste industry, that trend is improving demand for membrane systems, scrubbing units, compression packages, and retrofit engineering services.
Complete Report Scope:
- By Feedstock
- Municipal Solid Waste (MSW)
- Agricultural Residues
- Animal Manure
- Industrial Organic Waste
- Sewage Sludge
- Food Waste
- Others
- By Technology
- Anaerobic Digestion
- Landfill Gas Recovery
- Gasification
- Pyrolysis
- Biogas Upgrading Systems
- Others
- By Gas Type
- Biogas
- Biomethane / Renewable Natural Gas (RNG)
- Syngas
- By Application
- Electricity Generation
- Combined Heat & Power (CHP)
- Grid Injection
- Transportation Fuel
- Industrial Heating
- Residential & Commercial Heating
- Others
- By Component
- Gas Collection Systems
- Digesters & Fermentation Systems
- Gas Processing & Upgrading Units
- Compressors & Storage Systems
- Power Generation Equipment
- Monitoring & Control Systems
- Others
- By Geography
- Germany
- United Kingdom
- France
- Italy
- Spain
- Russia
- Benelux (Belgium, Netherlands, and Luxembourg)
- NORDICS (Denmark, Finland, Iceland, Norway, and Sweden)
- Rest of Europe
List of Companies Covered in this Report:
- Shell Plc
- EnvITec Biogas AG
- Verbio SE
- Storengy SAS
- TotalEnergies SE
- Waga Energy SA
- SUEZ SA
- Veolia Environnement S.A.
- Attero B.V.
- BALANCE Erneuerbare Energien GmbH
- Biogen (UK) Limited
- BTS Biogas Srl
- Gasum Oyj
- PlanET Biogas Group GmbH
- Enagas, S.A.
- Naturgy Energy Group, S.A.
- Archaea Energy
- Andion CH4 Holding BV
- Future Biogas Ltd
- SARIA SE & Co. KG
Additional Benefits:
- The market estimate (ME) sheet in Excel format
- 3 months of analyst support
TABLE OF CONTENTS
1 Introduction
- 1.1 Study Assumptions & Market Definition
- 1.2 Scope of the Study
2 Research Methodology
3 Executive Summary
4 Market Landscape
- 4.1 Market Overview
- 4.2 Market Drivers
- 4.2.1 REPowerEU Binding Biomethane Target Driving Waste-to-Gas Investment
- 4.2.2 European Union Biowaste Landfill Ban Expanding Anaerobic Digestion Feedstock Supply
- 4.2.3 Declining Dispatchable Power Capacity Boosting Demand for Storable Renewable Gas
- 4.2.4 German EEG Tariff Expiry Triggering Mass Biogas-to-Biomethane Conversion
- 4.2.5 RED III Double-Counting Provisions Enhancing Commercial Viability in Transport
- 4.2.6 Rising ETS Carbon Prices Accelerating Industrial Fossil Gas Substitution
- 4.3 Market Restraints
- 4.3.1 Persistent Production Cost Disadvantage Relative to Wholesale Natural Gas
- 4.3.2 Fragmented National Permitting Frameworks Delaying Project Commissioning
- 4.3.3 Incompatible Guarantee of Origin Registries Obstructing Cross-Border Trade
- 4.3.4 Organic Waste Feedstock Competition Constraining Biomass Availability
- 4.4 Value / Supply-Chain Analysis
- 4.5 Regulatory Landscape
- 4.6 Technological Outlook
- 4.7 Porter's Five Forces
- 4.7.1 Threat of New Entrants
- 4.7.2 Bargaining Power of Suppliers
- 4.7.3 Bargaining Power of Buyers
- 4.7.4 Threat of Substitutes
- 4.7.5 Industry Rivalry
- 4.8 Impact of Artificial Intelligence-Powered Waste Collection on Service Providers Revenue Growth
- 4.9 Consumer Behavior Shifts Toward Zero-Waste Lifestyles Influencing Service Demand
- 4.10 Impact of Geopolitical Events on the Market
5 Market Size & Growth Forecasts
- 5.1 By Feedstock
- 5.1.1 Municipal Solid Waste (MSW)
- 5.1.2 Agricultural Residues
- 5.1.3 Animal Manure
- 5.1.4 Industrial Organic Waste
- 5.1.5 Sewage Sludge
- 5.1.6 Food Waste
- 5.1.7 Others
- 5.2 By Technology
- 5.2.1 Anaerobic Digestion
- 5.2.2 Landfill Gas Recovery
- 5.2.3 Gasification
- 5.2.4 Pyrolysis
- 5.2.5 Biogas Upgrading Systems
- 5.2.6 Others
- 5.3 By Gas Type
- 5.3.1 Biogas
- 5.3.2 Biomethane / Renewable Natural Gas (RNG)
- 5.3.3 Syngas
- 5.4 By Application
- 5.4.1 Electricity Generation
- 5.4.2 Combined Heat & Power (CHP)
- 5.4.3 Grid Injection
- 5.4.4 Transportation Fuel
- 5.4.5 Industrial Heating
- 5.4.6 Residential & Commercial Heating
- 5.4.7 Others
- 5.5 By Component
- 5.5.1 Gas Collection Systems
- 5.5.2 Digesters & Fermentation Systems
- 5.5.3 Gas Processing & Upgrading Units
- 5.5.4 Compressors & Storage Systems
- 5.5.5 Power Generation Equipment
- 5.5.6 Monitoring & Control Systems
- 5.5.7 Others
- 5.6 By Geography
- 5.6.1 Germany
- 5.6.2 United Kingdom
- 5.6.3 France
- 5.6.4 Italy
- 5.6.5 Spain
- 5.6.6 Russia
- 5.6.7 Benelux (Belgium, Netherlands, and Luxembourg)
- 5.6.8 NORDICS (Denmark, Finland, Iceland, Norway, and Sweden)
- 5.6.9 Rest of Europe
6 Competitive Landscape
- 6.1 Market Concentration
- 6.2 Strategic Moves
- 6.3 Market Share Analysis
- 6.4 Company Profiles (Includes Global Level Overview, Market Level Overview, Core Segments, Financials as Available, Strategic Information, Products & Services, and Recent Developments)
- 6.4.1 Shell Plc
- 6.4.2 EnviTec Biogas AG
- 6.4.3 Verbio SE
- 6.4.4 Storengy SAS
- 6.4.5 TotalEnergies SE
- 6.4.6 Waga Energy SA
- 6.4.7 SUEZ SA
- 6.4.8 Veolia Environnement S.A.
- 6.4.9 Attero B.V.
- 6.4.10 BALANCE Erneuerbare Energien GmbH
- 6.4.11 Biogen (UK) Limited
- 6.4.12 BTS Biogas Srl
- 6.4.13 Gasum Oyj
- 6.4.14 PlanET Biogas Group GmbH
- 6.4.15 Enagas, S.A.
- 6.4.16 Naturgy Energy Group, S.A.
- 6.4.17 Archaea Energy
- 6.4.18 Andion CH4 Holding BV
- 6.4.19 Future Biogas Ltd
- 6.4.20 SARIA SE & Co. KG
7 Market Opportunities & Future Outlook
- 7.1 White-Space & Unmet-Need Assessment

 全球可再生天然氣市場規模、佔有率、趨勢和成長分析報告(2026-2034年)
 印度天然氣:市場佔有率分析、產業趨勢與統計及成長預測(2026-2031)天然氣燃料基礎設施:市場佔有率分析、產業趨勢與統計、成長預測(2026-2031 年)
 可再生天然氣市場分析及預測(至2035年):依類型、服務、技術、組件、應用、製程、部署、最終用戶、設備及解決方案分類可再生天然氣市場規模、佔有率、成長、全球產業分析、區域趨勢及2026年至2034年預測。
 天然氣充裝基礎設施市場:2026-2032年全球市場預測(依天然氣類型、站型、所有權、部署類型、應用程式和最終用戶分類)德國廢棄物製取可再生氣體:市場佔有率分析、產業趨勢與統計及成長預測(2026-2031 年)中國廢棄物衍生可再生氣體:市場佔有率分析、產業趨勢與統計及成長預測(2026-2031年)廢棄物衍生可再生氣體:市場佔有率分析、行業趨勢和統計數據以及成長預測(2026-2031 年)美國廢棄物衍生可再生氣體:市場佔有率分析、行業趨勢和統計數據以及成長預測(2026-2031 年)