


 |
市場調查報告書
商品編碼
2114387
數位戶外廣告:市場佔有率分析、產業趨勢與統計及成長預測(2026-2031 年)Digital Out Of Home (OOH) Advertising - Market Share Analysis, Industry Trends & Statistics, Growth Forecasts (2026 - 2031) |
||||||

※ 本網頁內容可能與最新版本有所差異。詳細情況請與我們聯繫。
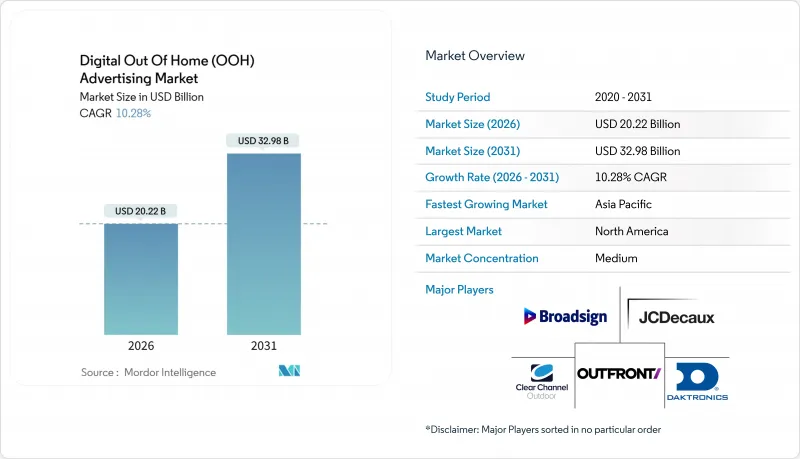
根據 Mordor Intelligence 預測,數位戶外(OOH) 廣告市場預計將在 2026 年達到 202.2 億美元,年複合成長率為 10.28%,並在 2031 年達到 329.8 億美元。
本報告按形式(數位看板、交通顯示器、街道設備、場所安裝螢幕)、螢幕技術(LED、LCD、投影、其他)、地點(戶外、室內)、終端用戶產業(零售、醫療/製藥、金融服務、汽車及其他終端用戶產業)和地區進行細分。市場預測以美元計價。
全球數位戶外廣告市場趨勢與洞察
亞太地區對智慧城市的投資正在推動程式化戶外數位廣告的普及。
新加坡、香港和越南的地方政府正將數位資訊亭和公車候車亭定位為“雙用途資產”,既能提供市民信息,又能同時創造廣告收入。新加坡政府科技局(GovTech)已將即時交通數據整合到1200塊地鐵螢幕上,使其能夠根據客流量在資訊顯示和付費訊息之間自動切換。香港的「智慧城市藍圖2.0」要求新建公共設施具備程式化廣告功能,以簡化本地品牌跨境廣告投放流程。河內2024年總體規劃累計12億美元,計畫至2028年在交通樞紐安裝5,000塊螢幕。長期特許經營協議有助於為快速數位轉型提供資金籌措,縮短投資回收期,並吸引私募股權投資。
利用 5G 進行即時內容傳送正在為北美高速公路旁的螢幕帶來新生。
目前,美國5G網路覆蓋率已達87%,延遲低於100毫秒,因此可根據交通狀況和天氣狀況自動切換廣告看板內容。行動電話營運商已部署超過15萬個5G基地台,其中許多位於高速公路沿線,從而降低了回程傳輸成本。廣告主看重這種柔軟性,因此將每千次展示成本(CPM)設定得比4G廣告位高出15%至20%。邊緣運算節點預先載入多個創新,即使需求端平台即時競標,也能確保流暢播放。
在歐盟,城市中心正在引入市政能源上限,以限制顯示器的亮度。
歐盟指令要求城市每年將公共部門能源消耗降低1.9%,因此催生了一系列法規,要求降低螢幕亮度或在夜間關閉。在巴黎,凌晨1點至早上6點強制停電,導致可用廣告空間減少20%,廣告商每年損失4,500萬歐元(約5,100萬美元)的收入。在阿姆斯特丹,夜間亮度被限制在300尼特,降低了能見度,迫使廣告商轉向價格更高的白天時段。出於環境方面的考慮,德國一些市政當局已開始拒絕批准新的商業數位電子看板安裝項目。這些區域法規正在割裂歐洲網路,並削弱程序化廣告效率賴以生存的規模經濟。
細分市場分析
預計到2031年,街頭設備收入將以11.20%的複合年成長率成長,超過所有其他形式的廣告。隨著倫敦、巴黎和新加坡特許經營協議的續簽,營運商被要求安裝數千個數位資訊亭,除了廣告之外,還提供公共Wi-Fi和交通資訊。這種模式透過將資本成本轉移給私人合作夥伴,同時確保長期權益,增強了廣告市場抵禦週期性波動的經濟韌性。數位廣告看板在收入方面仍然佔據主導地位,預計到2025年將佔據38%的市場佔有率,但分區法規阻礙了在住宅附近安裝新的數位廣告看板。交通顯示器在地鐵和機場等場所穩步成長,這些場所的乘客喜歡能夠吸引更多時間觀看的創新。健身房、電影院和校園場所的螢幕擴大了廣告商的覆蓋範圍,但由於所有權結構多樣,這些螢幕仍然較為分散。由於市政當局依賴私人資金,街道設備的雙重角色——公共服務和廣告——進一步鞏固了其發展軌跡。
營運商正日益將街道設備也設備基於臉部認證的票務試點計畫的基石,這在提高測量精度的同時,也引發了關於隱私的討論。這些協同效應最終形成了一種兼顧市民便利和商業性利益的模式,使其成為許多智慧城市總體規劃的核心。
高亮度和更低的面板成本將使LED在2025年佔據61%的銷售額,而投影和其他技術正以10.67%的複合年成長率成長。透明LED面板使零售商能夠將數位內容疊加到櫥窗展示上,從而將店外觸達範圍與店內互動融為一體。雷射投影和全像技術可在機場和旗艦店打造沉浸式體驗,而無需承受笨重面板的結構負擔。德國先導計畫已將能耗降低了99%,使其對那些面臨能源使用限制的城市極具吸引力。儘管由於眩光和能耗問題,戶外LCD的使用正在減少,但在菜單板和大廳等環境光線可控的區域,仍然存在一定的市場需求。
廣告商正擴大採用創新的投影方式開展體驗式宣傳活動,以在社群媒體上引發熱議。普華永道的研究表明,此類推廣活動的媒體價值是傳統數位廣告位的三倍以上。然而,營運商必須權衡創新差異化與維繫複雜性之間的關係。多樣化的硬體配置需要專業的服務團隊,增加了營運成本。隨著能源和光污染監管壓力的不斷增加,低功耗替代技術可能會比目前預期更快獲得市場佔有率。
區域分析
到2025年,北美將佔全球市場佔有率的34.50%。成熟的程式化廣告基礎設施、主要大都會圈的高CPM以及近乎全覆蓋的5G網路,使得動態路邊訊息的精準度堪比行動顯示器。加拿大的成長主要集中在多倫多、溫哥華和蒙特利爾,這些城市的地鐵特許經營收入為公共運輸運營提供了資金。墨西哥的發展較為緩慢,測量方法的差異阻礙了全球買家的進入,儘管墨西哥城購物中心的採用率正在上升。對人工智慧驅動的受眾追蹤的監管以及測量標準的標準化仍然是阻礙因素,可能會抑制短期成長。
亞太地區預計將以11.40%的複合年成長率成為全球成長最快的地區。在新加坡、香港和越南的智慧城市計畫中,數位電子看板被整合到公共基礎設施中,從而確保了穩定的公共資金來源。在中國的一線城市,維修項目正在將龐大的地鐵和公車網路數位化,但不斷上漲的地租正在擠壓營運商的利潤空間,並推動產業結構調整。日本東京和大阪的新興程序化廣告市場提供即時競價功能,吸引了尋求區域覆蓋的跨國廣告商。印度市場仍在發展中,但受益於快速的都市化以及從紙媒到數位廣告的廣泛轉變。
歐洲未來的發展取決於零售媒體網路的擴張和法律規範的不斷改進。雜貨店正在部署與會員資料相連的大規模店內螢幕,以滿足《數位服務法案》關於廣告透明度的要求。能源消耗限制迫使戶外廣告商在夜間降低螢幕亮度,導致廣告曝光量減少,廣告支出也隨之轉向室內環境。儘管面臨這些限制,倫敦、巴黎和柏林的地鐵系統仍在公私合營模式的支持下繼續推動數位轉型。在中東和非洲,由於阿拉伯聯合大公國和沙烏地阿拉伯等國主導的大型企劃,成長正在加速。在這些地區,作為城市總體規劃的一部分,數千塊螢幕正在旅遊和交通樞紐部署。南美洲的規模仍然較小,但巴西和智利正在加快步伐,正在進行購物中心和地鐵項目以抵消宏觀經濟波動的影響。
其他好處
- Excel格式的市場預測(ME)表
- 3個月的分析師支持
目錄
第1章:引言
- 研究假設和市場定義
- 調查範圍
第2章:調查方法
第3章執行摘要
第4章 市場狀況
- 市場概覽
- 市場促進因素
- 透過投資智慧城市,擴大亞太地區程式化數位戶外廣告的應用。
- 利用 5G 技術進行即時內容傳送,促進北美高速公路螢幕的使用。
- 透過發展零售媒體網路,促進歐洲店內數位戶外廣告的引進。
- 利用人工智慧驅動的受眾測量技術,提高主要交通樞紐廣告商的投資報酬率。
- 重視永續發展的品牌對碳中和LED顯示器表現出越來越濃厚的興趣。
- 一項旨在加速中東智慧城市戶外數位廣告支出的大型政府項目
- 市場限制因素
- 歐盟市政能源法規將限制城市中心顯示器的亮度持續時間
- 美國各地衡量標準不一,阻礙了跨網路程式化廣告購買。
- 由於城市地區租金飆升,中國一線城市廣告看板安裝成本不斷上漲。
- 全球快速消費品預算正因涉及偽造pDOOH廣告曝光量的廣告詐騙風險而面臨壓力。
- 宏觀經濟因素對市場的影響
- 監理展望
- 技術展望
- 產業價值鏈分析
- 波特五力分析
第5章 市場規模與成長預測
- 按形式
- 數位看板
- 交通展示
- 街道設備
- 安裝在場地或場所的螢幕
- 透過螢幕技術
- LED
- LCD
- 投影和其他
- 按位置
- 戶外的
- 室內的
- 按最終用戶行業分類
- 零售
- 醫療和藥品
- 金融服務
- 車
- 電信和公共產業
- 政府/公共部門
- 娛樂媒體
- 其他終端用戶產業
- 按地區
- 北美洲
- 美國
- 加拿大
- 墨西哥
- 南美洲
- 巴西
- 阿根廷
- 其他南美國家
- 歐洲
- 德國
- 英國
- 法國
- 義大利
- 西班牙
- 其他歐洲國家
- 亞太地區
- 中國
- 日本
- 韓國
- 印度
- 其他亞太國家
- 中東和非洲
- 中東
- 阿拉伯聯合大公國
- 沙烏地阿拉伯
- 其他中東國家
- 非洲
- 南非
- 其他非洲國家
- 中東
- 北美洲
第6章 競爭情勢
- 策略趨勢
- 供應商定位分析
- 公司簡介
- JCDecaux SA
- Clear Channel Outdoor Holdings, Inc.
- Outfront Media Inc.
- Lamar Advertising Company
- Stroer SE & Co. KGaA
- Talon Outdoor Limited
- oOh!media Limited
- QMS Media Limited
- Ocean Outdoor Limited
- Broadsign International, LLC
- Daktronics, Inc.
- SevenOne Media GmbH
- Asiaray Media Group Limited
- Pattison Outdoor Advertising LP
- Global Media & Entertainment Limited
- APG|SGA SA
- Exterion Media Group Limited
- AdShel Pty Ltd
- EyeMedia LLC
- E Ink Holdings Inc.
第7章 市場機會與未來展望
According to Mordor Intelligence, the digital out of home (OOH) advertising market size reached USD 20.22 billion in 2026 and is projected to advance at a 10.28% CAGR to USD 32.98 billion in 2031.
This report is Segmented by Format (Digital Billboards, Transit Displays, Street Furniture, and Place-Based and Venue Screens), Screen Technology (LED, LCD, Projection and Other), Location (Outdoor, and Indoor), End-User Vertical (Retail, Healthcare and Pharmaceuticals, Financial Services, Automotive, and More), and Geography. The Market Forecasts are Provided in Terms of Value (USD).
Global Digital Out Of Home (OOH) Advertising Market Trends and Insights
Smart-City Investments Driving Programmatic DOOH Uptake in Asia-Pacific
Municipal authorities in Singapore, Hong Kong, and Vietnam are treating digital kiosks and bus shelters as dual-use assets that deliver civic information and generate advertising revenue. Singapore's GovTech integrated real-time transit data with 1,200 metro screens, allowing inventory to toggle between way-finding and paid messaging depending on passenger flow. Hong Kong's Smart City Blueprint 2.0 mandates programmatic ad-serving capability for new public installations, streamlining cross-border buys for regional brands. Hanoi's 2024 master plan earmarked USD 1.2 billion for 5,000 screens in transit hubs by 2028. Long-tenure concessions encourage operators to finance rapid digitization, compressing payback periods and attracting private equity.
5G-Enabled Real-Time Content Delivery Boosting Highway Screens in North America
Nationwide 5G now covers 87% of the U.S. population, enabling sub-100-millisecond latency that allows billboards to swap creative based on traffic or weather triggers. Mobile carriers have installed more than 150,000 5G cell sites, many along highway corridors, reducing backhaul costs for operators. Advertisers reward the flexibility with 15-20% higher CPMs compared with 4G-connected inventory. Edge-compute nodes preload multiple creatives, ensuring seamless playback even when demand-side platforms bid in real time.
Municipal Energy Caps Restricting Screen Brightness Hours Across EU Urban Cores
EU directives require cities to cut public-sector energy use by 1.9% annually, prompting rules that force screens to dim or shut off overnight. Paris mandates shutdown from 1 AM to 6 AM, reducing available inventory by 20% and stripping EUR 45 million (USD 51 million) in yearly revenue from operators. Amsterdam caps brightness at 300 nits in evenings, lowering visibility and pushing advertisers to pricier daytime slots. German municipalities have begun denying permits for new commercial screens, citing environmental concerns. These localized rules fracture the European network, undercutting the scale economies on which programmatic efficiency depends.
Other drivers and restraints analyzed in the detailed report include:
- Retail Media Networks, Roll-Out Fueling In-Store DOOH Adoption in Europe
- AI-Based Audience Measurement Elevating Advertiser ROI in Transit Hubs
- Fragmented Measurement Standards Hindering Cross-Network Programmatic Buys in the U.S.
For complete list of drivers and restraints, kindly check the Table Of Contents.
Segment Analysis
Street furniture revenue is expected to climb at an 11.20% CAGR through 2031, outpacing all other formats. Concession renewals in London, Paris, and Singapore require operators to install thousands of digital kiosks that provide public Wi-Fi and transit data alongside advertising. This model secures long-term rights while shifting capital costs to private partners, increasing economic resilience against advertising cyclicality. Digital billboards remain dominant in sheer revenue because of 38% share in 2025, but zoning limits hinder fresh deployments near residential areas. Transit displays grow steadily inside metro and airport environments where captive audiences welcome longer dwell-time creative. Venue screens inside gyms, cinemas, and campuses broaden advertiser reach but remain fragmented due to varied ownership structures. As municipalities lean on private funding, the dual public-service and advertising role of street furniture further cements its growth trajectory.
Operators increasingly package street furniture within broader mobility ecosystems, using anonymized sensor data to coordinate public alerts and commercial content. This infrastructure-as-a-service positioning insulates contracts from backlash against pure commercial clutter. In Asia-Pacific, street furniture also serves as a springboard for facial-recognition ticketing pilots, raising privacy debates but enhancing measurement sophistication. The cumulative effect is a format that balances civic utility with commercial upside, making it the centerpiece of many smart-city master plans.
LED held 61% of 2025 revenue thanks to high brightness and falling panel costs, but projection and other technologies are pacing at 10.67% CAGR. Transparent LED tiles allow retailers to overlay digital content on window displays, merging out-of-store reach with in-store engagement. Laser projection and holography create immersive activations in airports and flagship stores without the structural load of heavy panels. Energy-efficient e-paper pilots in Germany consume 99% less power, appealing in cities grappling with energy caps. LCD usage is shrinking outdoors because of glare and power draw, but it retains a niche for menu boards and lobbies where ambient light is controlled.
Advertisers favor novel projection formats for experiential campaigns that generate social-media buzz. PwC research shows these activations deliver more than triple the earned-media value of conventional digital spots. Operators, however, must weigh creative differentiation against maintenance complexity. Diverse hardware fleets demand specialized service teams, increasing overhead. Yet as regulatory pressure intensifies around energy and light pollution, lower-power alternatives could gain share faster than current forecasts suggest.
Complete Report Scope:
- By Format
- Digital Billboards
- Transit Displays
- Street Furniture
- Place-Based and Venue Screens
- By Screen Technology
- LED
- LCD
- Projection and Other
- By Location
- Outdoor
- Indoor
- By End-User Vertical
- Retail
- Healthcare and Pharmaceuticals
- Financial Services
- Automotive
- Telecom and Utilities
- Government and Public Sector
- Entertainment and Media
- Other End-User Verticals
- By Geography
- North America
- United States
- Canada
- Mexico
- South America
- Brazil
- Argentina
- Rest of South America
- Europe
- Germany
- United Kingdom
- France
- Italy
- Spain
- Rest of Europe
- Asia-Pacific
- China
- Japan
- South Korea
- India
- Rest of Asia-Pacific
- Middle East and Africa
- Middle East
- United Arab Emirates
- Saudi Arabia
- Rest of Middle East
- Africa
- South Africa
- Rest of Africa
- Middle East
- North America
Geography Analysis
North America held 34.50% of value in 2025. Mature programmatic infrastructure, high CPMs in tier-1 metros, and nearly ubiquitous 5G coverage enable dynamic roadside messaging that rivals mobile display in precision. Canadian growth centers on Toronto, Vancouver, and Montreal, where subway concessions fund transit operations. Mexico's progress is slower because measurement fragmentation deters global buyers, although mall deployments in Mexico City are gaining traction. Regulatory scrutiny of AI audience tracking and measurement standardization remains a headwind, potentially tempering short-term gains.
Asia-Pacific is projected to register an 11.40% CAGR, the highest worldwide. Smart-city blueprints in Singapore, Hong Kong, and Vietnam embed digital signage into public infrastructure, ensuring reliable public funding streams. China's tier-1 renovation projects are digitizing vast subway and bus networks, although escalating land-lease fees compress operator margins and stimulate consolidation. Japan's new programmatic marketplace in Tokyo and Osaka provides real-time bidding, attracting multinational advertisers seeking regional scale. India remains nascent but benefits from rapid urbanization and a broad migration from print to digital placements.
Europe's trajectory hinges on retail media network expansion and evolving regulatory frameworks. Grocers deploy extensive in-store screens tied to loyalty data that satisfy Digital Services Act requirements for advertising transparency. Energy-consumption limits force outdoor operators to dim screens at night, reducing available impressions and shifting spend to indoor environments. Despite these constraints, metro systems in London, Paris, and Berlin continue to digitize, supported by public-private revenue-sharing models. The Middle East and Africa region accelerates through sovereign megaprojects in United Arab Emirates and Saudi Arabia, where urban master plans allocate thousands of screens as part of tourism and transit hubs. South America remains smaller but is picking up pace in Brazil and Chile, with mall and metro projects seeking to counterbalance macroeconomic volatility.
- JCDecaux SA
- Clear Channel Outdoor Holdings, Inc.
- Outfront Media Inc.
- Lamar Advertising Company
- Stroer SE & Co. KGaA
- Talon Outdoor Limited
- oOh!media Limited
- QMS Media Limited
- Ocean Outdoor Limited
- Broadsign International, LLC
- Daktronics, Inc.
- SevenOne Media GmbH
- Asiaray Media Group Limited
- Pattison Outdoor Advertising LP
- Global Media & Entertainment Limited
- APG|SGA SA
- Exterion Media Group Limited
- AdShel Pty Ltd
- EyeMedia LLC
- E Ink Holdings Inc.
Additional Benefits:
- The market estimate (ME) sheet in Excel format
- 3 months of analyst support
TABLE OF CONTENTS
1 INTRODUCTION
- 1.1 Study Assumptions and Market Definition
- 1.2 Scope of the Study
2 RESEARCH METHODOLOGY
3 EXECUTIVE SUMMARY
4 MARKET LANDSCAPE
- 4.1 Market Overview
- 4.2 Market Drivers
- 4.2.1 Smart-City Investments Driving Programmatic DOOH Uptake in Asia-Pacific
- 4.2.2 5G-Enabled Real-Time Content Delivery Boosting Highway Screen Utilisation in North America
- 4.2.3 Retail Media Networks' Roll-Out Fueling In-Store DOOH Adoption in Europe
- 4.2.4 AI-Based Audience Measurement Elevating Advertiser ROI in Major Transit Hubs
- 4.2.5 Carbon-Neutral LED Displays Attracting Sustainability-Focused Brands
- 4.2.6 Government Mega-Projects Accelerating DOOH Spend in Middle-East Smart Cities
- 4.3 Market Restraints
- 4.3.1 Municipal Energy Caps Restricting Screen Brightness Hours Across EU Urban Cores
- 4.3.2 Fragmented Measurement Standards Hindering Cross-Network Programmatic Buys in the U.S.
- 4.3.3 Escalating Urban Land-Lease Fees Raising Billboard Deployment Costs in Tier-1 Chinese Cities
- 4.3.4 Ad-Fraud Risks Around Spoofed pDOOH Impressions Curtailing Global FMCG Budgets
- 4.4 Impact of Macroeconomic Factors on the Market
- 4.5 Regulatory Outlook
- 4.6 Technological Outlook
- 4.7 Industry Value-Chain Analysis
- 4.8 Porter's Five Forces Analysis
- 4.8.1 Bargaining Power of Suppliers
- 4.8.2 Bargaining Power of Buyers
- 4.8.3 Threat of New Entrants
- 4.8.4 Threat of Substitutes
- 4.8.5 Intensity of Competitive Rivalry
5 MARKET SIZE AND GROWTH FORECASTS (VALUE)
- 5.1 By Format
- 5.1.1 Digital Billboards
- 5.1.2 Transit Displays
- 5.1.3 Street Furniture
- 5.1.4 Place-Based and Venue Screens
- 5.2 By Screen Technology
- 5.2.1 LED
- 5.2.2 LCD
- 5.2.3 Projection and Other
- 5.3 By Location
- 5.3.1 Outdoor
- 5.3.2 Indoor
- 5.4 By End-User Vertical
- 5.4.1 Retail
- 5.4.2 Healthcare and Pharmaceuticals
- 5.4.3 Financial Services
- 5.4.4 Automotive
- 5.4.5 Telecom and Utilities
- 5.4.6 Government and Public Sector
- 5.4.7 Entertainment and Media
- 5.4.8 Other End-User Verticals
- 5.5 By Geography
- 5.5.1 North America
- 5.5.1.1 United States
- 5.5.1.2 Canada
- 5.5.1.3 Mexico
- 5.5.2 South America
- 5.5.2.1 Brazil
- 5.5.2.2 Argentina
- 5.5.2.3 Rest of South America
- 5.5.3 Europe
- 5.5.3.1 Germany
- 5.5.3.2 United Kingdom
- 5.5.3.3 France
- 5.5.3.4 Italy
- 5.5.3.5 Spain
- 5.5.3.6 Rest of Europe
- 5.5.4 Asia-Pacific
- 5.5.4.1 China
- 5.5.4.2 Japan
- 5.5.4.3 South Korea
- 5.5.4.4 India
- 5.5.4.5 Rest of Asia-Pacific
- 5.5.5 Middle East and Africa
- 5.5.5.1 Middle East
- 5.5.5.1.1 United Arab Emirates
- 5.5.5.1.2 Saudi Arabia
- 5.5.5.1.3 Rest of Middle East
- 5.5.5.2 Africa
- 5.5.5.2.1 South Africa
- 5.5.5.2.2 Rest of Africa
- 5.5.5.1 Middle East
- 5.5.1 North America
6 COMPETITIVE LANDSCAPE
- 6.1 Strategic Developments
- 6.2 Vendor Positioning Analysis
- 6.3 Company Profiles (includes Global Level Overview, Market Level Overview, Core Segments, Financials as Available, Strategic Information, Market Rank/Share for Key Companies, Products & Services, and Recent Developments)
- 6.3.1 JCDecaux SA
- 6.3.2 Clear Channel Outdoor Holdings, Inc.
- 6.3.3 Outfront Media Inc.
- 6.3.4 Lamar Advertising Company
- 6.3.5 Stroer SE & Co. KGaA
- 6.3.6 Talon Outdoor Limited
- 6.3.7 oOh!media Limited
- 6.3.8 QMS Media Limited
- 6.3.9 Ocean Outdoor Limited
- 6.3.10 Broadsign International, LLC
- 6.3.11 Daktronics, Inc.
- 6.3.12 SevenOne Media GmbH
- 6.3.13 Asiaray Media Group Limited
- 6.3.14 Pattison Outdoor Advertising LP
- 6.3.15 Global Media & Entertainment Limited
- 6.3.16 APG|SGA SA
- 6.3.17 Exterion Media Group Limited
- 6.3.18 AdShel Pty Ltd
- 6.3.19 EyeMedia LLC
- 6.3.20 E Ink Holdings Inc.
7 MARKET OPPORTUNITIES AND FUTURE OUTLOOK
- 7.1 White-Space and Unmet-Need Assessment

 法國數位戶外廣告 (DOOH):市場佔有率分析、行業趨勢和統計數據以及成長預測 (2026-2031)亞太地區戶外數位廣告:市場佔有率分析、產業趨勢與統計及成長預測(2026-2031)中東和非洲數位戶外(DOOH):市場佔有率分析、行業趨勢和統計數據以及成長預測 (2026-2031)
 全球數位戶外廣告市場規模、佔有率、趨勢和成長分析報告(2026-2034年)全球數位戶外廣告市場規模、佔有率、趨勢和成長分析報告(2026-2034年)
 數位戶外(DOOH) 市場:按平台、媒體類型、螢幕尺寸、網路基礎設施、顯示類型和行業分類 - 全球預測,2026-2032 年英國戶外廣告和數位戶外廣告:市場佔有率分析、行業趨勢和統計數據以及成長預測(2026-2031 年)歐洲戶外廣告投放:市場佔有率分析、產業趨勢與統計及成長預測(2026-2031 年)新加坡戶外廣告 (OOH) 和數位戶外廣告 (DOOH):市場佔有率分析、行業趨勢和統計數據以及成長預測 (2026-2031)
 全球數位戶外廣告 (DOOH) 市場:按格式類型、位置類型、顯示技術、內容格式、採購模式、應用程式和廣告主規模分類 - 市場規模、行業動態、機會分析和預測 (2026–2035)