


 |
市場調查報告書
商品編碼
2124479
亞太地區戶外數位廣告:市場佔有率分析、產業趨勢與統計及成長預測(2026-2031)Asia-Pacific DOOH - Market Share Analysis, Industry Trends & Statistics, Growth Forecasts (2026 - 2031) |
||||||

※ 本網頁內容可能與最新版本有所差異。詳細情況請與我們聯繫。
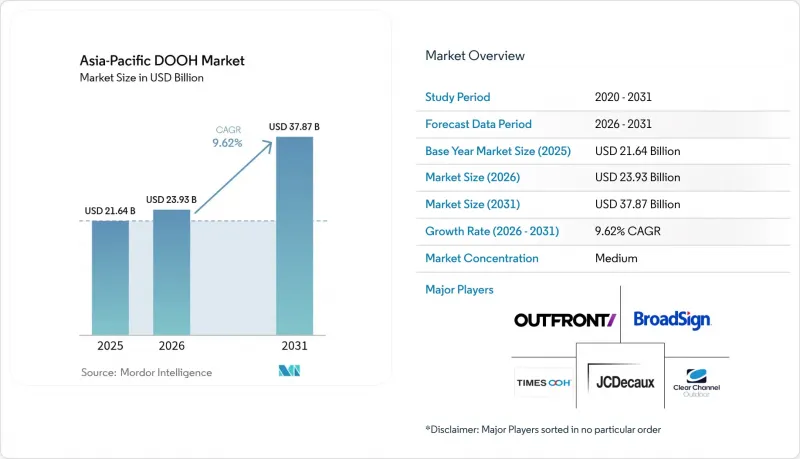
根據 Mordor Intelligence 預測,亞太地區 DOOH 市場規模預計將從 2025 年的 216.4 億美元成長到 2026 年的 239.3 億美元,然後在 2031 年達到 378.7 億美元,2026 年至 2031 年的複合年成長率為 9.62%。
本報告按服務類型(程序化和非程序化)、應用領域(廣告看板、公共交通、街道設施等)、安裝環境(戶外路邊、機場、購物中心/交通樞紐、店內/室內設施等)、終端用戶行業(汽車、零售、醫療保健、銀行、金融服務和保險等)以及地區進行細分。市場預測以美元計價。
亞太地區戶外數位廣告市場趨勢及洞察。
5G部署能夠實現高頻寬的創新。
在中國,到2025年底,已部署超過360萬個5G基地台,為戶外螢幕上的即時資料疊加和4K影片提供了必要的連接。同年,韓國也實現了全國範圍的5G覆蓋,使公共交通運營商能夠在高峰時段投放動態圖像。澳洲主要的電信業者正在將5G網路擴展到農村地區的關鍵路線,以支援面向長途旅行者的路邊程式化影片廣告看板。在日本,NTT Docomo已將5G定位服務與其數位戶外廣告(DOOH)網路整合,使宣傳活動能夠在人流密度增加時自動啟動。由此,打造了一個既能反映地點環境又能保持與線上影片媲美的影像品質的創新平台,使亞太地區的DOOH市場相對於靜態顯示形式具有顯著優勢。
城市軌道交通網路的快速擴張正在開闢優質廣告空間。
德里地鐵455公里長的線路在2024-2025會計年度創造了42億印度盧比(約合5000萬美元)的廣告收入,其中數位螢幕佔比高達68%。孟買地鐵三期工程新增33.5公里軌道,並將月台營運權授予Times Innovative Media,進一步提升了數位廣告在印度商業首都的滲透率。在中國,到2025年,城市軌道交通線路總里程將超過1萬公里,目前Focus Media已管理超過2000個車站的數位廣告權。泰國地鐵藍線和雅加達地鐵二期工程的延伸段新增了近500塊螢幕,為面向通勤者的品牌創造了新的廣告空間。由於乘客在車站內的停留時間更長,其每千次展示成本 (CPM) 比路邊廣告牌高出 40-60%,這使得公共交通廣告成為亞太地區戶外數位廣告市場成長最快的領域。
媒體所有權的片段化增加了廣告購買的複雜性。
印度擁有超過200家區域性戶外廣告營運商,但沒有一家的市場佔有率超過8%,這迫使廣告商不得不簽訂多份契約,並根據不同的螢幕規格調整廣告素材。泰國的情況也類似,市場分散,Plan B、Master Ad和VGI各自經營不同的設施,獨立進行銷售業務。印尼約有150家營運商,其中許多仍處於數位化階段,缺乏統一的衡量標準。這種分散化阻礙了亞太地區戶外數位廣告市場的成長,因為它提高了最低預算要求,並減緩了程式化廣告的擴張。為了實現順暢的廣告購買,產業整合或利用整合廣告位的第三方聚合平台變得至關重要。
細分市場分析
預計到2025年,程序化廣告庫存將佔總收入的32.17%,並以10.12%的複合年成長率(CAGR)成長,到2031年,其在亞太地區數位戶外廣告(DOOH)市場的佔有率預計將持續成長。澳洲引領程式化廣告的普及,在oOh!media和QMS Media推出自助服務入口網站後,該國31%的廣告支出已轉向程式化交易。新加坡緊隨其後,佔22%,Moving Walls與The Trade Desk和Google DV360建立了合作關係。中國目前佔比仍低於10%,因為Focus Media更傾向於直接交易,但人工智慧驅動的動態創新正在為逐步轉變奠定基礎。
在高階機場和公共交通廣告合約中,必須保證曝光量,因此非程序化廣告形式佔了67.83%的市場佔有率。德高集團在樟宜機場和香港國際機場的長期營運權,正是這種對專屬性的重視的體現。因此,亞太地區戶外數位廣告市場的市場佔有率組成正在演變為混合模式:程序化廣告形式推動了路邊和購物中心等地的收入成長,而直接銷售則負責獲取高價值的廣告位。
2025年,戶外廣告看板佔廣告支出的45.96%,但隨著地鐵網路日益密集,大眾運輸領域的廣告空間正迅速縮小差距。德里地鐵的286個車站創造了5000萬美元的廣告收入,其中數位螢幕佔68%。曼谷藍線和雅加達地鐵在過去兩年新增了近500個顯示器。因此,預計到2031年,亞太地區公共交通領域的戶外數位廣告市場將以11.67%的複合年成長率快速成長。
乘客在火車站的平均停留時間超過5分鐘,這使得廣告商能夠利用QR碼打造連貫的故事線和宣傳活動。雖然街頭廣告的市場佔有率較小,但它填補了超本地化的廣告空白,將路邊廣告覆蓋範圍與公共交通覆蓋範圍連接起來。憑藉其精準的定向投放能力,即使規模不如廣告看板或大眾運輸廣告,街頭廣告仍具有重要意義。
其他好處:
- Excel格式的市場預測(ME)表
- 3個月的分析師支持
目錄
第1章:引言
- 研究假設和市場定義
- 調查範圍
第2章:調查方法
第3章執行摘要
第4章 市場狀況
- 市場概覽
- 市場促進因素
- 5G的部署將催生利用高頻寬的創新應用。
- 城市軌道交通網路的快速擴張正在加速優質房產的供應。
- 程序化戶外數位廣告和零售媒體網路的整合
- LED成本的下降正在加速數位化進程。
- 一種低碳環保的螢幕,對注重環境、社會和治理(ESG)的廣告商很有吸引力。
- 品牌安全:從 Cookie 過渡到基於位置的身份驗證(數位戶外廣告)
- 市場限制因素
- 媒體所有權的分散化增加了購買的複雜性。
- 電力價格波動推高了營運成本。
- 資料隱私法規限制了行動重定向。
- 新興市場缺乏具備數位戶外廣告(DOOH)專業知識的創新人才
- 宏觀經濟因素的影響
- 監理情勢
- 波特五力分析
第5章 市場規模與成長預測
- 按服務類型
- 程式化數位戶外廣告
- 非程式化數位戶外廣告
- 透過使用
- 廣告看板
- 交通
- 街道設備
- 其他用途
- 位置和環境
- 戶外路邊
- 飛機場
- 購物中心和交通樞紐
- 商店內部及室內設施
- 其他位置環境
- 按最終用戶行業分類
- 車
- 零售
- 衛生保健
- 銀行與金融服務 (BFSI)
- 媒體與娛樂
- 其他終端用戶產業
- 按地區
- 中國
- 日本
- 印度
- 韓國
- 澳洲
- 新加坡
- 泰國
- 香港
- 其他亞太國家
第6章 競爭情勢
- 市場集中度
- 策略趨勢
- 市佔率分析
- 公司簡介
- JCDecaux SE
- Focus Media Information Technology Co. Ltd.
- Clear Channel Outdoor Holdings Inc.
- oOh!media Limited
- Outfront Media Inc.
- Times Innovative Media Limited
- Plan B Media Public Company Limited
- Asiaray Media Group Limited
- Shanghai Airports Advertisement Co. Ltd.
- Balintimes Media Group Co. Ltd.
- Hivestack Inc.
- Vistar Media Inc.
- Daktronics Inc.
- Broadsign International LLC
- QMS Media Limited
- AdOnMo Private Limited
- Laqshya Media Group
- Moving Walls Pte Ltd.
- Big Tree Outdoor Sdn Bhd
- UP Media(Thailand)Co. Ltd.
第7章 市場機會與未來展望
According to Mordor Intelligence, the Asia-Pacific DOOH market size is expected to grow from USD 21.64 billion in 2025 to USD 23.93 billion in 2026 and is forecast to reach USD 37.87 billion by 2031 at a 9.62% CAGR over 2026-2031.
This report is Segmented by Service Type (Programmatic-OOH, and Non-Programmatic-OOH), Application (Billboard, Transit, Street Furniture, and More), Location Environment (Roadside Outdoor, Airports, Malls and Transit Hubs, In-Store and Indoor Venues, and More), End-User Industry (Automotive, Retail, Healthcare, BFSI and More), and Geography. The Market Forecasts are Provided in Terms of Value (USD).
Asia-Pacific DOOH Market Trends and Insights
5G Roll-Out Enabling High-Bandwidth Creative
China deployed more than 3.6 million 5G base stations by late 2025, giving outdoor screens the connectivity needed for live data overlays and 4K video. South Korea reached nationwide 5G coverage the same year, which allowed transit operators to stream motion graphics during peak commutes. Australia's major carriers extended 5G to regional corridors, supporting roadside programmatic video billboards targeted at long-distance travelers. Japan's NTT Docomo paired 5G positioning services with DOOH networks so campaigns can trigger automatically when pedestrian density rises. The result is a creative canvas that mirrors online video quality while preserving location context, giving the Asia-Pacific DOOH market a distinctive edge over static display formats.
Rapid Urban Rail Expansion Opening Premium Inventory
Delhi Metro's 455-kilometer network generated INR 4.2 billion (USD 50 million) in advertising revenue in FY 2024-25, with digital screens accounting for 68% of inventory. Mumbai Metro Phase III added 33.5 kilometers of track and awarded platform concessions to Times Innovative Media, raising digital penetration in India's commercial capital. China surpassed 10,000 kilometers of urban rail by 2025, and Focus Media now controls digital rights at more than 2,000 stations. Thailand's MRT Blue Line extension and Jakarta's MRT Phase II together installed nearly 500 new screens, creating fresh inventory for brands targeting commuters. High dwell times inside stations are producing CPMs 40-60% above roadside panels, making transit the fastest-growing slice of the Asia-Pacific DOOH market.
Fragmented Media Ownership Inflating Buying Complexity
India hosts more than 200 regional operators, none with more than 8% national share, forcing advertisers to negotiate multiple contracts and adapt artwork for divergent screen specs. Thailand shows similar dispersion, with Plan B, Master Ad and VGI controlling different venues and selling in silos. Indonesia counts roughly 150 operators, many still offline, and lacks uniform measurement protocols. The fragmentation raises the minimum viable budget and slows programmatic scale, tempering growth in the Asia-Pacific DOOH market. Consolidation, or third-party aggregators that pool inventory, is emerging as a prerequisite for frictionless buying.
Other drivers and restraints analyzed in the detailed report include:
- Programmatic DOOH Integration with Retail Media Networks
- LED Cost Decline Accelerating Digital Conversion
- Power-Price Volatility Raising Operating Costs
For complete list of drivers and restraints, kindly check the Table Of Contents.
Segment Analysis
Programmatic inventory represented 32.17% of 2025 revenue, and its 10.12% CAGR positions it to capture a growing slice of the Asia-Pacific DOOH market size through 2031. Australia leads adoption, with 31% of national spend transacted programmatically after oOh!media and QMS Media launched self-serve portals. Singapore follows at 22% as Moving Walls links to The Trade Desk and Google DV360. China remains under 10% because Focus Media favors direct deals, but AI-assisted dynamic creative is laying groundwork for gradual change.
Non-programmatic formats retain 67.83% share because premium airport and transit contracts demand guaranteed impression volumes. JCDecaux's long-term concessions at Changi and Hong Kong International exemplify this preference for exclusivity. The Asia-Pacific DOOH market share split is therefore evolving into a hybrid model where programmatic drives incremental roadside and mall yield while direct sales secure high-value hubs.
Billboard screens accounted for 45.96% of 2025 spend, but transit inventory is closing the gap quickly as metro-rail density rises. Delhi Metro's 286 stations generated USD 50 million in ad revenue, and digital screens supplied 68% of that total. Bangkok's Blue Line and Jakarta's MRT added nearly 500 new displays in the last two years. As a result, the Asia-Pacific DOOH market size for transit is projected to jump at an 11.67% CAGR through 2031.
The captive dwell time in stations averages over five minutes, letting advertisers deliver sequential storytelling or QR-code activations. Street-furniture formats, while smaller in share, knit together roadside and transit reach by filling hyper-local gaps. Their granular targeting will keep them relevant even if they never match the scale of billboards and transit.
Complete Report Scope:
- By Service Type
- Programmatic-DOOH
- Non-Programmatic-DOOH
- By Application
- Billboard
- Transit
- Street Furniture
- Other Applications
- By Location Environment
- Roadside Outdoor
- Airports
- Malls and Transit Hubs
- In-Store and Indoor Venues
- Other Location Environments
- By End-User Industry
- Automotive
- Retail
- Healthcare
- Banking and Financial Services (BFSI)
- Media and Entertainment
- Other End-User Industries
- By Geography
- China
- Japan
- India
- South Korea
- Australia
- Singapore
- Thailand
- Hong Kong
- Rest of Asia-Pacific
List of Companies Covered in this Report:
- JCDecaux SE
- Focus Media Information Technology Co. Ltd.
- Clear Channel Outdoor Holdings Inc.
- oOh!media Limited
- Outfront Media Inc.
- Times Innovative Media Limited
- Plan B Media Public Company Limited
- Asiaray Media Group Limited
- Shanghai Airports Advertisement Co. Ltd.
- Balintimes Media Group Co. Ltd.
- Hivestack Inc.
- Vistar Media Inc.
- Daktronics Inc.
- Broadsign International LLC
- QMS Media Limited
- AdOnMo Private Limited
- Laqshya Media Group
- Moving Walls Pte Ltd.
- Big Tree Outdoor Sdn Bhd
- UP Media (Thailand) Co. Ltd.
Additional Benefits:
- The market estimate (ME) sheet in Excel format
- 3 months of analyst support
TABLE OF CONTENTS
1 INTRODUCTION
- 1.1 Study Assumptions and Market Definition
- 1.2 Scope of the Study
2 RESEARCH METHODOLOGY
3 EXECUTIVE SUMMARY
4 MARKET LANDSCAPE
- 4.1 Market Overview
- 4.2 Market Drivers
- 4.2.1 5G Roll-out Enabling High-Bandwidth Creative
- 4.2.2 Rapid Urban Rail Expansion Opening Premium Inventory
- 4.2.3 Programmatic DOOH Integration with Retail Media Networks
- 4.2.4 LED Cost Decline Accelerating Digital Conversion
- 4.2.5 Carbon-Efficient Screens Appealing to ESG-Driven Advertisers
- 4.2.6 Brand-Safety Shift from Cookies to Location-Verified DOOH
- 4.3 Market Restraints
- 4.3.1 Fragmented Media Ownership Inflating Buying Complexity
- 4.3.2 Power-Price Volatility Raising Operating Costs
- 4.3.3 Data-Privacy Regulations Limiting Mobile Retargeting
- 4.3.4 Shortage of DOOH-Skilled Creatives in Emerging Markets
- 4.4 Impact of Macroeconomic Factors
- 4.5 Regulatory Landscape
- 4.6 Porter's Five Forces Analysis
- 4.6.1 Bargaining Power of Suppliers
- 4.6.2 Bargaining Power of Buyers
- 4.6.3 Threat of New Entrants
- 4.6.4 Threat of Substitutes
- 4.6.5 Intensity of Competitive Rivalry
5 MARKET SIZE AND GROWTH FORECASTS (VALUE)
- 5.1 By Service Type
- 5.1.1 Programmatic-DOOH
- 5.1.2 Non-Programmatic-DOOH
- 5.2 By Application
- 5.2.1 Billboard
- 5.2.2 Transit
- 5.2.3 Street Furniture
- 5.2.4 Other Applications
- 5.3 By Location Environment
- 5.3.1 Roadside Outdoor
- 5.3.2 Airports
- 5.3.3 Malls and Transit Hubs
- 5.3.4 In-Store and Indoor Venues
- 5.3.5 Other Location Environments
- 5.4 By End-User Industry
- 5.4.1 Automotive
- 5.4.2 Retail
- 5.4.3 Healthcare
- 5.4.4 Banking and Financial Services (BFSI)
- 5.4.5 Media and Entertainment
- 5.4.6 Other End-User Industries
- 5.5 By Geography
- 5.5.1 China
- 5.5.2 Japan
- 5.5.3 India
- 5.5.4 South Korea
- 5.5.5 Australia
- 5.5.6 Singapore
- 5.5.7 Thailand
- 5.5.8 Hong Kong
- 5.5.9 Rest of Asia-Pacific
6 COMPETITIVE LANDSCAPE
- 6.1 Market Concentration
- 6.2 Strategic Moves
- 6.3 Market Share Analysis
- 6.4 Company Profiles (includes Global Level Overview, Market Level Overview, Core Segments, Financials as available, Strategic Information, Market Rank/Share, Products and Services, Recent Developments)
- 6.4.1 JCDecaux SE
- 6.4.2 Focus Media Information Technology Co. Ltd.
- 6.4.3 Clear Channel Outdoor Holdings Inc.
- 6.4.4 oOh!media Limited
- 6.4.5 Outfront Media Inc.
- 6.4.6 Times Innovative Media Limited
- 6.4.7 Plan B Media Public Company Limited
- 6.4.8 Asiaray Media Group Limited
- 6.4.9 Shanghai Airports Advertisement Co. Ltd.
- 6.4.10 Balintimes Media Group Co. Ltd.
- 6.4.11 Hivestack Inc.
- 6.4.12 Vistar Media Inc.
- 6.4.13 Daktronics Inc.
- 6.4.14 Broadsign International LLC
- 6.4.15 QMS Media Limited
- 6.4.16 AdOnMo Private Limited
- 6.4.17 Laqshya Media Group
- 6.4.18 Moving Walls Pte Ltd.
- 6.4.19 Big Tree Outdoor Sdn Bhd
- 6.4.20 UP Media (Thailand) Co. Ltd.
7 MARKET OPPORTUNITIES AND FUTURE OUTLOOK
- 7.1 White-Space and Unmet-Need Assessment

 法國數位戶外廣告 (DOOH):市場佔有率分析、行業趨勢和統計數據以及成長預測 (2026-2031)中東和非洲數位戶外(DOOH):市場佔有率分析、行業趨勢和統計數據以及成長預測 (2026-2031)
 全球數位戶外廣告市場規模、佔有率、趨勢和成長分析報告(2026-2034年)全球數位戶外廣告市場規模、佔有率、趨勢和成長分析報告(2026-2034年)數位戶外廣告:市場佔有率分析、產業趨勢與統計及成長預測(2026-2031 年)
 數位戶外(DOOH) 市場:按平台、媒體類型、螢幕尺寸、網路基礎設施、顯示類型和行業分類 - 全球預測,2026-2032 年英國戶外廣告和數位戶外廣告:市場佔有率分析、行業趨勢和統計數據以及成長預測(2026-2031 年)歐洲戶外廣告投放:市場佔有率分析、產業趨勢與統計及成長預測(2026-2031 年)新加坡戶外廣告 (OOH) 和數位戶外廣告 (DOOH):市場佔有率分析、行業趨勢和統計數據以及成長預測 (2026-2031)
 全球數位戶外廣告 (DOOH) 市場:按格式類型、位置類型、顯示技術、內容格式、採購模式、應用程式和廣告主規模分類 - 市場規模、行業動態、機會分析和預測 (2026–2035)