


 |
市場調查報告書
商品編碼
2114143
自助倉儲:市場佔有率分析、產業趨勢與統計、成長預測(2026-2031)Self Storage - Market Share Analysis, Industry Trends & Statistics, Growth Forecasts (2026 - 2031) |
||||||

※ 本網頁內容可能與最新版本有所差異。詳細情況請與我們聯繫。
據 Mordor Intelligence 稱,以可出租面積計算,自助倉儲市場預計將從 2025 年的 25.9 億平方英尺擴大到 2026 年的 26.9 億平方英尺,到 2031 年達到 31.8 億平方英尺,2026 年至 2031 年的複合年成長率為 3.41%。
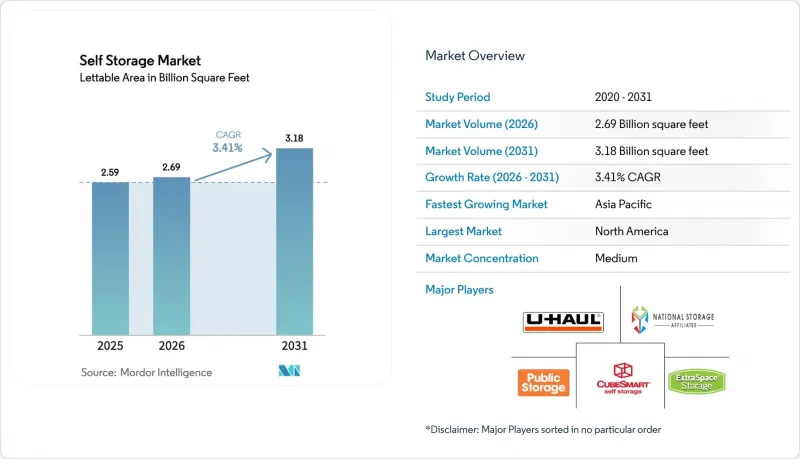
本報告按使用者類型(個人、企業)、儲存類型(溫控、非溫控、其他)、租賃期限(短期、中期、長期)、單元規模(小型、中型、大型、超大型)和地區(北美、南美、歐洲、亞太、中東和非洲)進行細分。市場預測以容量(平方英尺)為單位。
全球自助倉儲市場趨勢及洞察
都市化與生活空間縮小
到2025年,東京、香港和上海的公寓占地面積將不到500平方英尺(約46平方公尺),迫使居民將大件物品存放於異地。這些城市的自助倉儲普及率將達到人均1.5平方英尺(約1.4平方公尺),是擁有車庫的郊區平均水準的三倍。新加坡和孟買的開發商正在將樓內倉儲設施納入綜合用途大樓,並加收8%的租金附加費。亞太地區的都市化率已超過65%,自助倉儲不再只是一種選擇,而是一種結構性需求。北美城市中心也出現了類似的趨勢,儘管宏觀經濟環境有所放緩,但需求仍然強勁。
小規模電子商務經銷商激增
2025年的一項調查顯示,年銷售額低於50萬美元的線上經銷商中,有38%選擇將庫存存放在自助倉儲而非傳統倉庫。由於能夠自行駕車裝卸貨物並接收小包裹,這些租戶的平均存放時間比傳統倉庫長40%,且支付的費用也高出25%至35%。溫度和濕度控制對於電子產品和化妝品至關重要,這使得自助倉儲業者能夠比標準倉儲空間收取高出50%至80%的費用。小規模企業對經濟週期具有較強的適應能力,因為裁員會促使人們創造兼職工作,並在景氣衰退期間推高倉儲需求。
嚴格的區域分類與土地使用法規
在波特蘭、西雅圖和舊金山,自2025年起,自助倉儲將重新分類為工業用地,並需遵守退讓距離、停車位要求和設計審查等規定,導致核准流程延誤18至36個月。儘管需求增加了5%至7%,但倫敦和巴黎等歐洲城市仍將倉儲市場的成長率限制在2%以下。現有業者憑藉其既得的土地權益擁有定價權,而新進業者則因高昂的法律和持有成本而難以擴張產能,這使得全球複合年成長率下降了約0.6個百分點。
細分市場分析
到2025年,企業租戶佔倉儲容量的29.88%,預計到2031年將以5.81%的複合年成長率成長,由於平均租期超過兩年,企業租戶貢獻了超過40%的總收入。這些客戶為24小時訪問、行李搬運和加固地板等服務支付25%至35%的溢價,這推動了商業用戶自助倉儲市場增速超過整體市場增速。電子商務企業、承包商和季節性零售商更傾向於按月簽訂契約,而非簽訂多年期倉庫租賃合約。個人客戶佔市場佔有率的70.12%,但他們的高解約率增加了清潔和轉售推廣成本,給利潤率帶來了壓力。
目前,營運公司正在設計一種混合用途佈局,底層的企業單元與樓上的個人儲物櫃相輔相成。在新澤西州和南加州等物流中心,企業租戶已佔溫控倉儲庫存的50%至60%,凸顯了企業用戶與個人用戶在盈利上的差距。隨著越來越多的房地產投資信託基金(REITs)專注於獲取企業客戶,競爭的重點正從價格轉向工作流程整合,這進一步深化了自助倉儲市場的價值來源。
溫控倉儲設施佔總儲存容量的54.64%,預計到2025年將佔據大部分收入,並將在2031年之前以6.71%的複合年成長率成長。極端天氣造成的損失以及更嚴格的保險要求正在加速向溫控倉儲設施的轉變,溫控倉儲空間在自助倉儲市場中的佔有率也在逐年擴大。與常溫儲存單元相比,業者收取50%至80%的溢價,而企業租戶願意支付這筆費用來保護其高價值的庫存。
另一方面,在溫帶和鄉村地區,由於維修成本無法收回,對不含空調的倉儲單位的需求日益成長。可攜式貨櫃服務由於物流複雜性,仍然是一個小眾市場;而車輛存儲服務則在住宅協會(HOA)規定嚴格限制私人道路停車的州,呈現出區域性需求。因此,營運的重點在於根據當地微氣候風險和資產組成,最大限度地擴大每個地區的自助倉儲市場規模。
區域分析
2025年,北美將佔全球總儲存容量的52.48%,人均儲存滲透率將達9.5平方英尺。陽光地帶(Sun Belt)的飽和大都會區,例如鳳凰城和達拉斯(運轉率約82%),與沿海城市相比,儲存設施的入住率有顯著差異。在沿海城市,分區法規允許設施維持95%的運轉率運轉率,並允許每年租金上漲4%至6%。加拿大的發展趨勢與美國類似,但隨著中產階級消費者擴大使用異地儲存服務,墨西哥的市場正在快速擴張。
亞太地區以5.09%的成長率領跑,主要得益於中國和印度等城市的發展,這些地區的面積通常不足500平方英尺,且都市化超過60%。日本也持續穩定成長,人口老化推動了對濕度控制的需求。澳洲和紐西蘭則更注重現有設施的整合而非新建設,因此成長率較為溫和,僅2.8%。
儘管歐洲整體成長3.6%,但區域差異依然存在。英國人均住房面積為4.5平方英尺,與中成熟的北美市場相近,但德國、法國和西班牙的數字較低,為SueGuard和SafeStore等公司提供了成長空間。中歐地區,尤其是近期波蘭的一項收購案,吸引了許多關注,該地區電子商務企業的需求正在逐步成長。除主要地區外,拉丁美洲和中東及非洲合計的住房供應量不足8%,但隨著外籍人士數量的增加和電子商務的普及,聖保羅和杜拜等城市的住房供應量預計將增加6%至8%。
其他好處:
- Excel格式的市場預測(ME)表
- 3個月的分析師支持
目錄
第1章:引言
- 市場分析與定義的前提條件
- 分析範圍
第2章 分析方法
第3章執行摘要
第4章 市場狀況
- 市場概覽
- 市場促進因素
- 都市化與生活空間縮小
- 電子商務小規模經銷商的崛起
- 住宅物業價格上漲
- 數位化非接觸式租賃平台
- 自助倉儲作為微型倉配中心
- 對能夠抵禦氣候變遷影響的資產保全的需求
- 市場限制因素
- 嚴格的區域分類與土地使用法規
- 成熟大都會圈局部地區供應過剩的趨勢
- 極端天氣導致保險費飆升。
- 智慧設施的網路安全風險
- 產業價值鏈分析
- 監理情勢
- 技術展望
- 宏觀經濟因素對市場的影響
- 波特五力分析
第5章:預測市場規模與成長率
- 依使用者類型
- 個人
- 公司
- 依儲存類型
- 溫控型
- 非溫控型
- 可攜式/貨櫃式
- 汽車及特種車輛(房車、船隻、葡萄酒)
- 按租賃期限
- 短期(少於3個月)
- 中期(3-12個月)
- 長期(12個月或以上)
- 按單位大小
- 小型(小於50平方英尺)
- 中等大小(50-100平方英尺)
- 大型(100-200平方英尺)
- 超大(200平方英尺或以上)
- 按地區
- 北美洲
- 美國
- 加拿大
- 墨西哥
- 南美洲
- 巴西
- 阿根廷
- 其他南美國家
- 歐洲
- 德國
- 英國
- 法國
- 義大利
- 西班牙
- 俄羅斯
- 其他歐洲國家
- 亞太地區
- 中國
- 日本
- 韓國
- 印度
- 澳洲
- 紐西蘭
- 其他亞太國家
- 中東
- 阿拉伯聯合大公國
- 沙烏地阿拉伯
- 土耳其
- 其他中東國家
- 非洲
- 南非
- 奈及利亞
- 肯亞
- 其他非洲國家
- 北美洲
第6章 競爭情勢
- 市場集中度
- 策略趨勢
- 市佔率分析
- 公司簡介
- Public Storage
- Extra Space Storage Inc.
- U-Haul International Inc.
- CubeSmart LP
- National Storage Affiliates Trust
- Life Storage Inc.
- Safestore Holdings PLC
- StorageMart
- Shurgard Self-Storage SA
- Big Yellow Group PLC
- Prime Storage Group
- Metro Storage LLC
- SmartStop Asset Management LLC
- Clutter Inc.
- MakeSpace Inc.
- Kennards Self Storage
- Access Self Storage Ltd.
- Urban Self Storage Inc.
- Global Self Storage Inc.
- World Class Capital Group LLC(Great Value Storage)
- Amsdell Cos./Compass Self Storage
- All Storage
- Storage King Pty Ltd.
- Storefriendly Self Storage Group
第7章 市場機會與未來展望
According to Mordor Intelligence, the self storage market size in terms of lettable area is expected to increase from 2.59 Billion square feet in 2025 to 2.69 Billion square feet in 2026 and reach 3.18 Billion square feet by 2031, growing at a CAGR of 3.41% over 2026-2031.
This report is Segmented by User Type (Personal, and Business), Storage Type (Climate-Controlled, Non-Climate-Controlled, and More), Lease Duration (Short-Term, Mid-Term, and Long-Term), Unit Size (Small, Medium, Large, Mega), and Geography (North America, South America, Europe, Asia Pacific, Middle East, Africa). The Market Forecasts are Provided in Terms of Volume (Square Feet).
Global Self Storage Market Trends and Insights
Urbanization and Shrinking Living Spaces
Apartment footprints in Tokyo, Hong Kong, and Shanghai dropped below 500 square feet in 2025, forcing residents to externalize bulky possessions. Penetration climbed to 1.5 square feet per capita in these cities, triple rates in suburban locations with garage space. Developers in Singapore and Mumbai incorporate onsite storage into mixed-use towers that command an 8% rent premium. As Asia Pacific urbanization tops 65%, self storage becomes a structural need rather than a discretionary choice. North American downtowns follow a similar path, sustaining demand even when macro conditions soften.
Proliferation of E-commerce Micro-Merchants
A 2025 survey found 38% of online sellers under USD 500,000 annual revenue stage inventory in self storage rather than warehouses. These tenants stay 40% longer and pay 25%-35% premiums for drive-up loading and parcel acceptance. Climate control is essential for electronics and cosmetics, enabling operators to charge rates 50%-80% above ambient space. Micro-merchants offer counter-cyclical resilience because layoffs prompt side-hustle formation that inflates storage demand during downturns.
Stringent Zoning and Land-Use Regulations
Portland, Seattle, and San Francisco reclassified self storage as industrial in 2025, imposing setbacks, parking mandates, and design reviews that delay approvals 18-36 months. European councils in London and Paris cap storage growth below 2% even as demand climbs 5%-7%. Incumbents with grandfathered sites obtain pricing power, but new entrants face steep legal and holding costs that deter capacity additions, shaving roughly 0.6 percentage points from the global CAGR.
Other drivers and restraints analyzed in the detailed report include:
- Climate-Resilient Asset Preservation Demand
- Digitized, Contact-Free Leasing Platforms
- Oversupply Pockets in Mature Metros
For complete list of drivers and restraints, kindly check the Table Of Contents.
Segment Analysis
Business tenants occupied 29.88% of capacity in 2025 and were advancing at a 5.81% CAGR through 2031, yet generated more than 40% of total revenue, as their average lease term exceeded two years. These customers pay 25%-35% premiums for 24-hour access, package handling, and reinforced floors, lifting the self storage market size for commercial users faster than the headline rate. E-commerce sellers, contractors, and seasonal retailers prefer month-to-month contracts that avoid multi-year warehouse leases. Personal customers account for 70.12% of the share, but their churn raises cleaning and remarketing costs, which dilute margins.
Operators now design mixed-use layouts where ground-floor commercial units cross-subsidize upper-floor personal lockers. In logistics hubs such as New Jersey and Southern California, business tenants already control 50%-60% of climate-controlled inventory, underscoring the profitability gap with personal users. As more REITs court corporate accounts, competitive emphasis shifts from price to workflow integration, deepening the value pool inside the self storage market.
Climate-controlled facilities, which represented 54.64% of the total capacity, captured an outsized share of revenue in 2025 and are expected to expand at a 6.71% CAGR through 2031. Extreme weather losses and rising insurer requirements accelerate conversions, expanding the self storage market share for conditioned space each year. Operators charge premiums of 50%-80% over ambient units, and business tenants willingly pay to protect their high-value inventory.
Conversely, non-climate stock thrives in temperate or rural settings where upgrade costs would not be recouped. Portable container services remain a niche due to logistical complexity, and vehicle storage experiences regional strength in states with strict homeowner association rules against driveway parking. Execution focus, therefore, revolves around matching micro-climate risk to asset mix in order to maximize the self-storage market size captured per location.
Complete Report Scope:
- By User Type
- Personal
- Business
- By Storage Type
- Climate-Controlled
- Non-Climate-Controlled
- Portable / Container-Based
- Vehicle and Specialty (RV, Boat, Wine)
- By Lease Duration
- Short-Term (Below 3 Months)
- Mid-Term (3-12 Months)
- Long-Term (Above 12 Months)
- By Unit Size
- Small (Below 50 sq ft)
- Medium (50-100 sq ft)
- Large (100-200 sq ft)
- Mega (Above 200 sq ft)
- By Geography
- North America
- United States
- Canada
- Mexico
- South America
- Brazil
- Argentina
- Rest of South America
- Europe
- Germany
- United Kingdom
- France
- Italy
- Spain
- Russia
- Rest of Europe
- Asia Pacific
- China
- Japan
- South Korea
- India
- Australia
- New Zealand
- Rest of Asia Pacific
- Middle East
- United Arab Emirates
- Saudi Arabia
- Turkey
- Rest of Middle East
- Africa
- South Africa
- Nigeria
- Kenya
- Rest of Africa
- North America
Geography Analysis
North America held 52.48% of the global capacity in 2025, with a per-capita penetration of 9.5 square feet. Occupancy gaps emerged between saturated Sunbelt metros, such as Phoenix and Dallas, which hovered near 82%, and coastal cities, where zoning barriers keep facilities full at 95% and allow for 4%-6% annual rent increases. Canada mirrors the United States profile, while Mexico advances quickly as middle-class consumers embrace external storage.
The Asia Pacific region posts the fastest growth rate of 5.09%, driven by Chinese and Indian cities where apartment sizes typically fall below 500 square feet, and urbanization surpasses 60%. Japan continues to expand steadily amid an aging population and a climate-controlled demand for humidity protection. Australia and New Zealand focus on consolidating existing facilities rather than undertaking greenfield builds, resulting in a moderate 2.8% growth.
Europe growth rate is 3.6%, although disparities persist. The United Kingdom resembles a mid-maturity North American market, with 4.5 square feet per capita, whereas Germany, France, and Spain have lower figures, offering a runway for Shurgard and Safestore. Central Europe, highlighted by recent Polish acquisitions, unlocks incremental demand among e-commerce merchants. Beyond the core regions, Latin America, the Middle East, and Africa together account for less than 8% of supply but expand 6%-8% as expatriate populations and e-commerce adoption scale in cities such as Sao Paulo and Dubai.
- Public Storage
- Extra Space Storage Inc.
- U-Haul International Inc.
- CubeSmart LP
- National Storage Affiliates Trust
- Life Storage Inc.
- Safestore Holdings PLC
- StorageMart
- Shurgard Self-Storage SA
- Big Yellow Group PLC
- Prime Storage Group
- Metro Storage LLC
- SmartStop Asset Management LLC
- Clutter Inc.
- MakeSpace Inc.
- Kennards Self Storage
- Access Self Storage Ltd.
- Urban Self Storage Inc.
- Global Self Storage Inc.
- World Class Capital Group LLC (Great Value Storage)
- Amsdell Cos./Compass Self Storage
- All Storage
- Storage King Pty Ltd.
- Storefriendly Self Storage Group
Additional Benefits:
- The market estimate (ME) sheet in Excel format
- 3 months of analyst support
TABLE OF CONTENTS
1 INTRODUCTION
- 1.1 Study Assumptions and Market Definition
- 1.2 Scope of the Study
2 RESEARCH METHODOLOGY
3 EXECUTIVE SUMMARY
4 MARKET LANDSCAPE
- 4.1 Market Overview
- 4.2 Market Drivers
- 4.2.1 Urbanization and Shrinking Living Spaces
- 4.2.2 Proliferation of E-commerce Micro-Merchants
- 4.2.3 Rising Residential Real Estate Costs
- 4.2.4 Digitized, Contact Free Leasing Platforms
- 4.2.5 Self-Storage as Micro Fulfillment Hubs
- 4.2.6 Climate Resilient Asset Preservation Demand
- 4.3 Market Restraints
- 4.3.1 Stringent Zoning and Land Use Regulations
- 4.3.2 Oversupply Pockets in Mature Metros
- 4.3.3 Escalating Insurance Premiums from Extreme Weather
- 4.3.4 Cyber-Security Risks for Smart Facilities
- 4.4 Industry Value Chain Analysis
- 4.5 Regulatory Landscape
- 4.6 Technological Outlook
- 4.7 Impact of Macroeconomic Factors on the Market
- 4.8 Porter's Five Forces Analysis
- 4.8.1 Bargaining Power of Buyers
- 4.8.2 Bargaining Power of Suppliers
- 4.8.3 Threat of New Entrants
- 4.8.4 Threat of Substitutes
- 4.8.5 Intensity of Competitive Rivalry
5 MARKET SIZE and GROWTH FORECASTS (UNITS)
- 5.1 By User Type
- 5.1.1 Personal
- 5.1.2 Business
- 5.2 By Storage Type
- 5.2.1 Climate-Controlled
- 5.2.2 Non-Climate-Controlled
- 5.2.3 Portable / Container-Based
- 5.2.4 Vehicle and Specialty (RV, Boat, Wine)
- 5.3 By Lease Duration
- 5.3.1 Short-Term (Below 3 Months)
- 5.3.2 Mid-Term (3-12 Months)
- 5.3.3 Long-Term (Above 12 Months)
- 5.4 By Unit Size
- 5.4.1 Small (Below 50 sq ft)
- 5.4.2 Medium (50-100 sq ft)
- 5.4.3 Large (100-200 sq ft)
- 5.4.4 Mega (Above 200 sq ft)
- 5.5 By Geography
- 5.5.1 North America
- 5.5.1.1 United States
- 5.5.1.2 Canada
- 5.5.1.3 Mexico
- 5.5.2 South America
- 5.5.2.1 Brazil
- 5.5.2.2 Argentina
- 5.5.2.3 Rest of South America
- 5.5.3 Europe
- 5.5.3.1 Germany
- 5.5.3.2 United Kingdom
- 5.5.3.3 France
- 5.5.3.4 Italy
- 5.5.3.5 Spain
- 5.5.3.6 Russia
- 5.5.3.7 Rest of Europe
- 5.5.4 Asia Pacific
- 5.5.4.1 China
- 5.5.4.2 Japan
- 5.5.4.3 South Korea
- 5.5.4.4 India
- 5.5.4.5 Australia
- 5.5.4.6 New Zealand
- 5.5.4.7 Rest of Asia Pacific
- 5.5.5 Middle East
- 5.5.5.1 United Arab Emirates
- 5.5.5.2 Saudi Arabia
- 5.5.5.3 Turkey
- 5.5.5.4 Rest of Middle East
- 5.5.6 Africa
- 5.5.6.1 South Africa
- 5.5.6.2 Nigeria
- 5.5.6.3 Kenya
- 5.5.6.4 Rest of Africa
- 5.5.1 North America
6 COMPETITIVE LANDSCAPE
- 6.1 Market Concentration
- 6.2 Strategic Moves
- 6.3 Market Share Analysis
- 6.4 Company Profiles (includes Global Level Overview, Market Level Overview, Core Segments, Financials as Available, Strategic Information, Market Rank/Share for Key Companies, Products and Services, and Recent Developments)
- 6.4.1 Public Storage
- 6.4.2 Extra Space Storage Inc.
- 6.4.3 U-Haul International Inc.
- 6.4.4 CubeSmart LP
- 6.4.5 National Storage Affiliates Trust
- 6.4.6 Life Storage Inc.
- 6.4.7 Safestore Holdings PLC
- 6.4.8 StorageMart
- 6.4.9 Shurgard Self-Storage SA
- 6.4.10 Big Yellow Group PLC
- 6.4.11 Prime Storage Group
- 6.4.12 Metro Storage LLC
- 6.4.13 SmartStop Asset Management LLC
- 6.4.14 Clutter Inc.
- 6.4.15 MakeSpace Inc.
- 6.4.16 Kennards Self Storage
- 6.4.17 Access Self Storage Ltd.
- 6.4.18 Urban Self Storage Inc.
- 6.4.19 Global Self Storage Inc.
- 6.4.20 World Class Capital Group LLC (Great Value Storage)
- 6.4.21 Amsdell Cos./Compass Self Storage
- 6.4.22 All Storage
- 6.4.23 Storage King Pty Ltd.
- 6.4.24 Storefriendly Self Storage Group
7 MARKET OPPORTUNITIES and FUTURE OUTLOOK
- 7.1 White-Space and Unmet-Need Assessment

 德國自助倉儲:市場佔有率分析、產業趨勢與統計及成長預測(2026-2031)新加坡自助倉儲:市場佔有率分析、產業趨勢與統計及成長預測(2026-2031)越南自助倉儲:市場佔有率分析、產業趨勢與統計及成長預測(2026-2031)亞太地區自助倉儲:市場佔有率分析、產業趨勢與統計及成長預測(2026-2031)歐洲自助倉儲:市場佔有率分析、產業趨勢與統計及成長預測(2026-2031 年)美國自助倉儲:市場佔有率分析、產業趨勢與統計及成長預測(2026-2031)
 城市按需儲存服務市場預測至2034年-按服務類型、儲存格式、預訂模式、儲存容量、服務期限、最終用戶和地區分類的全球分析
 自助倉儲市場規模、佔有率、趨勢和預測:按儲存單元規模、最終用途和地區分類,2026-2034 年
 2026年全球自助倉儲市場報告
 自助倉儲市場:2026-2032年全球市場預測(按單位類型、租賃期限、單位面積、存取方式及最終用戶分類)