

 |
市場調查報告書
商品編碼
2100602
第三方物流(3PL):市場佔有率分析、產業趨勢與統計、成長預測(2026-2031)Third-Party Logistics (3PL) - Market Share Analysis, Industry Trends & Statistics, Growth Forecasts (2026 - 2031) |
||||||

※ 本網頁內容可能與最新版本有所差異。詳細情況請與我們聯繫。
第三方物流(3PL) 市場預計在 2026 年達到 1.22 兆美元,預計在預測期(2026-2031 年)內將以 5.27% 的複合年成長率成長,到 2031 年達到 1.57 兆美元。
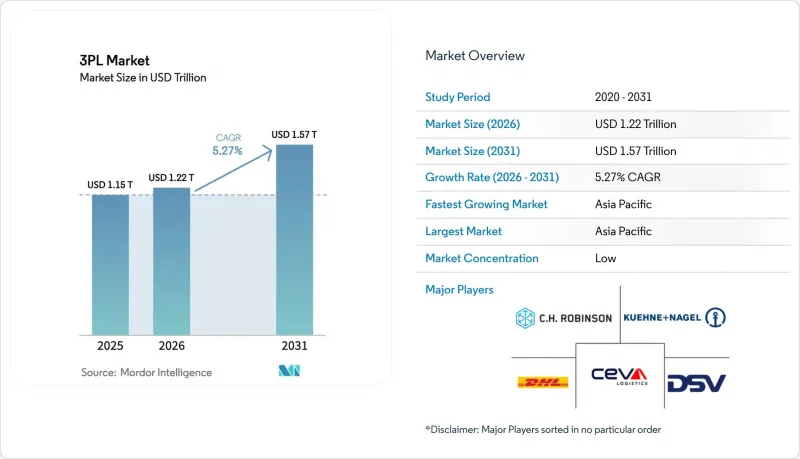
本報告按服務(例如,國內運輸管理、國際運輸管理)、最終用戶(例如,公共產業、能源和公用事業、製造業)、物流模式(例如,輕資產、重資產、混合模式)和地區(例如,北美、南美、歐洲、亞太地區)進行分類。市場預測以美元計價。
全球第三方物流(3PL) 市場趨勢與洞察
外包以實現成本效益和輕資產轉型
企業進一步推動外包,將固定物流成本轉化為變動成本,並將資金重新投入創新。輕資產模式已佔第三方物流(3PL) 市場 55.13% 的佔有率,這反映了經營團隊提高資產負債表柔軟性的指南。可變運力可緩解需求突變,而從危險物品處理到低溫低溫運輸等專業技能,只需一張發票即可交付,無需多年資本投資。主導物流和第四方物流 (4PL) 架構整合了供應商名單,為托運人提供統一的績效儀錶板和精簡的管治,同時供應商透過統籌合作夥伴網路實現規模經濟。
引入人工智慧控制塔式物流
整合到控制塔平台中的機器學習引擎現在可以預測中斷情況,提案最佳化服務成本的路線,並啟動自動恢復措施。聯邦快遞 (FedEx) 於 2024 年收購 ShipMatrix,引入了預測分析功能,提高了預計到達時間 (ETA) 的準確性,並減少了與異常處理相關的人工工作。第三方物流(3PL) 市場也呈現類似的趨勢,準時交付和完整交貨是關鍵指標,技術正在重新定義其角色,從後勤部門為策略優勢。透過整合遠端資訊處理、物聯網感測器和承運商 API,正在建立資料湖,演算法也在不斷改進,從而在燃油成本、滯銷成本和庫存週轉天數方面實現了可衡量的成本節約。
倉庫人手不足和工資上漲
預計到2025年,美國運輸和倉儲業將面臨40萬勞動力缺口。薪資每年上漲8%至12%,進一步壓縮了本已因燃油額外費用而承壓的利潤空間。離職率超過50%,不僅讓招募預算捉襟見肘,也威脅到服務準確性,尤其是在溫控貨物和危險品等需要專業認證人員的細分領域。自動化固然有所幫助,但資金壁壘阻礙了其普及,導致許多第三方物流(3PL)市場參與者陷入人事費用上漲和客戶抵制運費上漲的困境。
細分市場分析
預計到2025年,國內運輸管理將佔第三方物流(3PL)市場規模的45.64%,並將以5.91%的複合年成長率持續成長至2031年。隨著「當日達」和「次日達」服務承諾的推動,小包裹運輸量不斷成長,迫使物流供應商提高最後一公里網路的密度,並部署人工智慧路線規劃引擎以降低配送成本。陸路貨運憑藉其門到門的柔軟性,佔據了國內收入的近70%,但隨著鐵路運輸比單獨公路運輸更具經濟性,多式聯運解決方案在長途運輸領域正日益普及。對高階服務和超大件貨物處理的需求不斷成長,增加了營運的複雜性,這使得擁有專業設備和訓練有素的員工的營運商更具優勢。
到2026年以後,消費者對當日送達的期望預計將擴展到郊區和區域城市的消費者,從而進一步提高小包裹遞送的密度。隨著區域性物流配送逐漸取代全國性樞紐,第三方履約(3PL)市場的參與企業正在投資建造小規模的交叉轉運中心,並整合預測性庫存佈局。由於駕駛員短缺和電子駕駛記錄器(ELD)導致的運轉率下降,營運商正轉向試點自動駕駛卡車以滿足都市區排放氣體法規的要求,並引入電動送貨車。技術領先的新參與企業憑藉其原生API的運輸管理系統(TMS)平台吸引了許多DTC品牌,而老牌公司則被迫更新其視覺化服務,否則將面臨市場佔有率流失的風險。
區域分析
預計到2025年,亞太地區將佔全球銷售額的41.02%,並在2031年之前以6.36%的複合年成長率成長。中國正引領小包裹密度和全通路模式的提升,而隨著製造業風險多元化的推進,越南、印尼和印度也獲得了新的投資。內陸省份正受益於低溫運輸的發展,從而支持高階食品和疫苗的配送。同時,在日本和韓國,人們對機器人密集型履約和加值服務的期望日益提高,這有利於提供自動化和增值組裝服務的第三方物流(3PL)市場參與企業。
北美擁有先進的基礎設施和較高的數位化普及率。在美國,墨西哥已超越中國成為其主要進口夥伴,跨境貨運量激增,帶動了對短途貨運場和近邊境物流中心的需求。加拿大的「太平洋門戶」將亞洲進口商品運送至中西部地區的消費者手中,而墨西哥的汽車產業叢集則促進了零件的即時交付。勞動力短缺推動了對自動化領域的投資,自動駕駛卡車正在德克薩斯州和加利福尼亞州之間的循環路線上進行試點。
儘管南美洲、中東和非洲的市場佔有率落後於其他地區,但它們蘊藏著不對稱成長的潛力。在巴西,電子商務的蓬勃發展正使港口和公路運力不堪重負,但也吸引了對連接桑托斯港與內陸各州的多模態走廊的投資。在中東,石油美元的多元化發展正在推動自由貿易區和航空貨運超級樞紐的建立,杜拜和利雅德正逐步成為跨洲轉運樞紐。非洲大陸自由貿易協定(AfCFTA)旨在統一各地區的關稅體系,而在第三方物流(3PL)市場,那些早期建立跨區域控制中心和最後一公里配送網路的公司,可望在消費者支出成長的背景下獲得先發優勢。
其他好處:
- Excel格式的市場預測(ME)表
- 3個月的分析師支持
目錄
第1章:引言
- 研究假設和市場定義
- 調查範圍
第2章:調查方法
第3章執行摘要
第4章 市場狀況
- 市場概覽
- 市場促進因素
- 電子商務和全通路履約的爆炸性成長
- 全球化與跨境貿易的復甦
- 外包以提高成本效益和減少資產
- 引入人工智慧控制塔式物流
- 近岸外包/友善外包重新定義了貿易走廊的性質
- 以ESG原則為驅動的優質「綠色物流」加值服務
- 市場限制因素
- 高度不穩定的燃油和票價環境
- 倉庫自動化和技術實施需要大量資金投入。
- 倉庫人手不足和工資上漲
- 與多租戶平台相關的網路安全風險
- 價值供應鏈分析
- 技術概覽(物聯網、人工智慧等)
- 主要政府法規和舉措
- 電子商務業務洞察
- 倉儲市場趨勢
- 需求趨勢分析(CEP、最後一公里、低溫運輸等)
- 波特五力模型
- 地緣政治事件對市場的影響
第5章 市場規模與成長預測
- 按服務
- 國內運輸管理(DTM)
- 路
- 鐵路
- 空中航線
- 水路
- 國際運輸管理(ITM)
- 路
- 鐵路
- 空中航線
- 水路
- 加值倉儲與物流 (VAWD)
- 國內運輸管理(DTM)
- 最終用戶
- 車
- 能源公用事業
- 製造業
- 生命科學與醫療保健
- 技術與電子
- 零售與電子商務
- 消費品/快速消費品
- 食品/飲料
- 其他
- 物流模型
- 輕資產(託管)
- 資產密集型(公司車輛和倉庫)
- 混合
- 按地區
- 北美洲
- 美國
- 加拿大
- 墨西哥
- 南美洲
- 巴西
- 阿根廷
- 智利
- 其他南美國家
- 歐洲
- 德國
- 英國
- 法國
- 西班牙
- 義大利
- 荷蘭
- 俄羅斯
- 其他歐洲國家
- 亞太地區
- 中國
- 印度
- 日本
- 韓國
- 新加坡
- 越南
- 印尼
- 澳洲
- 其他亞太國家
- 中東和非洲
- 阿拉伯聯合大公國
- 沙烏地阿拉伯
- 南非
- 奈及利亞
- 其他中東和非洲國家
- 北美洲
第6章 競爭情勢
- 策略趨勢
- 市佔率分析
- 公司簡介
- DHL Supply Chain and Global Forwarding
- Kuehne+Nagel International AG
- GXO Logistics
- CH Robinson Worldwide Inc.
- DSV A/S
- Nippon Express Holdings
- Sinotrans Ltd.
- CEVA Logistics(CMA CGM)
- XPO Inc.
- FedEx Logistics
- UPS Supply Chain Solutions
- GEODIS
- Kerry Logistics Network
- Yusen Logistics(NYK)
- Hitachi Transport System(LOGISTEED)
- JB Hunt Transport Services Inc.
- CJ Logistics
- Samsung SDS
- Americold Logistics LLC
- Penske Logistics
- Expeditors
第7章 市場機會與未來展望
According to Mordor Intelligence, the third-Party logistics (3PL) market size is estimated at USD 1.22 trillion in 2026, and is expected to reach USD 1.57 trillion by 2031, at a CAGR of 5.27% during the forecast period (2026-2031).
This report is Segmented by Service (Domestic Transportation Management, International Transportation Management, and More), by End User (Automotive, Energy and Utilities, Manufacturing and More), by Logistics Model (Asset-Light, Asset-Heavy, and Hybrid), by Region (North America, South America, Europe, Asia-Pacific and More). The Market Forecasts are Provided in Terms of Value (USD).
Global Third-Party Logistics (3PL) Market Trends and Insights
Outsourcing for Cost-Efficiency & Asset-Light Focus
Enterprises deepened outsourcing to convert fixed logistics costs into variable terms and redirect cash toward innovation. Asset-light models already make up 55.13% of the Third-Party Logistics (3PL) Market , a reflection of board-level mandates for balance-sheet agility. Variable capacity cushions demand shocks, and specialized skills ranging from hazardous materials handling to ultra-cold chain arrive wrapped in a single invoice rather than multiyear capex. Lead-logistics and 4PL frameworks consolidate vendor rosters, granting shippers unified performance dashboards and streamlined governance while providers unlock scale by orchestrating partner networks.
AI-Enabled Control-Tower Logistics Adoption
Machine-learning engines embedded in control-tower platforms now predict disruptions, suggest cost-to-serve-optimized routes, and initiate automated recovery steps. FedEx's 2024 purchase of ShipMatrix injected predictive analytics that sharpened ETA accuracy and reduced manual exception labor. Similar moves across the Third-Party Logistics (3PL) Market are recasting technology from back-office tool to strategic moat as on-time-in-full metrics become table stakes. Integration of telematics, IoT sensors, and carrier APIs feeds data lakes that continually refine algorithms, driving measurable savings in fuel, detention, and inventory days of supply.
Warehouse-Labor Scarcity & Wage Inflation
The United States logged a 400,000-worker shortfall in transportation and warehousing roles during 2025. Pay climbed 8-12% annually, squeezing margins already thinned by fuel surcharges. Turnover exceeding 50% burns recruitment budgets and imperils service accuracy, especially for temperature-controlled and hazardous-materials niches requiring certified staff. While automation offers relief, capital hurdles slow adoption, leaving many Third-Party Logistics (3PL) Market players caught between rising payrolls and customer rate resistance.
Other drivers and restraints analyzed in the detailed report include:
- Near-/Friend-Shoring Redefining Trade Corridors
- ESG-Driven "Green Logistics" Premium Services
- Cybersecurity Exposure from Multi-Tenant Platforms
For complete list of drivers and restraints, kindly check the Table Of Contents.
Segment Analysis
Domestic transportation management held a 45.64% share of the Third-Party Logistics (3PL) Market size in 2025 and is forecast to log a 5.91% CAGR to 2031. Parcel outflows tied to same-day and next-day promises continue to swell, compelling providers to densify last-mile networks and deploy AI route engines that compress delivery costs. Road freight accounts for nearly 70% of domestic revenue thanks to door-to-door flexibility, while intermodal solutions gain favor on long hauls where rail economics beat pure truckload. Demand for white-glove and oversized-item handling is adding complexity that rewards operators with specialized equipment and trained crews.
Beyond 2026, same-day expectations will likely reach suburban and secondary-city consumers, further swelling parcel density. As regional fulfillment replaces national hubs, Third-Party Logistics (3PL) Market participants invest in smaller cross-docks integrated with predictive inventory positioning. Driver shortages and ELD-related utilization dips are nudging providers toward autonomous-truck pilots and electric delivery vans that tackle urban emission regulations. Technology-first entrants wield API-native TMS platforms that court DTC brands, forcing incumbents to refresh visibility offerings or risk share erosion.
Complete Report Scope:
- By Service
- Domestic Transportation Management (DTM)
- Roadways
- Railways
- Airways
- Waterways
- International Transportation Management (ITM)
- Roadways
- Railways
- Airways
- Waterways
- Value-Added Warehousing and Distribution (VAWD)
- Domestic Transportation Management (DTM)
- By End User
- Automotive
- Energy and Utilities
- Manufacturing
- Life Sciences and Healthcare
- Technology and Electronics
- Retail and E-commerce
- Consumer Goods and FMCG
- Food and Beverages
- Others
- By Logistics Model
- Asset-Light (Management-Based)
- Asset-Heavy (Own Fleet and Warehouses)
- Hybrid
- By Region
- North America
- United States
- Canada
- Mexico
- South America
- Brazil
- Argentina
- Chile
- Rest of South America
- Europe
- Germany
- United Kingdom
- France
- Spain
- Italy
- Netherlands
- Russia
- Rest of Europe
- Asia-Pacific
- China
- India
- Japan
- South Korea
- Singapore
- Vietnam
- Indonesia
- Australia
- Rest of Asia-Pacific
- Middle East and Africa
- United Arab Emirates
- Saudi Arabia
- South Africa
- Nigeria
- Rest of Middle East and Africa
- North America
Geography Analysis
Asia-Pacific generated 41.02% of global revenue in 2025 and is on track for a 6.36% CAGR through 2031. China drives scale in parcel density and omnichannel sophistication, yet manufacturing risk diversification steers fresh investment to Vietnam, Indonesia, and India. Inland provinces benefit from cold-chain rollouts that support premium food and vaccine distribution. Meanwhile, Japan and South Korea showcase robotics-dense fulfillment and premium service expectations, rewarding Third-Party Logistics (3PL) Market participants that offer automation and value-added assembly.
North America retains advanced infrastructure and high digital adoption. The United States sees cross-border volume surging as Mexico overtakes China among import partners, amplifying demand for drayage yards and near-border sequencing centers. Canada's Pacific Gateway funnels Asian imports to Midwest consumers, while Mexico's automotive clusters spur just-in-sequence parts flows. Labor scarcity pushes automation spend, fostering pilot deployments of autonomous trucks on repetitive lanes between Texas and California.
South America, the Middle East, and Africa trail in share yet offer asymmetric upside. Brazil's e-commerce surge strains port and road capacity but invites investment in multimodal corridors linking Santos to interior states. The Middle East channels petro-dollar diversification into free-trade zones and air-cargo super hubs, positioning Dubai and Riyadh as cross-continental transshipment pivots. Africa's AfCFTA aims to unify a patchwork of customs regimes, and early movers in the Third-Party Logistics (3PL) Market who establish pan-regional control towers and last-mile networks stand to capture first-mover premiums as consumer spending rises.
- DHL Supply Chain and Global Forwarding
- Kuehne + Nagel International AG
- GXO Logistics
- C.H. Robinson Worldwide Inc.
- DSV A/S
- Nippon Express Holdings
- Sinotrans Ltd.
- CEVA Logistics (CMA CGM)
- XPO Inc.
- FedEx Logistics
- UPS Supply Chain Solutions
- GEODIS
- Kerry Logistics Network
- Yusen Logistics (NYK)
- Hitachi Transport System (LOGISTEED)
- J.B. Hunt Transport Services Inc.
- CJ Logistics
- Samsung SDS
- Americold Logistics LLC
- Penske Logistics
- Expeditors
Additional Benefits:
- The market estimate (ME) sheet in Excel format
- 3 months of analyst support
TABLE OF CONTENTS
1 Introduction
- 1.1 Study Assumptions and Market Definition
- 1.2 Scope of the Study
2 Research Methodology
3 Executive Summary
4 Market Landscape
- 4.1 Market Overview
- 4.2 Market Drivers
- 4.2.1 Explosive e-commerce & omni-channel fulfillment
- 4.2.2 Globalization & cross-border trade rebound
- 4.2.3 Outsourcing for cost-efficiency & asset-light focus
- 4.2.4 AI-enabled control-tower logistics adoption
- 4.2.5 Near-/friend-shoring redefining trade corridors
- 4.2.6 ESG-driven "green logistics" premium services
- 4.3 Market Restraints
- 4.3.1 Volatile fuel & freight-rate environment
- 4.3.2 High capex for warehouse automation & tech
- 4.3.3 Warehouse-labour scarcity & wage inflation
- 4.3.4 Cyber-security exposure from multi-tenant platforms
- 4.4 Value / Supply-Chain Analysis
- 4.5 Technology Snapshot (IoT, AI, etc.)
- 4.6 Key Government Regulations and Initiatives
- 4.7 Insights into E-commerce Business
- 4.8 Warehousing Market Trends
- 4.9 Demand Trend Analysis (CEP, Last-Mile, Cold-Chain etc.)
- 4.10 Porter's Five Forces
- 4.10.1 Threat of New Entrants
- 4.10.2 Bargaining Power of Buyers
- 4.10.3 Bargaining Power of Suppliers
- 4.10.4 Threat of Substitutes
- 4.10.5 Intensity of Competitive Rivalry
- 4.11 Impact of Geopolitical Events on the Market
5 Market Size & Growth Forecasts (Value)
- 5.1 By Service
- 5.1.1 Domestic Transportation Management (DTM)
- 5.1.1.1 Roadways
- 5.1.1.2 Railways
- 5.1.1.3 Airways
- 5.1.1.4 Waterways
- 5.1.2 International Transportation Management (ITM)
- 5.1.2.1 Roadways
- 5.1.2.2 Railways
- 5.1.2.3 Airways
- 5.1.2.4 Waterways
- 5.1.3 Value-Added Warehousing and Distribution (VAWD)
- 5.1.1 Domestic Transportation Management (DTM)
- 5.2 By End User
- 5.2.1 Automotive
- 5.2.2 Energy and Utilities
- 5.2.3 Manufacturing
- 5.2.4 Life Sciences and Healthcare
- 5.2.5 Technology and Electronics
- 5.2.6 Retail and E-commerce
- 5.2.7 Consumer Goods and FMCG
- 5.2.8 Food and Beverages
- 5.2.9 Others
- 5.3 By Logistics Model
- 5.3.1 Asset-Light (Management-Based)
- 5.3.2 Asset-Heavy (Own Fleet and Warehouses)
- 5.3.3 Hybrid
- 5.4 By Region
- 5.4.1 North America
- 5.4.1.1 United States
- 5.4.1.2 Canada
- 5.4.1.3 Mexico
- 5.4.2 South America
- 5.4.2.1 Brazil
- 5.4.2.2 Argentina
- 5.4.2.3 Chile
- 5.4.2.4 Rest of South America
- 5.4.3 Europe
- 5.4.3.1 Germany
- 5.4.3.2 United Kingdom
- 5.4.3.3 France
- 5.4.3.4 Spain
- 5.4.3.5 Italy
- 5.4.3.6 Netherlands
- 5.4.3.7 Russia
- 5.4.3.8 Rest of Europe
- 5.4.4 Asia-Pacific
- 5.4.4.1 China
- 5.4.4.2 India
- 5.4.4.3 Japan
- 5.4.4.4 South Korea
- 5.4.4.5 Singapore
- 5.4.4.6 Vietnam
- 5.4.4.7 Indonesia
- 5.4.4.8 Australia
- 5.4.4.9 Rest of Asia-Pacific
- 5.4.5 Middle East and Africa
- 5.4.5.1 United Arab Emirates
- 5.4.5.2 Saudi Arabia
- 5.4.5.3 South Africa
- 5.4.5.4 Nigeria
- 5.4.5.5 Rest of Middle East and Africa
- 5.4.1 North America
6 Competitive Landscape
- 6.1 Strategic Moves
- 6.2 Market Share Analysis
- 6.3 Company Profiles (includes Global level Overview, Market level overview, Core Segments, Financials as available, Strategic Information, Market Rank/Share for key companies, Products and Services, and Recent Developments)
- 6.3.1 DHL Supply Chain and Global Forwarding
- 6.3.2 Kuehne + Nagel International AG
- 6.3.3 GXO Logistics
- 6.3.4 C.H. Robinson Worldwide Inc.
- 6.3.5 DSV A/S
- 6.3.6 Nippon Express Holdings
- 6.3.7 Sinotrans Ltd.
- 6.3.8 CEVA Logistics (CMA CGM)
- 6.3.9 XPO Inc.
- 6.3.10 FedEx Logistics
- 6.3.11 UPS Supply Chain Solutions
- 6.3.12 GEODIS
- 6.3.13 Kerry Logistics Network
- 6.3.14 Yusen Logistics (NYK)
- 6.3.15 Hitachi Transport System (LOGISTEED)
- 6.3.16 J.B. Hunt Transport Services Inc.
- 6.3.17 CJ Logistics
- 6.3.18 Samsung SDS
- 6.3.19 Americold Logistics LLC
- 6.3.20 Penske Logistics
- 6.3.21 Expeditors
7 Market Opportunities and Future Outlook
- 7.1 White-space and Unmet-Need Assessment
- 7.2 Emergence of 4PL and Digital Freight Marketplaces
- 7.3 Sustainability and Green Logistics Initiatives
- 7.4 Automation and Robotics in Warehouses
- 7.5 Near-shoring and Regionalisation Impact on Contract Structures

 第三方化學品分銷市場:全球市場預測,2026-2032年第三方物流軟體市場:全球市場預測,2026-2032年第三方物流市場-2026-2032年全球市場預測
 印度第三方物流倉庫:市場佔有率分析、產業趨勢與統計及成長預測(2026-2031)美國第三方物流倉儲:市場佔有率分析、產業趨勢與統計、成長預測(2026-2031)德國第三方物流倉庫:市場佔有率分析、產業趨勢與統計及成長預測(2026-2031 年)中東第三方物流(3PL):市場佔有率分析、產業趨勢與統計及成長預測 (2026-2031)
 2026年全球履約服務市場報告2026年生物製藥冷藏物流鏈全球市場報告亞太地區第三方物流(3PL):市場佔有率分析、產業趨勢與統計及成長預測 (2026-2031)