


 |
市場調查報告書
商品編碼
2100545
製造業數位轉型:市場佔有率分析、產業趨勢與統計及成長預測(2026-2031)Digital Transformation In Manufacturing - Market Share Analysis, Industry Trends & Statistics, Growth Forecasts (2026 - 2031) |
||||||

※ 本網頁內容可能與最新版本有所差異。詳細情況請與我們聯繫。
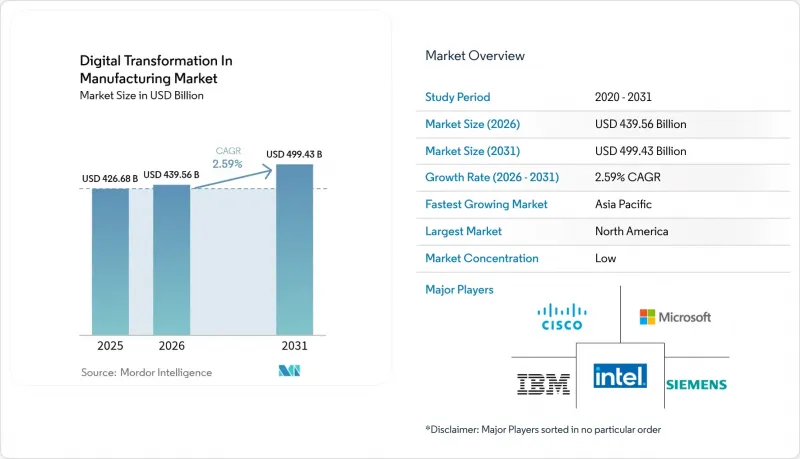
根據 Mordor Intelligence 預測,製造業數位轉型市場規模預計將在 2025 年達到 4,266.8 億美元,2026 年達到 4,395.6 億美元,2031 年達到 4994.3 億美元,2026 年至 2031 年的複合年成長率為 2.59%。
本報告按技術類型(工業IoT平台、機器人和自動化等)、部署模式(本地部署、雲端部署等)、公司規模(大型企業、中小企業)、終端用戶產業(汽車、航太與國防、化工與材料、食品飲料等)以及地區進行細分。市場預測以美元計價。
全球製造業數位轉型市場趨勢與洞察
工業IoT平台的普及
工業IoT平台正將預測性維護和線上品質分析功能直接整合到生產單元中,從而將汽車和航太製造商的意外停機時間減少高達 40%。汽車製造商將機器人、自動導引運輸車(AGV) 和測試台整合到單一數位線程下,已將車型換代週期從數週縮短至數天,使其能夠維持個人化配置套件的生產能力。隨著專用 5G 的部署,曾經將控制器限制於有線連接的延遲已被消除,使物聯網成為下一代工廠事實上的神經系統。早期採用者報告稱,隨著異常檢測演算法基於串流感測器資料不斷累積,其產量逐季度累積提升。隨著數位化工單和自癒式生產線成為標準採購要求,落後的公司將面臨永久性的成本劣勢。
快速過渡到雲端原生 MES 和 SaaS 解決方案
基於訂閱的製造執行系統 (MES) 平台取代了成本高昂、資本密集的歷史資料庫和監控系統,使多站點負責人只需通過瀏覽器即可重新平衡生產,而無需花費數週時間重新配置 ERP 系統。到 2025 年,將有超過 1000 家工廠將其核心執行功能遷移到雲端,其付費使用制的定價模式遠低於傳統套件產品超過 50 萬美元的永久授權費用。託管在本地站點的虛擬化控制器允許儀表板、機器學習訓練和供應商入口網站靈活地在異地擴展,而安全關鍵迴路則保留在外部部署。這種模式降低了先前缺乏資料中心和 DevOps 團隊的中小型企業的進入門檻,從而在製造業數位轉型市場中創造了公平的競爭環境。
OT-IT整合技能短缺
在製造業領域,既能用Python編程又能排除梯形圖邏輯故障的工程師嚴重短缺,導致專案進度延誤長達兩年。儘管培訓機構每年培養出數百名畢業生,但市場需求卻高達數千,這使得人才成為製造業數位轉型中最稀缺的資源。人才短缺加劇了競爭差距,導致直接成本上升和錯失良機,因為大型企業可以投資內部培訓項目,而中型企業則必須等待供應商提供的專業服務。自動化供應商雖然提供低程式碼介面,但人力資本仍然是瓶頸,因為複雜的邊緣分析仍然需要領域專家。
細分市場分析
2025年,工業IoT平台將佔據製造業數位轉型市場34.42%的佔有率,鞏固其作為連接現場感測器、控制器和企業應用的第一層連接平台的地位。這一市場佔有率使得即時機器資料能夠聚合到統一的資料湖中,從而使預測性維護演算法能夠將計劃外停機時間減少兩位數。物聯網的應用如今已相當普及,其附加價值正轉向更複雜的應用。這種轉變解釋了為何數位孿生和模擬工具的市場規模預計到2031年將以3.47%的複合年成長率成長。製造商正在使用虛擬副本對組裝流程進行壓力測試、檢驗人體工學,並在硬體部署到現場之前預訓練機器學習模型,從而將專案推出時間從數月縮短至數週。
機器人技術、積層製造和擴增實境(AR) 方面的支出仍然可觀,但成長速度正在放緩。這是因為許多領先採用者優先考慮的是提高現有生產單位的生產力,而不是增加硬體。網路安全曾經往往被忽視,但隨著每增加一台新設備,威脅範圍累計,如今已成為資本預算中的一項獨立支出。整合到視覺系統中的邊緣處理器透過在本地儲存Terabyte影像數據,顯著降低了頻寬成本,從而實現了不到一秒的偵測回饋循環,遠遠超越了人眼的能力。在預測期內,技術選擇將更多地取決於每一層與開放 API 的無縫整合程度,而不是功能的數量。這將使未來的升級無需重新設計整個技術堆疊。
到2025年,本地部署將佔總支出的56.91%,這反映了長期以來對安全關鍵環節和智慧財產權管控日益嚴格的趨勢。然而,混合部署和邊緣部署預計將以4.82%的複合年成長率(CAGR)實現最高成長,隨著本地響應能力和雲端可擴展性之間的矛盾逐漸消失,本地部署的優勢正在逐漸減弱。生產團隊現在在距離生產線僅幾公尺的微型資料中心部署確定性運動控制系統,同時在超大規模資料中心進行深度學習模型的夜間訓練。這種分段式架構可將影像傳輸頻寬降低約80%,使製造商能夠在不犧牲分析能力的前提下,遵守資料主權條款。
對於毫秒延遲並非關鍵任務的領域,例如供應商協作、能源儀錶板和永續發展報告,純雲端模式仍然具有吸引力。買家需要注意的是,部署正逐漸從一次性基礎設施投資轉變為持續的工作負載平衡任務。能夠實現這種編配自動化的供應商可以提供實際的成本和效能優勢,因為工廠負責人不再需要管理 IP 位址或在周五晚班期間啟動虛擬機器。隨著私有 5G 和容器化控制軟體的成熟,製造業的數位轉型市場將看到連接和運算位置能夠根據生產週期、監管要求或產品配置的變化進行靈活調整和重新配置。
區域分析
亞太地區以每年3.54%的最高成長率領跑,北京和新德里已投入570億美元獎勵本土物聯網和分析服務供應商。中國的補貼政策強制要求採購本地技術棧,從而催生了一個以華為和阿里雲為中心的平行生態系統,重塑了製造業數位轉型市場的競爭動態。印度的補貼政策獎勵與感測器驅動的品管相關的ISO 9001認證,鼓勵中小型零件製造商進入數據平台市場。日本和韓國專注於半導體製造領域的機器人技術和前端自動化,而東南亞的電子產業中心則尋求端到端的數位化可追溯性,以確保來自歐洲的訂單。
預計到2025年,北美將佔全球收入的38.41%,這主要得益於電動車和航太領域的早期採用者,以及三大超大規模雲端服務供應商的存在。美國的超級工廠已經透過專用5G網路協調數千台自主移動機器人,聯邦政府的節能津貼也正推動工廠採用邊緣人工智慧來降低用電高峰。在加拿大,數位孿生技術正在電池組裝進行試點,而墨西哥則吸引了那些需要即時可見性以確保兩小時內交付的近岸供應商。
歐洲正面臨快速普及和監管摩擦並存的困境。將於2027年生效的「數位產品護照」法規將要求電池和紡織品製造商嵌入防篡改序號,從而加速向區塊鏈雲的轉型,同時在資料主權區域內分發分析資料。在德國,1.4億歐元(1.58億美元)的「製造X」代金券計畫為中小企業補貼一半的平台成本。法國正在資助航太領域的檢測自動化,英國則為機器人技術提供25%的稅額扣抵。在南美洲,投資主要集中在汽車和食品供應鏈,特別是巴西和阿根廷。同時,在中東,主權財富基金正在資助建造新的智慧工廠。非洲的試點計畫規模仍然小規模,但對電力穩定投資的增加可能會在本十年後半期促成更大規模計畫的部署。
其他好處:
- Excel格式的市場預測(ME)表
- 3個月的分析師支持
目錄
第1章:引言
- 研究假設和市場定義
- 調查範圍
第2章:調查方法
第3章執行摘要
第4章 市場狀況
- 市場概覽
- 市場促進因素
- 工業IoT平台的普及
- 快速過渡到雲端原生 MES 和 SaaS 解決方案
- 政府支持引入工業4.0的措施
- 提供具有超高可靠性和低延遲控制的專用 5G 網路
- 將量子啟發式最佳化方法整合到複雜調度中
- 數位產品護照的激增要求實現端到端可追溯性。
- 市場限制因素
- OT和IT整合方面人員短缺
- 現有設施網路安全漏洞的嚴重性
- 加強專有資料主權條款,限制跨多個工廠分析
- 高效能運算叢集的隱性碳足跡
- 產業價值鏈分析
- 監理情勢
- 技術展望
- 宏觀經濟因素對市場的影響
- 波特五力分析
第5章 市場規模與成長預測
- 依技術類型
- 工業IoT平台
- 機器人與自動化
- 積層製造和3D列印
- 數位孿生與仿真
- 網路安全解決方案
- 基於雲端的製造執行系統
- 人工智慧和進階分析
- 擴增實境(AR)和虛擬實境(VR)
- 邊緣運算基礎設施
- 其他技術類型
- 部署模式
- 現場
- 雲
- 混合和邊緣
- 按公司規模
- 大公司
- 中小企業
- 按最終用戶行業分類
- 車
- 航太/國防
- 電子和半導體
- 化學與材料
- 食品/飲料
- 藥品和醫療設備
- 重型機械和工業設備
- 消費品
- 其他終端用戶產業
- 按地區
- 北美洲
- 美國
- 加拿大
- 墨西哥
- 南美洲
- 巴西
- 阿根廷
- 其他南美國家
- 歐洲
- 德國
- 英國
- 法國
- 義大利
- 西班牙
- 俄羅斯
- 其他歐洲國家
- 亞太地區
- 中國
- 日本
- 印度
- 韓國
- 東南亞
- 澳洲和紐西蘭
- 其他亞太國家
- 中東
- 沙烏地阿拉伯
- 阿拉伯聯合大公國
- 土耳其
- 其他中東國家
- 非洲
- 南非
- 奈及利亞
- 埃及
- 其他非洲國家
- 北美洲
第6章 競爭情勢
- 市場集中度
- 策略趨勢
- 市佔率分析
- 公司簡介
- Siemens AG
- Schneider Electric SE
- Cisco Systems Inc.
- IBM Corporation
- Microsoft Corporation
- Intel Corporation
- SAP SE
- Oracle Corporation
- Honeywell International Inc.
- Rockwell Automation Inc.
- PTC Inc.
- Dassault Systemes SE
- ABB Ltd.
- Fanuc Corporation
- Mitsubishi Electric Corporation
- General Electric Company
- Bosch Rexroth AG
- Aveva Group plc
- Autodesk Inc.
- Emerson Electric Co.
- Yokogawa Electric Corporation
- Plex Systems Inc.
- Tulip Interfaces Inc.
- Hewlett Packard Enterprise Company
- Nokia Corporation
- Stratasys Ltd.
- UiPath Inc.
- Tata Consultancy Services Ltd.
第7章 市場機會與未來展望
According to Mordor Intelligence, the digital transformation in manufacturing market size is projected to be USD 426.68 billion in 2025, USD 439.56 billion in 2026, and reach USD 499.43 billion by 2031, growing at a CAGR of 2.59% from 2026 to 2031.
This report is Segmented by Technology Type (Industrial IoT Platforms, Robotics and Automation, and More), Deployment Mode (On-Premises, Cloud, and More), Enterprise Size (Large Enterprises, and SMEs), End-User Industry (Automotive, Aerospace and Defense, Chemicals and Materials, Food and Beverage, and More), and Geography. The Market Forecasts are Provided in Terms of Value (USD).
Global Digital Transformation In Manufacturing Market Trends and Insights
Proliferation of Industrial IoT Platforms
Industrial IoT platforms now embed predictive maintenance and in-line quality analytics directly in production cells, cutting unplanned downtime for automotive and aerospace producers by up to 40%. Automakers that unify robots, automated guided vehicles and test benches under one digital thread have shortened model changeovers from weeks to days, which frees capacity for personalized trim packages. Private 5G removes the latency that once forced controllers to stay hard-wired, making IoT the de facto nervous system of next-generation plants. Early adopters report yield gains that compound every quarter because anomaly-detection algorithms continuously retrain on streaming sensor data. Delayed adopters risk permanent cost disadvantages as digital work-instructions and self-healing lines become standard procurement requirements.
Rapid Shift to Cloud-Native MES and SaaS Solutions
Subscription MES platforms replace cap-ex heavy historians and supervisory systems, allowing multi-site planners to rebalance production with a browser instead of weeks of ERP reconfiguration. More than one thousand plants moved core execution to the cloud during 2025, attracted by pay-as-you-go pricing that falls well below the half-million-dollar perpetual licenses of legacy suites. Virtualized controllers hosted on local outposts let safety-critical loops stay on-premises, while dashboards, machine learning training and supplier portals scale elastically off-premises. The model lowers barriers for small and medium enterprises that previously lacked data centers or DevOps teams, leveling the playing field across the digital transformation in manufacturing market.
Skills Shortage in OT-IT Convergence
Manufacturers lack engineers who can code Python and also troubleshoot ladder logic, stretching project timelines by up to two years. Training academies graduate hundreds yet demand runs into thousands, making talent the scarcest resource in the digital transformation in manufacturing industry. The deficit widens competitive gaps because large enterprises fund internal boot camps, while mid-tiers must wait for vendor professional services, adding direct cost and lost opportunity. Automation suppliers respond with low-code interfaces, but complex edge analytics still requires domain specialists, so human capital remains the bottleneck.
Other drivers and restraints analyzed in the detailed report include:
- Government Incentives for Industry 4.0 Adoption
- Availability of Private 5G Networks for Ultra-Reliable Low-Latency Control
- Escalating Cybersecurity Vulnerabilities Across Brown-Field Assets
For complete list of drivers and restraints, kindly check the Table Of Contents.
Segment Analysis
Industrial IoT platforms captured 34.42% of the digital transformation in manufacturing market share in 2025, underscoring their position as the first layer of connectivity that links shop-floor sensors, controllers and enterprise applications. This portion of the digital transformation in manufacturing market size channels real-time machine data into unified data lakes, allowing predictive maintenance algorithms to cut unplanned downtime by double-digit percentages. IoT adoption is now broad enough that incremental value shifts toward higher-order applications, and that shift explains why digital twin and simulation tools are scaling at a 3.47% CAGR through 2031. Manufacturers use virtual replicas to stress-test assembly sequences, validate ergonomics and pre-train machine-learning models before hardware is on the floor, shrinking program launches from months to weeks.
Spending on robotics, additive manufacturing and augmented reality remains meaningful but grows more slowly, because most early movers prefer to extract additional yield from existing cells rather than install more hardware. Cybersecurity, once an afterthought, now appears on capital budgets as a distinct line item because every new device widens the threat surface. Edge processors packed into vision systems keep terabytes of images local, slashing bandwidth fees and enabling sub-second inspection feedback loops that human eyes cannot match. Over the forecast window, technology choices will be driven less by feature counts and more by how seamlessly each layer plugs into open APIs, so that future upgrades can happen without re-engineering the entire stack.
On-premises installations held 56.91% of spending in 2025, reflecting a long-standing preference for tight control over safety-critical loops and intellectual property. That dominance is eroding as hybrid and edge configurations record the fastest 4.82% CAGR, removing the binary choice between plant-floor responsiveness and cloud scalability. Production teams now place deterministic motion control on micro-data-centers a few meters from the line, while training deep-learning models in hyperscale regions overnight. This split architecture trims image-transfer bandwidth by roughly 80% and lets manufacturers stay compliant with data-sovereignty clauses without forgoing analytics firepower.
Pure cloud models still appeal for supplier collaboration, energy dashboards and sustainability reporting, where millisecond latency is not mission-critical. The lesson for buyers is that deployment is becoming an ongoing workload-balancing exercise rather than a one-time infrastructure bet. Vendors that automate this orchestration create tangible cost and performance advantages, because plant personnel no longer need to manage IP addresses or spin up virtual machines on Friday night shifts. As private 5G and containerized control software mature, the digital transformation in manufacturing market will treat connectivity and compute location as levers that can be pulled and reset whenever takt times, regulatory demands or product mixes change.
Complete Report Scope:
- By Technology Type
- Industrial IoT Platforms
- Robotics and Automation
- Additive Manufacturing and 3D Printing
- Digital Twin and Simulation
- Cyber-Security Solutions
- Cloud Manufacturing Execution Systems
- Artificial Intelligence and Advanced Analytics
- Augmented and Virtual Reality
- Edge Computing Infrastructure
- Other Technology Types
- By Deployment Mode
- On-Premises
- Cloud
- Hybrid and Edge
- By Enterprise Size
- Large Enterprises
- Small and Medium Enterprises (SMEs)
- By End-User Industry
- Automotive
- Aerospace and Defense
- Electronics and Semiconductors
- Chemicals and Materials
- Food and Beverage
- Pharmaceuticals and Medical Devices
- Heavy Machinery and Industrial Equipment
- Consumer Goods
- Other End-User Industries
- By Geography
- North America
- United States
- Canada
- Mexico
- South America
- Brazil
- Argentina
- Rest of South America
- Europe
- Germany
- United Kingdom
- France
- Italy
- Spain
- Russia
- Rest of Europe
- Asia-Pacific
- China
- Japan
- India
- South Korea
- South East Asia
- Australia and New Zealand
- Rest of Asia-Pacific
- Middle East
- Saudi Arabia
- United Arab Emirates
- Turkey
- Rest of Middle East
- Africa
- South Africa
- Nigeria
- Egypt
- Rest of Africa
- North America
Geography Analysis
Asia-Pacific posts the highest 3.54% annual growth as Beijing and New Delhi channel USD 57 billion of incentives into domestic IoT and analytics providers. Chinese subsidies mandate local stack procurement, fostering parallel ecosystems around Huawei and Alibaba Cloud and reshaping competitive dynamics of the digital transformation in manufacturing market. Indian disbursements reward ISO 9001 certification tied to sensor-based quality, pulling small component makers onto data platforms. Japan and South Korea focus on robotics and front-end semiconductor automation, while Southeast Asian electronics hubs demand end-to-end digital traceability to win European orders.
North America retains 38.41% of 2025 sales thanks to early electric-vehicle and aerospace adopters and the presence of the three largest hyperscale clouds. U.S. gigafactories already coordinate thousands of autonomous mobile robots over private 5G, and federal energy-efficiency grants steer plants toward edge AI that trims electricity peaks. Canada pilots digital twins for battery assembly, and Mexico attracts near-shored suppliers that need real-time visibility to guarantee two-hour delivery windows.
Europe sits between rapid adoption and regulatory friction. The Digital Product Passport rule, enforceable in 2027, forces battery and textile producers to embed immutable serialization, accelerating migration to blockchain-ready clouds yet splintering analytics across data-sovereign zones. Germany's EUR 140 million (USD 158 million) Manufacturing-X vouchers subsidize half of small enterprise platform costs, France funds aerospace inspection automation, and the United Kingdom offers twenty-five percent tax relief on robotics. South America concentrates spending in Brazil and Argentina across automotive and food chains, while the Middle East funds greenfield smart factories through sovereign wealth channels. Africa's pilots remain small but rising power-stability investments may unlock broader programs later in the decade.
- Siemens AG
- Schneider Electric SE
- Cisco Systems Inc.
- IBM Corporation
- Microsoft Corporation
- Intel Corporation
- SAP SE
- Oracle Corporation
- Honeywell International Inc.
- Rockwell Automation Inc.
- PTC Inc.
- Dassault Systemes SE
- ABB Ltd.
- Fanuc Corporation
- Mitsubishi Electric Corporation
- General Electric Company
- Bosch Rexroth AG
- Aveva Group plc
- Autodesk Inc.
- Emerson Electric Co.
- Yokogawa Electric Corporation
- Plex Systems Inc.
- Tulip Interfaces Inc.
- Hewlett Packard Enterprise Company
- Nokia Corporation
- Stratasys Ltd.
- UiPath Inc.
- Tata Consultancy Services Ltd.
Additional Benefits:
- The market estimate (ME) sheet in Excel format
- 3 months of analyst support
TABLE OF CONTENTS
1 INTRODUCTION
- 1.1 Study Assumptions and Market Definition
- 1.2 Scope of the Study
2 RESEARCH METHODOLOGY
3 EXECUTIVE SUMMARY
4 MARKET LANDSCAPE
- 4.1 Market Overview
- 4.2 Market Drivers
- 4.2.1 Proliferation of Industrial IoT Platforms
- 4.2.2 Rapid Shift to Cloud-Native MES and SaaS Solutions
- 4.2.3 Government Incentives for Industry 4.0 Adoption
- 4.2.4 Availability of Private 5G Networks for Ultra-Reliable, Low-Latency Control
- 4.2.5 Integration of Quantum-Inspired Optimization for Complex Scheduling
- 4.2.6 Surge in Digital Product Passports Mandating End-to-End Traceability
- 4.3 Market Restraints
- 4.3.1 Skills Shortage in OT-IT Convergence
- 4.3.2 Escalating Cybersecurity Vulnerabilities Across Brown-Field Assets
- 4.3.3 Rising Proprietary Data-Sovereignty Clauses Restricting Multi-Plant Analytics
- 4.3.4 Hidden Carbon Footprint of High-Performance Compute Clusters
- 4.4 Industry Value Chain Analysis
- 4.5 Regulatory Landscape
- 4.6 Technological Outlook
- 4.7 Impact of Macroeconomic Factors on the Market
- 4.8 Porter's Five Forces Analysis
- 4.8.1 Bargaining Power of Suppliers
- 4.8.2 Bargaining Power of Buyers
- 4.8.3 Threat of New Entrants
- 4.8.4 Threat of Substitutes
- 4.8.5 Intensity of Competitive Rivalry
5 MARKET SIZE AND GROWTH FORECASTS (VALUE)
- 5.1 By Technology Type
- 5.1.1 Industrial IoT Platforms
- 5.1.2 Robotics and Automation
- 5.1.3 Additive Manufacturing and 3D Printing
- 5.1.4 Digital Twin and Simulation
- 5.1.5 Cyber-Security Solutions
- 5.1.6 Cloud Manufacturing Execution Systems
- 5.1.7 Artificial Intelligence and Advanced Analytics
- 5.1.8 Augmented and Virtual Reality
- 5.1.9 Edge Computing Infrastructure
- 5.1.10 Other Technology Types
- 5.2 By Deployment Mode
- 5.2.1 On-Premises
- 5.2.2 Cloud
- 5.2.3 Hybrid and Edge
- 5.3 By Enterprise Size
- 5.3.1 Large Enterprises
- 5.3.2 Small and Medium Enterprises (SMEs)
- 5.4 By End-User Industry
- 5.4.1 Automotive
- 5.4.2 Aerospace and Defense
- 5.4.3 Electronics and Semiconductors
- 5.4.4 Chemicals and Materials
- 5.4.5 Food and Beverage
- 5.4.6 Pharmaceuticals and Medical Devices
- 5.4.7 Heavy Machinery and Industrial Equipment
- 5.4.8 Consumer Goods
- 5.4.9 Other End-User Industries
- 5.5 By Geography
- 5.5.1 North America
- 5.5.1.1 United States
- 5.5.1.2 Canada
- 5.5.1.3 Mexico
- 5.5.2 South America
- 5.5.2.1 Brazil
- 5.5.2.2 Argentina
- 5.5.2.3 Rest of South America
- 5.5.3 Europe
- 5.5.3.1 Germany
- 5.5.3.2 United Kingdom
- 5.5.3.3 France
- 5.5.3.4 Italy
- 5.5.3.5 Spain
- 5.5.3.6 Russia
- 5.5.3.7 Rest of Europe
- 5.5.4 Asia-Pacific
- 5.5.4.1 China
- 5.5.4.2 Japan
- 5.5.4.3 India
- 5.5.4.4 South Korea
- 5.5.4.5 South East Asia
- 5.5.4.6 Australia and New Zealand
- 5.5.4.7 Rest of Asia-Pacific
- 5.5.5 Middle East
- 5.5.5.1 Saudi Arabia
- 5.5.5.2 United Arab Emirates
- 5.5.5.3 Turkey
- 5.5.5.4 Rest of Middle East
- 5.5.6 Africa
- 5.5.6.1 South Africa
- 5.5.6.2 Nigeria
- 5.5.6.3 Egypt
- 5.5.6.4 Rest of Africa
- 5.5.1 North America
6 COMPETITIVE LANDSCAPE
- 6.1 Market Concentration
- 6.2 Strategic Moves
- 6.3 Market Share Analysis
- 6.4 Company Profiles (includes Global Level Overview, Market Level Overview, Core Segments, Financials as available, Strategic Information, Market Rank/Share, Products and Services, Recent Developments)
- 6.4.1 Siemens AG
- 6.4.2 Schneider Electric SE
- 6.4.3 Cisco Systems Inc.
- 6.4.4 IBM Corporation
- 6.4.5 Microsoft Corporation
- 6.4.6 Intel Corporation
- 6.4.7 SAP SE
- 6.4.8 Oracle Corporation
- 6.4.9 Honeywell International Inc.
- 6.4.10 Rockwell Automation Inc.
- 6.4.11 PTC Inc.
- 6.4.12 Dassault Systemes SE
- 6.4.13 ABB Ltd.
- 6.4.14 Fanuc Corporation
- 6.4.15 Mitsubishi Electric Corporation
- 6.4.16 General Electric Company
- 6.4.17 Bosch Rexroth AG
- 6.4.18 Aveva Group plc
- 6.4.19 Autodesk Inc.
- 6.4.20 Emerson Electric Co.
- 6.4.21 Yokogawa Electric Corporation
- 6.4.22 Plex Systems Inc.
- 6.4.23 Tulip Interfaces Inc.
- 6.4.24 Hewlett Packard Enterprise Company
- 6.4.25 Nokia Corporation
- 6.4.26 Stratasys Ltd.
- 6.4.27 UiPath Inc.
- 6.4.28 Tata Consultancy Services Ltd.
7 MARKET OPPORTUNITIES AND FUTURE OUTLOOK
- 7.1 White-Space and Unmet-Need Assessment

 全球數位轉型市場規模、佔有率、趨勢和成長分析報告(2026-2034)
 印度軟體服務出口:市場佔有率分析、產業趨勢與統計及成長預測(2026-2031)行銷轉型服務市場:市場佔有率分析、產業趨勢與統計、成長預測(2026-2031)數位轉型(DX):市場佔有率分析、產業趨勢與統計、成長預測(2026-2031)
 物流市場數位轉型:2026-2032年全球市場預測數位轉型市場:按產品類型、部署方式、組織規模、應用和產業分類-全球市場預測(2026-2032 年)機場和港口連接的光纖基礎設施:市場佔有率分析、行業趨勢和統計數據以及成長預測(2026-2031 年)數位孿生永續發展平台:市場佔有率分析、產業趨勢與統計、成長預測(2026-2031)美國數位轉型:市場佔有率分析、產業趨勢與統計及成長預測(2026-2031 年)印尼數位轉型:市場佔有率分析、產業趨勢與統計及成長預測(2026-2031)