


 |
市場調查報告書
商品編碼
2099971
GPU散熱解決方案:市佔率分析、產業趨勢與統計、成長預測(2026-2031年)GPU Cooling Solutions - Market Share Analysis, Industry Trends & Statistics, Growth Forecasts (2026 - 2031) |
||||||

※ 本網頁內容可能與最新版本有所差異。詳細情況請與我們聯繫。
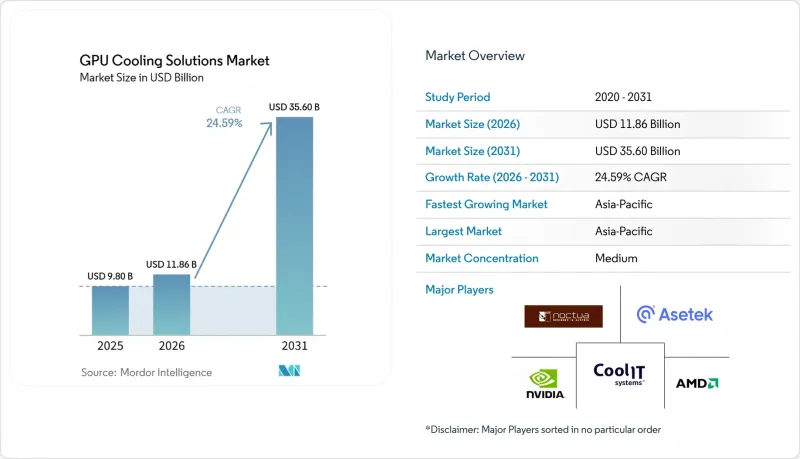
根據 Mordor Intelligence 預測,GPU 散熱解決方案市場規模將從 2025 年的 98 億美元和 2026 年的 118.6 億美元成長到 2031 年的 356 億美元,2026 年至 2031 年的年複合成長率(CAGR)為 24.59%。
本報告按冷卻技術(風冷、水冷、浸沒式冷卻、混合冷卻)、冷卻等級(組件級冷卻、伺服器和機架級冷卻)、部署類型(超大規模和雲端、企業級、政府和研究型高效能運算、其他)、GPU 功率密度(300W 以下地區進行細分。市場預測以美元 (USD) 為單位。
全球GPU散熱解決方案市場趨勢及洞察
隨著GPU功率密度的增加,需要更精密的溫度控管。
NVIDIA 的「Blackwell Ultra」單顆裝置熱設計功耗 (TDP) 達到 1400 瓦,即將推出的「Rubin」系列目標功耗為 1950 瓦,遠超風冷散熱器長期以來 400 瓦的極限。預計到 2028 年,機架級功率密度將超過 240 千瓦,而 2024 年僅為 15 千瓦,這將嚴重限制現有設備的維修空間,並將液冷從一種選擇轉變為一種必要。微軟的 750 瓦「Maia 200」加速器已經採用閉合迴路板將溫度控制在 85 度C以下,這種技術變革很可能在本世紀末將風冷限制在 CPU 和儲存應用領域。
利用 GPU 加速工作負載擴展超大規模資料中心
Meta公司位於路易斯安那州的400萬平方米的「Hyperion」園區和微軟位於亞特蘭大的1吉瓦「Azure AI」超級工廠均專為液冷機架設計,預計到2028年將提供總合1.3吉瓦的GPU容量。公共計畫也反映了這一趨勢;例如,加拿大的「主權計算計畫」(Sovereign Compute Initiative)已累計20億加元(約14.8億美元),計畫在2025年前強制採用液冷技術。在英國的「DAWN」升級工程中,浸沒式冷卻實現了1.12的PUE值。這些建設項目將確保未來幾年對冷卻液分配單元、客製化板和介電液的需求。
液冷和浸沒式冷卻基礎設施的高額資本投入
承包浸沒式冷卻系統的成本通常在每千瓦 800 美元到 1200 美元之間,大約是風冷系統成本的兩倍。此外,採用晶片級直接冷卻套件會使伺服器價格增加 20% 到 40%。儘管初始成本較高,但五年內的總擁有成本 (TCO) 降低幅度通常超過 15%。然而,許多中型企業在獲得經濟實惠的資金籌措方面面臨挑戰。這種財務障礙阻礙了這些先進冷卻解決方案的普及,直到建立更可靠的投資回報模型。因此,由於缺乏廣泛的經濟承受能力和資金籌措機制,整體市場成長受到阻礙。
細分市場分析
預計到2025年,由於能夠利用現有基礎設施且初始投資成本低,風冷在圖形處理器(GPU)散熱解決方案市場中佔了45.50%的佔有率。對於希望在利用現有基礎設施的同時最佳化成本的企業而言,這種方法仍然是首選。然而,隨著浸沒式冷卻解決方案的日益普及,此細分市場的成長速度落後於整體GPU散熱解決方案市場。預計到2031年,浸沒式冷卻解決方案將以25.50%的複合年成長率成長,這主要得益於其消除熱通道和減少資料中心面積高達60%的優勢。 Submer公司於2025年在印度部署的「SmartPod」有效地展示了這些優勢。儘管浸沒式冷卻解決方案具有諸多優勢,但諸如液體處理法規和缺乏統一的介電標準等挑戰仍然阻礙著其廣泛應用,不過目前正在進行相關研發以解決這些問題。
機架級冷板是成長最快的解決方案,它能與開放式運算專案 (OCP) 機架無縫整合,並透過將管道整合為更少的軟管組件,將安裝時間縮短 30%。這些系統因其高效性和與現代資料中心設計的兼容性而日益受到支援。採用 CPU 風冷和 GPU 液冷的混合設計也備受關注。這種方法對那些傾向於分階段工作負載過渡並優先考慮創新與風險管理之間平衡的公司極具吸引力。採用此類混合系統體現了企業謹慎而前瞻性的策略。隨著市場的發展,這些解決方案有望在滿足日益成長的高效 GPU 散熱技術需求方面發揮關鍵作用。
預計到 2025 年,伺服器和機架級冷卻將佔圖形處理器 (GPU) 冷卻解決方案市場的 60.10%,複合年成長率 (CAGR) 為 26.10%。這主要歸功於營運商越來越傾向於採用符合開放式運算專案 (OCP) 機架標準的模組化冷卻液分配單元。這些系統支援機架級部署,並協助資料中心營運商有效管理更高的熱負荷。單一冷卻液分配單元即可支援多達 40 台伺服器,從而節省成本,減少對大規模管道基礎設施的需求,並減輕持續維護的負擔。
在對延遲要求極高且需要在裝置層級進行精確熱控制的部署環境中,組件級冷板仍然至關重要。例如,Frore Systems 為 1950W GPU 設計的冷板等技術能夠實現局部熱最佳化,有助於延長硬體壽命並支援高性能 GPU運作,但同時也增加了每個節點的複雜性。長期發展取決於預計 2026 年底最終確定的 IEEE互通性標準。該標準將支援冷板介面的多廠商相容性,從而有望促進在異質基礎設施環境中的部署。
區域分析
預計到2025年,亞太地區將佔全球銷售額的66.90%,到2031年,其複合年成長率將達到28.20%,超過其他任何地區,凸顯了其在GPU散熱解決方案需求方面的主導地位。日本、韓國和新加坡的國家級人工智慧推廣政策持續資助國內GPU叢集建設,這些集群需要滿足嚴格的能源效率目標,使得液冷成為大規模人工智慧基礎設施事實上的最佳實踐。日本NTT公司已承諾在品川地區採用浸沒式冷卻技術,確保1GW的GPU容量。同時,新加坡部署的58MW Nxera系統在潮濕的熱帶氣候下實現了1.25的PUE值,顯示先進的冷卻系統即使在惡劣的氣候條件下也能支援高密度運算環境。
北美地區銷售額位居第二,主要得益於Meta Hyperion和微軟亞特蘭大超級工廠等超大規模項目。預計到2028年,這兩個項目合計將新增超過1.5吉瓦的GPU容量。這些專案持續推動該地區對高效能冷卻架構的需求,這些架構能夠支援高密度人工智慧和加速運算工作負載。政府主導的計劃,例如加拿大的主權計算計劃,進一步刺激了需求,但供應限制,例如冷板和水泵24週的前置作業時間,可能會將收入確認時間推遲到2027年下半年。
儘管歐洲在高效能運算領域落後於亞太地區和北美,但在2024/1364號授權條例的推動下,歐洲正持續加速發展。該條例設定了2030年PUE(電源使用效率)上限為1.5,並鼓勵業者更有效溫度控管。諸如EuroHPC的HammerHAI等百億億百萬兆級專案正在強化液冷技術在下一代高效能運算基礎設施中的作用。同時,德國的區域供熱激勵措施正幫助業者將廢熱貨幣化,進而提高投資報酬率(ROI)。中東和非洲地區仍在發展中,但阿拉伯聯合大公國和沙烏地阿拉伯等國政府主導的人工智慧專案計劃在2027年後建造專用設施,顯示隨著該地區人工智慧基礎設施投資的擴大,未來仍有巨大的成長潛力。
其他好處:
- Excel格式的市場預測(ME)表
- 3個月的分析師支持
目錄
第1章:引言
- 研究假設和市場定義
- 調查範圍
第2章:調查方法
第3章執行摘要
第4章 市場狀況
- 市場概覽
- 市場促進因素
- 隨著GPU功率密度的增加,需要更精密的溫度控管。
- 利用GPU加速工作負載擴展超大規模資料中心
- 高效能運算和人工智慧叢集集中水冷技術的應用日益廣泛
- 政府針對資料中心的能源效率法規
- 用於邊緣和微型資料中心的模組化浸入式冷卻艙已經問世。
- 人工智慧驅動的熱遙測技術的整合正在推動預測性冷卻最佳化。
- 市場限制因素
- 液冷和浸沒式冷卻基礎設施的高額資本投入
- 與傳統伺服器機架和機房佈局的兼容性問題。
- 冷卻劑產業標準缺失
- 先進冷板和幫浦組件的供應鏈限制
- 產業價值鏈分析
- 監理情勢
- 技術展望
- 宏觀經濟因素對市場的影響
- 波特五力分析
第5章 市場規模與成長預測
- 按類型分類的冷卻技術
- 空冷式
- 液冷(直接冷卻至噴嘴)
- 浸沒式冷卻
- 混合冷卻
- 冷卻程度
- 組件級冷卻
- 伺服器和機架級冷卻
- 不同的發展
- 超大規模和雲
- 公司
- 政府和研究機構(高效能運算)
- 邊緣
- 按類型分類的GPU功率密度
- 小於300瓦
- 300W~700W
- 700瓦或以上
- 按地區
- 北美洲
- 美國
- 加拿大
- 墨西哥
- 歐洲
- 德國
- 英國
- 法國
- 義大利
- 其他歐洲國家
- 亞太地區
- 中國
- 日本
- 韓國
- 印度
- 東南亞
- 其他亞太國家
- 中東和非洲
- 北美洲
第6章 競爭情勢
- 市場集中度
- 策略趨勢
- 市佔率分析
- 公司簡介
- CoolIT Systems Inc.
- Asetek A/S
- Noctua GmbH
- EKWB doo
- Nvidia Corporation
- Advanced Micro Devices, Inc.
- Dell Technologies Inc.
- Hewlett Packard Enterprise Company
- Lenovo Group Limited
- Super Micro Computer, Inc.
- Corsair Gaming, Inc.
- Arctic GmbH
- ASUStek Computer Inc.
- Giga-Byte Technology Co., Ltd.
- Alphacool International GmbH
- Phanteks Company BV
- Thermaltake Technology Co., Ltd.
- Fujitsu Limited
- Inspur Systems Inc.
- LiquidStack Inc.
- Submer Technologies SL
第7章 市場機會與未來展望
According to Mordor Intelligence, the GPU cooling solutions market size is projected to expand from USD 9.80 billion in 2025 and USD 11.86 billion in 2026 to USD 35.60 billion by 2031, registering a CAGR of 24.59% between 2026 and 2031.
This report is Segmented by Cooling Technology (Air Cooling, Liquid Cooling, Immersion Cooling, and Hybrid Cooling), Cooling Level (Component-Level Cooling, and Server and Rack-Level Cooling), Deployment (Hyperscale and Cloud, Enterprise, Government and Research HPC, and More), GPU Power Density (Below 300W, 300W-700W, and More), and Geography. The Market Forecasts are Provided in Terms of Value (USD).
Global GPU Cooling Solutions Market Trends and Insights
Growing GPU Power Densities Requiring Advanced Thermal Management
NVIDIA's Blackwell Ultra pushes 1,400 W TDP per device, and the forthcoming Rubin series targets 1,950 W, eclipsing the 400 W ceiling long assumed for air-cooled heat sinks. Rack-level densities climbed from 15 kW in 2024 to projections above 240 kW by 2028, leaving retrofit windows razor-thin and turning liquid cooling from an option to a mandate. Microsoft's 750 W Maia 200 accelerator already relies on closed-loop plates to stay below 85 °C, a technical inflection likely to push air cooling into CPU-only or storage lanes by the decade's close.
Expansion of Hyperscale Data Centers with GPU-Accelerated Workloads
Meta's 4 million ft2 Hyperion campus in Louisiana and Microsoft's 1 GW Azure AI superfactory in Atlanta are purpose-built for liquid racks and will deliver a combined 1.3 GW of GPU capacity by 2028. Public programs mirror the trend, for instance, Canada's Sovereign Compute Initiative set aside CAD 2 billion (USD 1.48 billion) in 2025 with a mandate for liquid cooling, and the UK's DAWN upgrade achieved a 1.12 PUE through immersion cooling. These builds guarantee multi-year demand for coolant-distribution units, custom plates, and dielectric fluids.
High Capital Expenditure of Liquid and Immersion Cooling Infrastructure
Turnkey immersion systems typically cost between USD 800 and 1,200 per kW, which is approximately double the cost of air-cooled systems. Additionally, direct-to-chip cooling kits increase server pricing by 20% to 40%. Despite these higher upfront costs, the five-year total cost of ownership savings often exceed 15%. However, many mid-tier operators face challenges in accessing affordable financing options. This financial barrier delays the adoption of these advanced cooling solutions until more reliable payback models are established. As a result, the market's growth is hindered by the lack of widespread affordability and financing mechanisms.
Other drivers and restraints analyzed in the detailed report include:
- Increasing Adoption of Liquid Cooling in HPC and AI Clusters
- Government Energy Efficiency Regulations for Data Centers
- Compatibility Issues with Legacy Server Racks and Facility Layouts
For complete list of drivers and restraints, kindly check the Table Of Contents.
Segment Analysis
Air cooling held 45.50% of the Graphics Processing Unit (GPU) cooling solutions market share in 2025 because it leverages existing facilities and carries lower upfront capital. This method remains a preferred choice for enterprises looking to optimize costs while utilizing existing infrastructure. However, the segment's growth lags behind the overall GPU cooling solutions market as immersion solutions gain traction. Immersion solutions are projected to grow at a 25.50% CAGR through 2031, driven by their ability to eliminate hot aisles and reduce the data center footprint by up to 60%. Submer's 2025 SmartPod rollout in India demonstrated these advantages effectively. Despite these benefits, challenges such as fluid-disposal regulations and the absence of unified dielectric standards continue to hinder widespread adoption, though ongoing R&D efforts aim to address these issues.
Rack-level cold plates are expanding fastest because they integrate neatly with Open Compute Project racks and consolidate plumbing into fewer hose assemblies, slashing installation time by 30%. These systems are increasingly favored for their efficiency and compatibility with modern data center designs. Hybrid designs, which use air cooling for CPUs and liquid cooling for GPUs, are also gaining traction. This approach appeals to enterprises that prefer a phased migration of workloads, balancing innovation with risk management. The adoption of such hybrid systems reflects a cautious yet progressive strategy among enterprises. As the market evolves, these solutions are expected to play a critical role in addressing the growing demand for efficient GPU cooling technologies.
Server and rack-level cooling accounted for 60.10% of the graphics processing unit (GPU) cooling solutions market in 2025 and is poised for a 26.10% CAGR, as operators increasingly favor modular coolant distribution units that align with Open Compute Project racks. These systems support rack-level deployment and help data center operators manage higher thermal loads more efficiently. Cost savings result from serving up to 40 servers per coolant distribution unit, reducing the need for extensive plumbing infrastructure and lowering ongoing maintenance overhead.
Component-level cold plates remain vital in deployments where sub-millisecond latency is paramount and precise device-level thermal control is required. Technologies such as Frore Systems' generatively designed plates for 1,950 W GPUs enable localized thermal optimization, helping extend hardware lifespan while supporting high-performance GPU operation, although they introduce higher per-node complexity. Long-term growth depends on IEEE interoperability standards scheduled for late 2026, which may support multi-vendor interchangeability for cold-plate interfaces and improve adoption across heterogeneous infrastructure environments.
Complete Report Scope:
- By Cooling Technology
- Air Cooling
- Liquid Cooling (Direct-to-Chip)
- Immersion Cooling
- Hybrid Cooling
- By Cooling Level
- Component-Level Cooling
- Server and Rack-Level Cooling
- By Deployment
- Hyperscale and Cloud
- Enterprise
- Government and Research (HPC)
- Edge
- By GPU Power Density
- Below 300W
- 300W - 700W
- Above 700W
- By Geography
- North America
- United States
- Canada
- Mexico
- Europe
- Germany
- United Kingdom
- France
- Italy
- Rest of Europe
- Asia-Pacific
- China
- Japan
- South Korea
- India
- Southeast Asia
- Rest of Asia-Pacific
- Middle East and Africa
- North America
Geography Analysis
Asia-Pacific retained 66.90% of global revenue in 2025, and its 28.20% CAGR through 2031 outstrips every other region, underscoring the region's leading role in GPU cooling solutions demand. National AI mandates in Japan, South Korea, and Singapore continue to fund domestic GPU clusters that must satisfy strict energy-efficiency targets, effectively making liquid cooling a preferred best practice for large-scale AI infrastructure. Japan's NTT pledged 1 GW of GPU capacity at Shinagawa using immersion cooling, while Singapore's 58 MW Nxera deployment validated PUE 1.25 operation in a humid tropical climate, demonstrating that advanced cooling systems can support high-density compute environments under challenging weather conditions.
North America ranks second by revenue, supported by hyperscale projects such as Meta Hyperion and Microsoft's Atlanta superfactory, which together are expected to add over 1.5 GW of GPU capacity before 2028. These projects continue to strengthen regional demand for high-performance cooling architectures capable of supporting dense AI and accelerated computing workloads. Government initiatives, including Canada's Sovereign Compute Initiative, add another layer of demand, but 24-week lead times for cold plates and pumps remain a supply-side constraint and may defer revenue recognition into late 2027.
Europe trails Asia-Pacific and North America but continues to gain momentum under Delegated Regulation 2024/1364, which sets a PUE ceiling of 1.5 by 2030 and pushes operators toward more efficient thermal management. Exascale programs such as EuroHPC's HammerHAI reinforce liquid cooling's role in next-generation high-performance computing infrastructure, while district-heating incentives in Germany allow operators to monetize waste heat and improve return on investment. The Middle East and Africa remain nascent, though sovereign AI projects in the United Arab Emirates and Saudi Arabia are planning purpose-built facilities for 2027 and beyond, indicating potential upside as regional AI infrastructure investment scales.
- CoolIT Systems Inc.
- Asetek A/S
- Noctua GmbH
- EKWB d.o.o.
- Nvidia Corporation
- Advanced Micro Devices, Inc.
- Dell Technologies Inc.
- Hewlett Packard Enterprise Company
- Lenovo Group Limited
- Super Micro Computer, Inc.
- Corsair Gaming, Inc.
- Arctic GmbH
- ASUStek Computer Inc.
- Giga-Byte Technology Co., Ltd.
- Alphacool International GmbH
- Phanteks Company B.V.
- Thermaltake Technology Co., Ltd.
- Fujitsu Limited
- Inspur Systems Inc.
- LiquidStack Inc.
- Submer Technologies S.L.
Additional Benefits:
- The market estimate (ME) sheet in Excel format
- 3 months of analyst support
TABLE OF CONTENTS
1 INTRODUCTION
- 1.1 Study Assumptions and Market Definition
- 1.2 Scope of the Study
2 RESEARCH METHODOLOGY
3 EXECUTIVE SUMMARY
4 MARKET LANDSCAPE
- 4.1 Market Overview
- 4.2 Market Drivers
- 4.2.1 Growing GPU Power Densities Requiring Advanced Thermal Management
- 4.2.2 Expansion of Hyperscale Data Centers with GPU-Accelerated Workloads
- 4.2.3 Increasing Adoption of Liquid Cooling in HPC and AI Clusters
- 4.2.4 Government Energy Efficiency Regulations for Data Centers
- 4.2.5 Emergence of Modular Immersion Cooling Pods for Edge Micro-DCs
- 4.2.6 Integration of AI-Based Thermal Telemetry Driving Predictive Cooling Optimization
- 4.3 Market Restraints
- 4.3.1 High Capital Expenditure of Liquid and Immersion Cooling Infrastructure
- 4.3.2 Compatibility Issues with Legacy Server Racks and Facility Layouts
- 4.3.3 Limited Industry Standards for Coolant Fluids
- 4.3.4 Supply Chain Constraints for Advanced Cold Plates and Pump Components
- 4.4 Industry Value Chain Analysis
- 4.5 Regulatory Landscape
- 4.6 Technological Outlook
- 4.7 Impact of Macroeconomic Factors on the Market
- 4.8 Porter's Five Forces Analysis
- 4.8.1 Bargaining Power of Suppliers
- 4.8.2 Bargaining Power of Buyers
- 4.8.3 Threat of New Entrants
- 4.8.4 Threat of Substitutes
- 4.8.5 Competitive Rivalry
5 MARKET SIZE AND GROWTH FORECASTS (VALUE)
- 5.1 By Cooling Technology
- 5.1.1 Air Cooling
- 5.1.2 Liquid Cooling (Direct-to-Chip)
- 5.1.3 Immersion Cooling
- 5.1.4 Hybrid Cooling
- 5.2 By Cooling Level
- 5.2.1 Component-Level Cooling
- 5.2.2 Server and Rack-Level Cooling
- 5.3 By Deployment
- 5.3.1 Hyperscale and Cloud
- 5.3.2 Enterprise
- 5.3.3 Government and Research (HPC)
- 5.3.4 Edge
- 5.4 By GPU Power Density
- 5.4.1 Below 300W
- 5.4.2 300W - 700W
- 5.4.3 Above 700W
- 5.5 By Geography
- 5.5.1 North America
- 5.5.1.1 United States
- 5.5.1.2 Canada
- 5.5.1.3 Mexico
- 5.5.2 Europe
- 5.5.2.1 Germany
- 5.5.2.2 United Kingdom
- 5.5.2.3 France
- 5.5.2.4 Italy
- 5.5.2.5 Rest of Europe
- 5.5.3 Asia-Pacific
- 5.5.3.1 China
- 5.5.3.2 Japan
- 5.5.3.3 South Korea
- 5.5.3.4 India
- 5.5.3.5 Southeast Asia
- 5.5.3.6 Rest of Asia-Pacific
- 5.5.4 Middle East and Africa
- 5.5.1 North America
6 COMPETITIVE LANDSCAPE
- 6.1 Market Concentration
- 6.2 Strategic Moves
- 6.3 Market Share Analysis
- 6.4 Company Profiles (includes Global Level Overview, Market Level Overview, Core Segments, Financials as available, Strategic Information, Market Rank/Share, Products and Services, Recent Developments)
- 6.4.1 CoolIT Systems Inc.
- 6.4.2 Asetek A/S
- 6.4.3 Noctua GmbH
- 6.4.4 EKWB d.o.o.
- 6.4.5 Nvidia Corporation
- 6.4.6 Advanced Micro Devices, Inc.
- 6.4.7 Dell Technologies Inc.
- 6.4.8 Hewlett Packard Enterprise Company
- 6.4.9 Lenovo Group Limited
- 6.4.10 Super Micro Computer, Inc.
- 6.4.11 Corsair Gaming, Inc.
- 6.4.12 Arctic GmbH
- 6.4.13 ASUStek Computer Inc.
- 6.4.14 Giga-Byte Technology Co., Ltd.
- 6.4.15 Alphacool International GmbH
- 6.4.16 Phanteks Company B.V.
- 6.4.17 Thermaltake Technology Co., Ltd.
- 6.4.18 Fujitsu Limited
- 6.4.19 Inspur Systems Inc.
- 6.4.20 LiquidStack Inc.
- 6.4.21 Submer Technologies S.L.
7 MARKET OPPORTUNITIES AND FUTURE OUTLOOK
- 7.1 White-Space and Unmet-Need Assessment

 資料中心晶片直接冷卻液:市場佔有率分析、行業趨勢和統計數據以及成長預測(2026-2031 年)
 2026年資料中心機架式CDU幫浦全球市場研究報告資料中心液冷:市場佔有率分析、產業趨勢與統計、成長預測(2026-2031)中國GPU散熱解決方案:市佔率分析、產業趨勢與統計及成長預測(2026-2031年)GPU液冷:市佔率分析、產業趨勢與統計、成長預測(2026-2031)歐洲GPU液冷:市佔率分析、產業趨勢與統計及成長預測(2026-2031年)北美GPU液冷市場:市佔率分析、產業趨勢與統計及成長預測(2026-2031年)
 資料中心液冷市場:依冷卻技術、組件、液體類型、基礎架構層、資料中心類型、最終用戶產業及資料中心規模分類-2026-2032年全球市場預測
 全球資料中心液冷歧管市場:按歧管類型、冷卻類型、材料類型、設計類型、資料中心類型、安裝類型和地區分類-預測至2033年
 資料中心液冷市場:按組件、冷卻類型、資料中心類型、企業規模和最終用戶產業分類-市場規模、產業動態、機會分析和預測(2026-2035 年)