


 |
市場調查報告書
商品編碼
2099942
GPU液冷:市佔率分析、產業趨勢與統計、成長預測(2026-2031)GPU Liquid Cooling - Market Share Analysis, Industry Trends & Statistics, Growth Forecasts (2026 - 2031) |
||||||

※ 本網頁內容可能與最新版本有所差異。詳細情況請與我們聯繫。
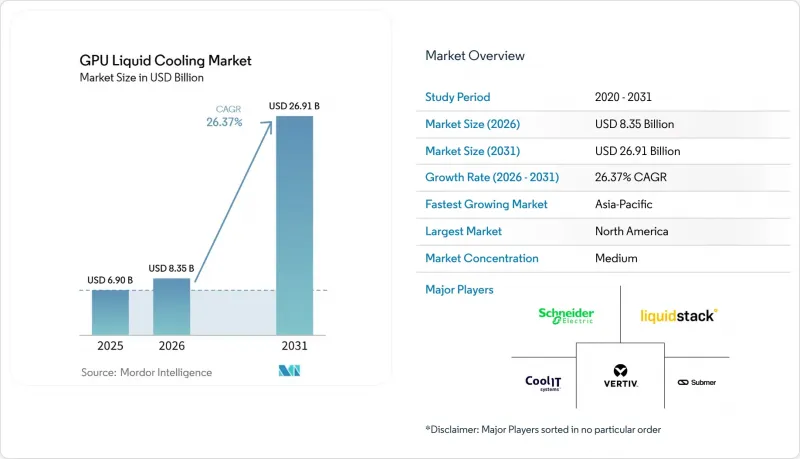
據 Mordor Intelligence 稱,GGPU 液冷市場預計將從 2025 年的 69 億美元成長到 2026 年的 83.5 億美元,到 2031 年達到 269.1 億美元,2026 年至 2031 年的複合年成長率為 26.37%。
本報告按冷卻方式(單相液冷和兩相液冷)、冷卻等級(組件級冷卻和伺服器機架級冷卻)、部署領域(超大規模雲、企業級、政府/科研高效能運算、邊緣人工智慧)、GPU功率密度(低於300瓦、300瓦至700瓦以及高於700瓦)和地區細分。市場預測以美元計價。
全球顯示卡液冷市場趨勢及洞察
隨著超大規模機架密度的增加,液冷正成為主流。
預計機架級功率密度將從2024年的27千瓦飆升至2026年的100千瓦以上,一些大型園區已經開始測試250千瓦的機架。在如此高的熱負荷下,維持足夠的風速變得不切實際,而噪音限制又阻礙了風扇轉速的進一步提升。因此,營運商正在對現有機房進行改造,加裝能夠承受45度C供水溫度的冷卻劑分配裝置,使冷卻器能夠全年以節熱器模式運作。早期採用者報告稱,建築面積減少了35%,混凝土和鋼材成本節省超過1.8億美元。由此帶來的轉變顯而易見,相關成本已直接累計超大規模資料中心的資本支出計劃,而不是像以往那樣作為營運費用遞延。
OEM平台消除了整合障礙
伺服器製造商已將液冷從小眾選項轉變為高效能GPU節點的標準配置。 NVIDIA GB200、AMD MI325X和Supermicro X14系統現在出廠時就配備了冷板、快速接頭和洩漏偵測迴路。這種承包的解決方案將機架級安裝時間從16小時縮短到不到3小時,試運行工作也減少了80%。液冷機型在相同的功耗預算下可以保持高達18%的更高時脈頻率,從而為最終用戶提供即時的效能提升空間。訊息很明確:液冷不再是稀有配置,而是旗艦級AI硬體的標配。
高昂的初始投資成本減緩了浸沒式冷卻技術的普及。
浸沒式冷卻槽的成本比風冷方案高出30%到50%,比單相冷板高出15%,這使得初始投資成為許多買家面臨的主要障礙。使用絕緣液會進一步增加部署成本,每個機架需額外花費1.5萬至3萬美元。營運商還需要預算年度補充成本,這可能高達總液體量的近10%。對於通常每三年升級或更換一次硬體的公司而言,這些額外成本會延長投資回收期,使其超出可接受的投資週期,從而減緩部署速度並延緩廣泛應用。供應商目前正試圖透過採用通用冷卻液、簡化系統設計和標準化冷卻槽尺寸來降低成本,旨在擴大生產規模並提高安裝效率。然而,許多觀察家預測,浸沒式冷卻的價格要到2028年或更晚才能與競爭方案相提並論。
細分市場分析
到 2025 年,單相系統將佔銷售額的 73%。這反映了十年來單相系統在運作上的成熟以及與現有冷卻器的無縫整合。這些系統循環使用 30 度C至 45 度C的水-乙二醇混合物,可吸收高達 85% 的晶片熱量,並可直接整合到現有建築的冷卻迴路中。由於超大規模資料超大規模資料中心業者在開放運算專案 (OCP) 下對歧管設計進行了標準化,單相 GGPU 液冷市場受益匪淺,整合工作量減少了近五分之一。聯想 Neptune、戴爾 PowerEdge XE9680L 和 HPE Cray EX 伺服器的持續出貨維持了部署基礎,尤其是在 700 瓦加速器仍然佔據主導地位的工作負載領域。
預計兩相平台將以 27.80% 的複合年成長率成長,成為 GGPU 液冷市場中成長最快的細分領域。蒸發式冷板可直接吸收矽晶圓上超過 1000 瓦的幾乎所有熱負荷,並將高溫液體送回冷卻器,從而在一年中的大部分時間實現近乎免費的冷卻。 Vertiv 的 Liebert PCW 和 ZutaCore 的 HyperCool 的現場測試表明,晶片級的散熱率高達 98%,冷卻能耗減半,同時釋放機架空間用於電源轉換設備。介電材料管理對材料相容性提出了更嚴格的要求,但超大規模資料中心業者正在仔細權衡這些成本與建造全新機房以容納未來 Blackwell Ultra叢集的方案。
2025年,組件級冷板的市佔率預計將維持在56%,這主要得益於伺服器OEM廠商的出貨量。對於正在進行分階段維修的企業而言,直連式冷板是一個極具吸引力的選擇,因為它們無需更換伺服器機殼,並且可以利用標準化的快速斷開連接。冷板迴路還能透過最大限度地減少冷卻液庫存來降低環境風險,並且只需極少的文書工作即可滿足保險公司的要求。然而,它們需要在每個節點進行管道鋪設,並且由於排氣溫度低於50 度C,因此無法充分利用熱回收方案。
機架級浸沒式冷卻預計將以每年 28.10% 的速度成長。 Submer、GRC 和 LiquidStack 等水箱可在現有樓層網格內安裝 200 kW 機架,將安裝時間縮短至半天以內,並允許在運作中進行維護,從而簡化了維護工作。在位元組跳動宣布其 PUE 值達到 1.08,在廢熱回收率達到 85% 後,GPU 浸沒式冷卻的市佔率激增,影響了中國當地的籌資策略。財務模型顯示,當電價超過每千瓦時 0.10 美元時,浸沒式冷卻帶來的成本節約可在三年內抵消較高的初始投資成本,從而在總擁有成本 (TCO) 計算中具有決定性優勢。
區域分析
預計到2025年,亞太地區將佔全球銷售額的68%,並在2031年之前維持29.10%的年均成長率。在中國,數十億美元正透過國家主導的人工智慧專案投資建構國家級GPU叢集;而在東南亞,稅收優惠政策正推動CDU和快速斷開連接器的在地化生產。位元組跳動宣布其天津園區PUE值達到1.08,並與國內雲端服務供應商共用了相關藍圖,這示範效應將對整個地區的託管市場產生深遠影響。同時,日本和韓國正透過政府津貼投資建造液冷晶圓廠,以確保區域供應穩定,以應對出口限制帶來的不確定性。
儘管北美在規模上落後於亞太地區,但在技術應用和監管力度方面卻處於領先。加州第24號法規以及美國聯邦政府對區域能源合作的推動,都要求新建設設施在未來10年內達到低於1.18的PUE值。超大規模業者正積極採取措施降低合規風險,例如在維吉尼亞和亞利桑那州開展分兩階段進行的試點計畫。加拿大寒冷的氣候使得利用伺服器廢熱更具吸引力,魁北克省的電力公司為接入廢熱回收設施的用戶提供電價折扣,並在部分都市區將投資回收期縮短至24個月。
在歐洲,多種促進因素正在發揮作用,包括德國實施法定PUE上限、法國將電網使用費與能源效率評分掛鉤,以及北歐國家在現有區域供熱網路中實現餘熱再利用的商業化。這些政策共同加快了部署進度,並從餘熱銷售中創造了可觀的二次收益。然而,歐洲營運商也面臨著逐步淘汰高全球暖化潛值(GWP)冷媒的壓力,供應商必須在設施運作截止日期前獲得碳氫化合物或酯類配方的認證。這種雙重壓力催生了一個充滿活力的供應商格局,其中包括變壓器油專家、大型化學品製造商和新成立的流體回收商。
其他好處:
- Excel格式的市場預測(ME)表
- 3個月的分析師支持
目錄
第1章:引言
- 研究假設和市場定義
- 調查範圍
第2章:調查方法
第3章執行摘要
第4章 市場狀況
- 市場概覽
- 市場促進因素
- 超過 120 kW 的超大規模 GPU 機架的高密度正在加速液冷技術的普及。
- OEM廠商紛紛推出水冷GPU平台:NVIDIA、AMD、Supermicro
- 加強北美和歐洲資料中心PUE法規
- 區域供熱網路中熱能再利用的獎勵
- TDP超過1kW的下一代AI ASIC需要兩階段解決方案。
- CDU 和快速斷開連接器供應鏈在東南亞的局部化
- 市場限制因素
- 浸入式系統的高額資本投資溢價
- 關於含氟冷媒的環境法規
- 邊緣人工智慧改裝領域缺乏專業知識
- 政府高效能運算設施的遴選週期很長
- 產業價值鏈分析
- 監理情勢
- 技術展望
- 宏觀經濟因素對市場的影響
- 波特五力分析
第5章 市場規模與成長預測
- 透過冷卻方式
- 單相液體冷卻
- 兩相液冷
- 冷卻程度
- 組件級冷卻
- 伺服器機架級冷卻
- 不同的發展
- 超大規模雲
- 公司
- 面向政府和研究機構的高效能運算 (HPC)
- 邊緣人工智慧
- 按類型分類的GPU功率密度
- 小於300瓦
- 300 W~700 W
- 700瓦或以上
- 按地區
- 北美洲
- 美國
- 加拿大
- 墨西哥
- 歐洲
- 德國
- 英國
- 法國
- 義大利
- 其他歐洲國家
- 亞太地區
- 中國
- 日本
- 韓國
- 印度
- 東南亞
- 其他亞太國家
- 南美洲
- 巴西
- 其他南美國家
- 中東和非洲
- 北美洲
第6章 競爭情勢
- 市場集中度
- 策略趨勢
- 市佔率分析
- 公司簡介
- Vertiv Group Corporation
- Schneider Electric SE
- CoolIT Systems Inc.
- LiquidStack Holdings Inc.
- Submer Technologies SL
- Green Revolution Cooling Inc.
- Asetek AS
- Iceotope Technologies Ltd.
- Fujitsu Ltd.
- Dell Technologies Inc.
- Hewlett Packard Enterprise Company
- Lenovo Group Ltd.
- Super Micro Computer Inc.
- BOYD Corporation
- Delta Electronics Inc.
- Parker Hannifin Corporation
- CPC Colder Products Company
- Danfoss AS
- Staubli International AG
- Zutacore Ltd.
- LiquidCool Solutions Inc.
- Asperitas BV
第7章 市場機會與未來展望
According to Mordor Intelligence, the GPU liquid cooling market size is expected to increase from USD 6.90 billion in 2025 to USD 8.35 billion in 2026 and reach USD 26.91 billion by 2031, growing at a CAGR of 26.37% over 2026-2031.
This report is Segmented by Cooling Type (Single-Phase Liquid Cooling, and Two-Phase Liquid Cooling), Cooling Level (Component-Level Cooling, and Server Rack-Level Cooling), Deployment (Hyperscale Cloud, Enterprise, Government and Research HPC, and Edge AI), GPU Power Density (Below 300 W, 300 W-700 W, and Above 700 W), and Geography. The Market Forecasts are Provided in Terms of Value (USD).
Global GPU Liquid Cooling Market Trends and Insights
Hyperscale Rack Density Pushes Liquid Cooling Into the Mainstream
Rack-level power density ballooned from 27 kW in 2024 to well above 100 kW in 2026, and leading campuses already test 250 kW racks. At these thermal loads, airflow velocity becomes impractical, and acoustic limits prohibit further fan speed increases. Operators therefore retrofit existing halls with coolant distribution units that tolerate 45 °C supply temperatures, allowing chillers to run in economizer mode all year. Early adopters documented 35% smaller building footprints, saving more than USD 180 million in avoided concrete and steel. The outcome is a visible migration budgeted directly into hyperscale capital-expenditure plans rather than deferred operational spending.
OEM Platforms Remove Integration Barriers
Server manufacturers moved liquid cooling from a specialized option to a default for high-performance GPU nodes. Factory-installed cold plates, quick disconnects, and leak-detection loops now ship on NVIDIA GB200, AMD MI325X, and Supermicro X14 systems. The turnkey approach cuts rack-level installation time from 16 hours to less than three, reducing commissioning labor by 80%. End users gain immediate performance headroom, as liquid-cooled variants sustain up to 18% higher clock frequencies under the same power envelope. The commercial message is clear that liquid cooling is no longer exotic; it is the shipping configuration for flagship AI hardware.
Capital Cost Premium Slows Immersion Uptake
Immersion tanks cost 30%-50% more than air-based cooling solutions and continue to carry a 15% cost uplift over single-phase cold plates, making upfront capital expenditure a key barrier for many buyers. Dielectric fluids further increase deployment costs, adding USD 15,000-30,000 per rack, and operators must budget for yearly top-offs that can approach 10% of total fluid volume. For enterprises that typically refresh or renew hardware every three years, these added costs extend the payback period beyond acceptable investment horizons, slowing adoption and delaying broader rollouts. Vendors are now pursuing cost reductions by using commodity fluids, simplifying system designs, and standardizing tank dimensions to improve manufacturing scale and installation efficiency. However, most observers expect immersion cooling to reach price parity with competing solutions only after 2028.
Other drivers and restraints analyzed in the detailed report include:
- Two-Phase Technology Answers 1 kW-Plus Chips
- Regulation Turns Efficiency From Nice-to-Have Into Legal Requirement
- Environmental Rules Complicate Coolant Choice
For complete list of drivers and restraints, kindly check the Table Of Contents.
Segment Analysis
Single-phase systems accounted for 73% of revenue in 2025, reflecting a decade-long field maturity and seamless integration with legacy chillers. These installations circulate water-glycol mixtures between 30 °C and 45 °C, capture up to 85% of chip heat, and slot directly into existing building chilled-water loops. The GPU liquid-cooling market for single-phase solutions benefited from hyperscalers standardizing on manifold designs under the Open Compute Project, trimming integration labor by nearly one-fifth. Continued shipments of Lenovo Neptune, Dell PowerEdge XE9680L, and HPE Cray EX servers sustain the installed base, especially for workloads where 700-watt accelerators remain dominant.
Two-phase platforms are projected to grow at a 27.80% CAGR, making them the fastest-growing segment of the GPU liquid cooling market. Evaporative cold plates capture almost the entire 1,000-watt-plus heat load directly on silicon, returning liquid to chillers at elevated temperatures that support near-free cooling for much of the year. Vertiv Liebert PCW and ZutaCore HyperCool field trials demonstrate 98% chip-level heat capture, halving cooling energy use and freeing rack space for power-conversion gear. Though dielectric management imposes stricter material compatibility rules, hyperscalers weigh those costs against the alternative of building entirely new halls to house future Blackwell Ultra clusters.
Component-level cold plates retained 56% share in 2025, underpinned by ship-through volumes from server OEMs. Direct-to-chip plates require no new server enclosures and leverage standardized quick disconnects, making them attractive for enterprises performing gradual retrofits. Cold-plate loops also minimize fluid inventory, reducing environmental risk and meeting insurance-carrier guidelines with minimal paperwork. However, they still demand per-node plumbing labor and cannot fully exploit heat-re-use schemes because exhaust temperatures sit below 50 °C.
Rack-level immersion is forecast to expand at 28.10% per year. Submer, GRC, and LiquidStack tanks enable 200 kW racks within existing floor grids, shrink installation windows to a single afternoon, and simplify maintenance with live-service capabilities. The GPU liquid cooling market share for immersion rose sharply after ByteDance documented PUE 1.08 and 85% waste-heat recovery, influencing procurement strategies across mainland China. Financial models show that once electricity exceeds USD 0.10 per kilowatt-hour, immersion's operational savings eclipse its capital premium in under three years, tilting total-cost-of-ownership calculations decisively.
Complete Report Scope:
- By Cooling Type
- Single-Phase Liquid Cooling
- Two-Phase Liquid Cooling
- By Cooling Level
- Component-Level Cooling
- Server Rack-Level Cooling
- By Deployment
- Hyperscale Cloud
- Enterprise
- Government and Research HPC
- Edge AI
- By GPU Power Density
- Below 300 W
- 300 W - 700 W
- Above 700 W
- By Geography
- North America
- United States
- Canada
- Mexico
- Europe
- Germany
- United Kingdom
- France
- Italy
- Rest of Europe
- Asia-Pacific
- China
- Japan
- South Korea
- India
- Southeast Asia
- Rest of Asia-Pacific
- South America
- Brazil
- Rest of South America
- Middle East and Africa
- North America
Geography Analysis
Asia-Pacific accounted for 68% revenue in 2025 and is forecast to grow 29.10% annually through 2031. Sovereign AI programs in China inject billions of dollars into national GPU clusters, while Southeast Asia leverages tax incentives to localize production of CDUs and quick disconnects. ByteDance documented a PUE of 1.08 at its Tianjin campus and shared blueprints with domestic cloud peers, creating a demonstration effect that ripples through the region's colocation market. In parallel, Japan and South Korea channel state grants toward liquid-ready fabs, ensuring regional supply security against export-control uncertainty.
North America trails Asia-Pacific in volume but leads in technology adoption and regulatory impetus. California's Title 24 and the United States federal push for district-energy coupling obligate new builds to meet PUE below 1.18 within the decade. Hyperscale operators pre-empt compliance risk through aggressive two-phase pilots in Virginia and Arizona. Canada's colder climate further sweetens the server heat-export narrative, with Quebec utilities offering tariff rebates for waste-heat recovery connections, compressing payback to 24 months in some metro sites.
Europe presents a mosaic of drivers that Germany enforces statutory PUE caps, France ties grid fees to efficiency scores, and the Nordics monetize heat reuse within well-established district networks. Combined, these policies accelerate adoption schedules and generate attractive secondary revenue from heat sales. However, European operators must simultaneously pivot away from high-GWP coolants, compelling suppliers to certify hydrocarbon or ester formulations before facility-commissioning deadlines. This dual pressure fosters a vibrant vendor landscape comprising transformer oil specialists, chemical majors, and newly formed fluid recyclers.
- Vertiv Group Corporation
- Schneider Electric SE
- CoolIT Systems Inc.
- LiquidStack Holdings Inc.
- Submer Technologies SL
- Green Revolution Cooling Inc.
- Asetek AS
- Iceotope Technologies Ltd.
- Fujitsu Ltd.
- Dell Technologies Inc.
- Hewlett Packard Enterprise Company
- Lenovo Group Ltd.
- Super Micro Computer Inc.
- BOYD Corporation
- Delta Electronics Inc.
- Parker Hannifin Corporation
- CPC Colder Products Company
- Danfoss AS
- Staubli International AG
- Zutacore Ltd.
- LiquidCool Solutions Inc.
- Asperitas BV
Additional Benefits:
- The market estimate (ME) sheet in Excel format
- 3 months of analyst support
TABLE OF CONTENTS
1 INTRODUCTION
- 1.1 Study Assumptions and Market Definition
- 1.2 Scope of the Study
2 RESEARCH METHODOLOGY
3 EXECUTIVE SUMMARY
4 MARKET LANDSCAPE
- 4.1 Market Overview
- 4.2 Market Drivers
- 4.2.1 Hyperscale GPU Rack Densities Exceeding 120 kW Accelerate Liquid Cooling Adoption
- 4.2.2 OEM Launch of Liquid-Cooled GPU Platforms NVIDIA AMD Supermicro
- 4.2.3 Stricter Data-Centre PUE Mandates in North America and Europe
- 4.2.4 Heat Re-use Incentives in District Energy Networks
- 4.2.5 Next-Generation AI ASICs Above 1 kW TDP Require Two-Phase Solutions
- 4.2.6 Supply-Chain Localisation of CDUs and Quick Disconnects in Southeast Asia
- 4.3 Market Restraints
- 4.3.1 High CAPEX Premium for Immersion Systems
- 4.3.2 Fluorinated Coolant Environmental Regulations
- 4.3.3 Limited Field Expertise for Edge AI Retrofits
- 4.3.4 Long Qualification Cycles for Government HPC Facilities
- 4.4 Industry Value Chain Analysis
- 4.5 Regulatory Landscape
- 4.6 Technological Outlook
- 4.7 Impact of Macroeconomic Factors on the Market
- 4.8 Porter's Five Forces Analysis
- 4.8.1 Threat of New Entrants
- 4.8.2 Bargaining Power of Buyers
- 4.8.3 Bargaining Power of Suppliers
- 4.8.4 Threat of Substitutes
- 4.8.5 Competitive Rivalry
5 MARKET SIZE AND GROWTH FORECASTS (VALUE)
- 5.1 By Cooling Type
- 5.1.1 Single-Phase Liquid Cooling
- 5.1.2 Two-Phase Liquid Cooling
- 5.2 By Cooling Level
- 5.2.1 Component-Level Cooling
- 5.2.2 Server Rack-Level Cooling
- 5.3 By Deployment
- 5.3.1 Hyperscale Cloud
- 5.3.2 Enterprise
- 5.3.3 Government and Research HPC
- 5.3.4 Edge AI
- 5.4 By GPU Power Density
- 5.4.1 Below 300 W
- 5.4.2 300 W - 700 W
- 5.4.3 Above 700 W
- 5.5 By Geography
- 5.5.1 North America
- 5.5.1.1 United States
- 5.5.1.2 Canada
- 5.5.1.3 Mexico
- 5.5.2 Europe
- 5.5.2.1 Germany
- 5.5.2.2 United Kingdom
- 5.5.2.3 France
- 5.5.2.4 Italy
- 5.5.2.5 Rest of Europe
- 5.5.3 Asia-Pacific
- 5.5.3.1 China
- 5.5.3.2 Japan
- 5.5.3.3 South Korea
- 5.5.3.4 India
- 5.5.3.5 Southeast Asia
- 5.5.3.6 Rest of Asia-Pacific
- 5.5.4 South America
- 5.5.4.1 Brazil
- 5.5.4.2 Rest of South America
- 5.5.5 Middle East and Africa
- 5.5.1 North America
6 COMPETITIVE LANDSCAPE
- 6.1 Market Concentration
- 6.2 Strategic Moves
- 6.3 Market Share Analysis
- 6.4 Company Profiles
- 6.4.1 Vertiv Group Corporation
- 6.4.2 Schneider Electric SE
- 6.4.3 CoolIT Systems Inc.
- 6.4.4 LiquidStack Holdings Inc.
- 6.4.5 Submer Technologies SL
- 6.4.6 Green Revolution Cooling Inc.
- 6.4.7 Asetek AS
- 6.4.8 Iceotope Technologies Ltd.
- 6.4.9 Fujitsu Ltd.
- 6.4.10 Dell Technologies Inc.
- 6.4.11 Hewlett Packard Enterprise Company
- 6.4.12 Lenovo Group Ltd.
- 6.4.13 Super Micro Computer Inc.
- 6.4.14 BOYD Corporation
- 6.4.15 Delta Electronics Inc.
- 6.4.16 Parker Hannifin Corporation
- 6.4.17 CPC Colder Products Company
- 6.4.18 Danfoss AS
- 6.4.19 Staubli International AG
- 6.4.20 Zutacore Ltd.
- 6.4.21 LiquidCool Solutions Inc.
- 6.4.22 Asperitas BV
7 MARKET OPPORTUNITIES AND FUTURE OUTLOOK
- 7.1 White-Space and Unmet-Need Assessment

 資料中心晶片直接冷卻液:市場佔有率分析、行業趨勢和統計數據以及成長預測(2026-2031 年)
 2026年資料中心機架式CDU幫浦全球市場研究報告資料中心液冷:市場佔有率分析、產業趨勢與統計、成長預測(2026-2031)GPU散熱解決方案:市佔率分析、產業趨勢與統計、成長預測(2026-2031年)中國GPU散熱解決方案:市佔率分析、產業趨勢與統計及成長預測(2026-2031年)歐洲GPU液冷:市佔率分析、產業趨勢與統計及成長預測(2026-2031年)北美GPU液冷市場:市佔率分析、產業趨勢與統計及成長預測(2026-2031年)
 資料中心液冷市場:依冷卻技術、組件、液體類型、基礎架構層、資料中心類型、最終用戶產業及資料中心規模分類-2026-2032年全球市場預測
 全球資料中心液冷歧管市場:按歧管類型、冷卻類型、材料類型、設計類型、資料中心類型、安裝類型和地區分類-預測至2033年
 資料中心液冷市場:按組件、冷卻類型、資料中心類型、企業規模和最終用戶產業分類-市場規模、產業動態、機會分析和預測(2026-2035 年)