


 |
市場調查報告書
商品編碼
2121907
資料中心液冷:市場佔有率分析、產業趨勢與統計、成長預測(2026-2031)Data Center Liquid Cooling - Market Share Analysis, Industry Trends & Statistics, Growth Forecasts (2026 - 2031) |
||||||

※ 本網頁內容可能與最新版本有所差異。詳細情況請與我們聯繫。
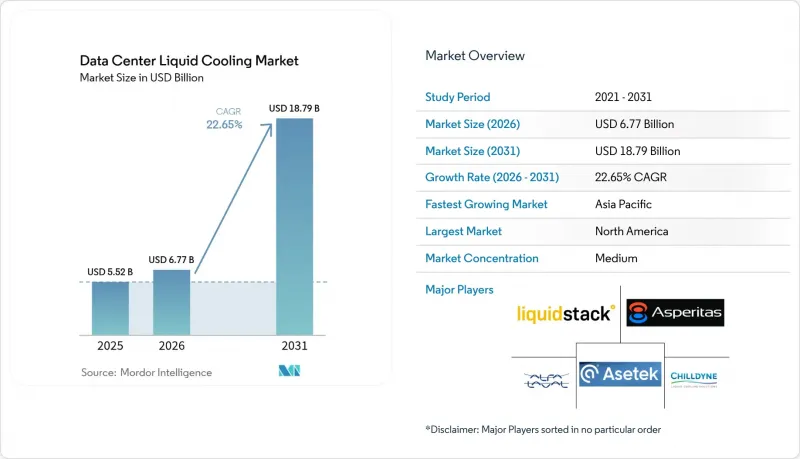
據 Mordor Intelligence 稱,2025 年資料中心液冷市場價值為 55.2 億美元,預計到 2031 年將達到 187.9 億美元,而 2026 年為 67.7 億美元,預測期(2026-2031 年)的複合年成長率為 22.65%。
本報告按冷卻技術(浸沒式冷卻、晶片直接液冷等)、冷卻液類型(單相碳氫化合物流體、兩相氟化碳氫化合物流體等)、資料中心類型(超大規模、託管、企業級等)、應用領域(高效能運算、人工智慧/機器學習等)和地區進行細分。市場預測以美元計價。
全球資料中心液冷市場趨勢與洞察
機架密度的激增增加了對液冷的需求。
部署 NVIDIA H200 GPU 的資料中心營運商面臨著每台 GPU 700 W 的熱負荷,而風冷根本無法經濟高效地散熱。雖然處理器效能比上一代提升了 1.9 倍,營運商可以減少伺服器數量,但仍需要散發集中的熱量。因此,液冷正從單純的效率提升選項轉變為必不可少的基礎設施,它能夠在不超出機房電源使用效率 (PUE)閾值下實現高密度部署。資料中心液冷市場正從中直接受益,因為每機架超過 20 kW 的熱負荷,每增加 1 kW,營運商就必須轉向液冷解決方案。
超大規模企業的淨零排放承諾正在加速這一趨勢的實現。
主流雲端服務供應商已承諾在其整個基礎設施中實現淨零排放,並將液冷視為一種能夠比傳統風冷系統降低20%能耗的有效手段。此外,歐洲法規強制要求超過1兆瓦的資料中心進行熱回收,加速了簡化熱回收的液冷架構的普及。自願努力與監管壓力相結合,意味著液冷不僅是合規的基礎設施,也是提高營運效率的策略,而資料中心液冷市場正從早期採用者擴展到更廣泛的用戶群。
缺乏現場專業知識限制了實施速度。
液冷系統需要管道安裝、洩漏檢測和水泵選型等方面的技能,但許多現有資料中心員工缺乏這些技能。雖然培訓計畫正在不斷擴展,但在人才儲備充足之前,液冷系統的實施週期預計會比風冷計畫更長。
細分市場分析
到2025年,晶片級直接冷卻(DMC)將佔據資料中心液冷市場42.85%的佔有率,預計未來仍將是短期成長的主要動力。營運商青睞其便利性,因為它可以直接應用於CPU和GPU,且功耗適中。在資料中心液冷市場中,浸沒式解決方案預計將以26.62%的複合年成長率快速成長,這主要得益於人工智慧訓練叢集對極高熱通量的需求。資料中心設施正日益趨向混合化,中型機架採用後門式熱交換器,而GPU島則採用浸沒式冷卻槽。 Invented和其他台灣公司提交的專利申請也印證了該工程領域持續強勁的發展勢頭。
由此產生的連鎖反應是,零件供應商正在重新設計泵浦、閥門和快速接頭,以適應更高的流量和非導電電流體。隨著產品標準化的推進,採購週期預計將縮短,整體實施成本將降低,技術轉型也將進一步加速。
在2025年的資料中心液冷市場中,由於供應鏈成熟,單相碳氫化合物佔據最大佔有率。然而,雙相氟化碳氫化合物具有更高的傳熱係數,預計將達到25.64%的複合年成長率。 3M公司正在透過重組採購流程來逐步淘汰含PFAS的冷卻液,而中國特種化學品製造商也正在進入市場,以滿足半導體和伺服器冷卻液的需求。英國等政府正在資助研發全球暖化潛勢(GWP)更低的下一代冷卻液,加速環保化學品的廣泛轉型。營運商也在考慮在節水至關重要的設施中引入乙二醇混合物。含有金屬氧化物和奈米碳管的奈米流體仍處於概念驗證階段,但測試結果顯示其導熱係數提高了10-15%,預計在未來十年內將實現更薄的冷板。
區域分析
北美憑藉超大規模資本投資和投資激勵稅收政策,仍維持主導。堪薩斯州對超過2.5億美元的資料中心支出提供20年的銷售稅豁免,麻州也為超過5,000萬美元的項目提供類似的稅收優惠。 《通膨控制法案》透過清潔能源補貼進一步提升了盈利,促使許多新建設項目採用液冷設計。
歐洲是第二大成長引擎。能源效率指令規定,超過1兆瓦的資料中心必須進行熱回收評估,而斯堪的斯堪地那維亞的區域供熱網路則為經濟有效地利用回收的熱能提供了途徑。在法國,能源稅減免政策適用於那些展現卓越電力使用效率(PUE)的設施。這些法規共同作用,使得液冷系統不再只是提高效率的選項,而是成為一項合規要求,尤其是在已經安裝了水側節熱器的情況下。
亞太地區是資料中心液冷市場成長最快的地區。中國正在填補3M公司退出PFAS(全氟烷基和多氟烷基物質)市場後留下的冷卻液供應缺口,而日本電力公司則在鼓勵節能計算節點採用液冷技術。在印度,特倫甘納邦和北方邦的專項資料中心政策支持下的快速數位化進程,為直接過渡到液冷架構創造了待開發區機會。以英業達為首的台灣製造商在專利申請方面處於世界領先地位,並向全球出口整合式冷板組件。
非洲、拉丁美洲和中東地區雖然規模較小,但仍是具有重要戰略意義的地區。在這些地區,高溫和高昂的電力成本降低了風冷系統的吸引力,從而為能夠以最少的機械設備處理通訊和金融科技工作負載的緊湊型浸沒式冷卻器開闢了新的市場。
其他好處:
- Excel格式的市場預測(ME)表
- 3個月的分析師支持
目錄
第1章:引言
- 研究假設和市場定義
- 調查範圍
第2章:調查方法
第3章執行摘要
第4章 市場狀況
- 市場概覽
- 市場促進因素
- 人工智慧和高效能運算設施中機架密度(超過 30 kW)的快速成長
- 超大規模業者的淨零排放藍圖正在加速液態能源的採用。
- 直接連接到吸嘴的線圈現在包含在原廠保固範圍內。
- Nvidia 和 AMD 的「Liquid-Ready」參考設計正在推動生態系統向前發展。
- 政府對綠色資料中心的獎勵(例如歐盟分類法)正在促進資本支出(CAPEX)。
- 透過將廢熱再利用於區域供熱,降低營運成本(OPEX)就能帶來獲利。
- 市場限制因素
- 設施工程師對現場情況的專業知識有限。
- 維修現有設施的初期成本很高。
- 對材料與流體相容性的擔憂(長期密封件、PCB)
- 特殊介電液體的供應風險
- 產業價值鏈分析
- 監理情勢
- 技術展望
- 波特五力分析
第5章 市場規模與成長預測
- 依冷卻技術進行分段
- 浸沒式冷卻
- 直接滴液冷卻
- 後門熱交換器(RDHx)
- 冷板/插管式液體冷卻系統
- 按冷卻劑類型進行細分
- 單相烴類冷媒
- 雙相含氟流體
- 水/乙二醇溶液
- 奈米流體和其他特殊液體
- 按類型分類的資料中心
- 超大規模
- 搭配
- 企業/本地部署
- 邊緣資料中心和微型資料中心
- 按應用程式/工作負載進行細分
- 高效能運算(HPC)
- 人工智慧/機器學習
- 加密貨幣挖礦
- 雲端運算和虛擬化
- 區域細分
- 北美洲
- 美國
- 加拿大
- 南美洲
- 巴西
- 其他南美國家
- 歐洲
- 德國
- 英國
- 法國
- 荷蘭
- 俄羅斯
- 其他歐洲國家
- 亞太地區
- 中國
- 日本
- 印度
- 澳洲
- 其他亞太國家
- 中東和非洲
- 中東
- 沙烏地阿拉伯
- 阿拉伯聯合大公國
- 非洲
- 南非
- 其他中東和非洲國家
- 中東
- 北美洲
第6章 競爭情勢
- 市場集中度
- 策略趨勢
- 市佔率分析
- 公司簡介
- Alfa Laval Corporate AB
- Asetek A/S
- Asperitas BV
- Chilldyne Inc.
- CoolIT Systems Inc.
- Fujitsu Ltd.
- Kaori Heat Treatment Co., Ltd.
- Lenovo Group Ltd.
- LiquidStack Inc.
- LiquidCool Solutions Inc.
- Iceotope Technologies Ltd.
- Rittal GmbH and Co. KG
- Schneider Electric SE
- Submer Technologies SL and Submer Inc.
- Vertiv Group Corp.
- Wiwynn Corporation
- 3M Company
- Engineered Fluids Inc.
- Green Revolution Cooling Inc.
- Solvay SA
- Mikros Technologies
- Midas Green Technologies LLC
- USystems Ltd.(Legrand Group)
第7章 市場機會與未來展望
According to Mordor Intelligence, the data center liquid cooling market size was valued at USD 5.52 billion in 2025 and estimated to grow from USD 6.77 billion in 2026 to reach USD 18.79 billion by 2031, at a CAGR of 22.65% during the forecast period (2026-2031).
This report is Segmented by Cooling Technology (Immersion Cooling, Direct-To-Chip Liquid Cooling, and More), Coolant Type (Single-Phase Hydrocarbon Fluids, Two-Phase Fluorocarbon Fluids, and More), Data Center Type (Hyperscale, Colocation, Enterprise, and More), Application (HPC, AI/ML, and More), and Geography. The Market Forecasts are Provided in Terms of Value (USD).
Global Data Center Liquid Cooling Market Trends and Insights
Surging rack densities drive liquid cooling necessity
Data center operators deploying NVIDIA H200 GPUs face 700 W thermal loads per device, and air cooling cannot cost-effectively remove that heat at volume. With processors delivering up to 1.9 times prior-generation performance, operators can shrink server counts but must dissipate concentrated heat. Liquid cooling, therefore, shifts from an optional efficiency measure to indispensable infrastructure, enabling higher density without blowing past facility power-usage-effectiveness thresholds. The data center liquid cooling market benefits directly because every incremental kilowatt above 20 kW per rack pushes operators toward liquid solutions.
Hyperscale net-zero commitments accelerate adoption
Cloud giants have pledged fleet-wide net-zero emissions and see liquid cooling as a 20% energy-reduction lever compared with legacy air systems. European regulations further require heat recovery from data centers above 1 MW, intensifying uptake of liquid architectures that simplify thermal capture. These combined voluntary and regulatory forces turn liquid cooling into a compliance infrastructure as well as an operational efficiency strategy, expanding the data center liquid cooling market beyond early adopters.
Limited field expertise constrains deployment velocity
Liquid systems demand skills in pipe fitting, leak detection, and pump sizing that many legacy data center staff lack. Training programs are expanding, but until the talent pool deepens, roll-out schedules will remain lengthier than air-based projects.
Other drivers and restraints analyzed in the detailed report include:
- OEM warranty coverage reduces deployment risk
- Semiconductor reference designs standardize implementation
- Retrofit costs challenge brown-field adoption
For complete list of drivers and restraints, kindly check the Table Of Contents.
Segment Analysis
Direct-to-chip captured 42.85% of the 2025 data center liquid cooling market share and will continue to anchor short-term growth. Operators favour its drop-in nature for CPUs and moderate-power GPUs. The data center liquid cooling market size for immersion solutions will climb fastest at a 26.62% CAGR, helped by AI training clusters that need extreme heat flux removal. Facilities are increasingly hybrid, using rear-door heat exchangers for moderate racks and immersion baths for GPU islands. Patent filings by Invented and other Taiwanese firms underscore sustained engineering momentum.
A second-order effect is that component suppliers are redesigning pumps, valves, and quick-disconnects to tolerate higher flow rates and non-conductive fluids. As products standardize, procurement cycles shorten and total installed cost falls, reinforcing the technology shift.
Single-phase hydrocarbons accounted for the largest slice of the data center liquid cooling market size in 2025 due to mature supply chains. However, two-phase fluorocarbons deliver stronger heat-transfer coefficients and will post a 25.64% CAGR. 3M's scheduled phase-out of PFAS fluids is reshaping sourcing; Chinese specialty chemical makers are stepping in to backfill demand for semiconductor and server coolant buyers. Governments such as the United Kingdom are funding research into next-generation, low-global-warming-potential fluids, accelerating a broader shift to environmentally aligned chemistries. Operators are also exploring glycol mixes for facilities where water conservation is paramount. Nanofluids, infused with metal oxides or carbon nanotubes, remain at pilot stage, but test results suggest 10-15% conductivity gains that could unlock thinner cold plates in the coming decade.
Complete Report Scope:
- Segmentation by Cooling Technology
- Immersion Cooling
- Direct-to-Chip Liquid Cooling
- Rear-Door Heat Exchangers (RDHx)
- Cold-Plate / In-row Liquid Systems
- Segmentation by Coolant Type
- Single-Phase Hydrocarbon Fluids
- Two-Phase Fluorocarbon Fluids
- Water / Glycol Solutions
- Nanofluids and Other Specialty Liquids
- Segmentation by Data Center Type
- Hyperscale
- Colocation
- Enterprise / On-Premise
- Edge and Micro DCs
- Segmentation by Application / Workload
- High-Performance Computing (HPC)
- Artificial Intelligence / Machine Learning
- Cryptocurrency Mining
- Cloud and Virtualisation
- Segmentation by Geography
- North America
- United States
- Canada
- South America
- Brazil
- Rest of South America
- Europe
- Germany
- United Kingdom
- France
- Netherlands
- Russia
- Rest of Europe
- APAC
- China
- Japan
- India
- Australia
- Rest of APAC
- Middle East and Africa
- Middle East
- Saudi Arabia
- United Arab Emirates
- Africa
- South Africa
- Rest of MEA
- Middle East
- North America
Geography Analysis
North America preserves its lead position thanks to hyperscale capex and pro-investment tax regimes. Kansas grants 20-year sales-tax holidays on data center spending above USD 250 million, and Massachusetts offers similar exemptions for projects over USD 50 million. The Inflation Reduction Act further augments returns with clean-energy credits, tipping many new builds toward liquid-ready designs.
Europe is the second growth engine. The Energy Efficiency Directive obliges data centers above 1 MW to evaluate heat recovery, and Scandinavian district-heating grids provide an economic off-take route for captured thermal energy. France rewards facilities that prove superior power-usage effectiveness with reduced energy taxes. Collectively, these rules elevate liquid systems from an efficiency choice to a compliance requirement, especially where water-side economizers already exist.
APAC represents the fastest-growing regional slice of the data center liquid cooling market. China is bridging the coolant gap created by 3M's PFAS exit, while Japan's utilities incentivize energy-efficient compute nodes. India's rapid digitalization, supported by dedicated data-center-friendly policies in Telangana and Uttar Pradesh, provides greenfield opportunities to leapfrog directly into liquid architectures. Taiwanese manufacturers, headlined by Inventec, dominate global patent filings and are exporting integrated cold-plate assemblies worldwide.
Africa, Latin America, and the Middle East remain smaller but strategic. Their hot climates and costly power make air systems less attractive, opening niches where compact immersion baths can serve telecom and fintech workloads with minimal mechanical plant.
- Alfa Laval Corporate AB
- Asetek A/S
- Asperitas BV
- Chilldyne Inc.
- CoolIT Systems Inc.
- Fujitsu Ltd.
- Kaori Heat Treatment Co., Ltd.
- Lenovo Group Ltd.
- LiquidStack Inc.
- LiquidCool Solutions Inc.
- Iceotope Technologies Ltd.
- Rittal GmbH and Co. KG
- Schneider Electric SE
- Submer Technologies SL and Submer Inc.
- Vertiv Group Corp.
- Wiwynn Corporation
- 3M Company
- Engineered Fluids Inc.
- Green Revolution Cooling Inc.
- Solvay SA
- Mikros Technologies
- Midas Green Technologies LLC
- USystems Ltd. (Legrand Group)
Additional Benefits:
- The market estimate (ME) sheet in Excel format
- 3 months of analyst support
TABLE OF CONTENTS
1 INTRODUCTION
- 1.1 Study Assumptions and Market Definition
- 1.2 Scope of the Study
2 RESEARCH METHODOLOGY
3 EXECUTIVE SUMMARY
4 MARKET LANDSCAPE
- 4.1 Market Overview
- 4.2 Market Drivers
- 4.2.1 Surging rack densities (>30 kW) in AI and HPC facilities
- 4.2.2 Hyperscale operators' net-zero roadmaps accelerating liquid adoption
- 4.2.3 OEM warranties now covering direct-to-chip loops
- 4.2.4 Nvidia and AMD liquid-ready reference designs driving ecosystem
- 4.2.5 Government incentives for green DCs (e.g., EU Taxonomy) underwrite CAPEX
- 4.2.6 Re-use of waste-heat for district heating monetises OPEX savings
- 4.3 Market Restraints
- 4.3.1 Limited field expertise among facility engineers
- 4.3.2 High upfront retrofit costs for brown-field sites
- 4.3.3 Fluid material-compatibility concerns (long-term seals, PCB)
- 4.3.4 Supply risk of specialty dielectric fluids
- 4.4 Industry Value-Chain Analysis
- 4.5 Regulatory Landscape
- 4.6 Technological Outlook
- 4.7 Porter's Five Forces Analysis
- 4.7.1 Threat of New Entrants
- 4.7.2 Bargaining Power of Suppliers
- 4.7.3 Bargaining Power of Buyers
- 4.7.4 Threat of Substitutes (advanced air, two-phase CO?)
- 4.7.5 Degree of Competition
5 MARKET SIZE AND GROWTH FORECASTS
- 5.1 Segmentation by Cooling Technology
- 5.1.1 Immersion Cooling
- 5.1.2 Direct-to-Chip Liquid Cooling
- 5.1.3 Rear-Door Heat Exchangers (RDHx)
- 5.1.4 Cold-Plate / In-row Liquid Systems
- 5.2 Segmentation by Coolant Type
- 5.2.1 Single-Phase Hydrocarbon Fluids
- 5.2.2 Two-Phase Fluorocarbon Fluids
- 5.2.3 Water / Glycol Solutions
- 5.2.4 Nanofluids and Other Specialty Liquids
- 5.3 Segmentation by Data Center Type
- 5.3.1 Hyperscale
- 5.3.2 Colocation
- 5.3.3 Enterprise / On-Premise
- 5.3.4 Edge and Micro DCs
- 5.4 Segmentation by Application / Workload
- 5.4.1 High-Performance Computing (HPC)
- 5.4.2 Artificial Intelligence / Machine Learning
- 5.4.3 Cryptocurrency Mining
- 5.4.4 Cloud and Virtualisation
- 5.5 Segmentation by Geography
- 5.5.1 North America
- 5.5.1.1 United States
- 5.5.1.2 Canada
- 5.5.2 South America
- 5.5.2.1 Brazil
- 5.5.2.2 Rest of South America
- 5.5.3 Europe
- 5.5.3.1 Germany
- 5.5.3.2 United Kingdom
- 5.5.3.3 France
- 5.5.3.4 Netherlands
- 5.5.3.5 Russia
- 5.5.3.6 Rest of Europe
- 5.5.4 APAC
- 5.5.4.1 China
- 5.5.4.2 Japan
- 5.5.4.3 India
- 5.5.4.4 Australia
- 5.5.4.5 Rest of APAC
- 5.5.5 Middle East and Africa
- 5.5.5.1 Middle East
- 5.5.5.1.1 Saudi Arabia
- 5.5.5.1.2 United Arab Emirates
- 5.5.5.2 Africa
- 5.5.5.2.1 South Africa
- 5.5.5.2.2 Rest of MEA
- 5.5.5.1 Middle East
- 5.5.1 North America
6 COMPETITIVE LANDSCAPE
- 6.1 Market Concentration
- 6.2 Strategic Moves
- 6.3 Market Share Analysis
- 6.4 Company Profiles (includes Global level Overview, Market level overview, Core Segments, Financials as available, Strategic Information, Market Rank/Share for key companies, Products and Services, Recent Developments)
- 6.4.1 Alfa Laval Corporate AB
- 6.4.2 Asetek A/S
- 6.4.3 Asperitas BV
- 6.4.4 Chilldyne Inc.
- 6.4.5 CoolIT Systems Inc.
- 6.4.6 Fujitsu Ltd.
- 6.4.7 Kaori Heat Treatment Co., Ltd.
- 6.4.8 Lenovo Group Ltd.
- 6.4.9 LiquidStack Inc.
- 6.4.10 LiquidCool Solutions Inc.
- 6.4.11 Iceotope Technologies Ltd.
- 6.4.12 Rittal GmbH and Co. KG
- 6.4.13 Schneider Electric SE
- 6.4.14 Submer Technologies SL and Submer Inc.
- 6.4.15 Vertiv Group Corp.
- 6.4.16 Wiwynn Corporation
- 6.4.17 3M Company
- 6.4.18 Engineered Fluids Inc.
- 6.4.19 Green Revolution Cooling Inc.
- 6.4.20 Solvay SA
- 6.4.21 Mikros Technologies
- 6.4.22 Midas Green Technologies LLC
- 6.4.23 USystems Ltd. (Legrand Group)
7 MARKET OPPORTUNITIES AND FUTURE OUTLOOK
- 7.1 White-Space and Unmet-Need Assessment

 資料中心晶片直接冷卻液:市場佔有率分析、行業趨勢和統計數據以及成長預測(2026-2031 年)
 2026年資料中心機架式CDU幫浦全球市場研究報告GPU散熱解決方案:市佔率分析、產業趨勢與統計、成長預測(2026-2031年)中國GPU散熱解決方案:市佔率分析、產業趨勢與統計及成長預測(2026-2031年)GPU液冷:市佔率分析、產業趨勢與統計、成長預測(2026-2031)歐洲GPU液冷:市佔率分析、產業趨勢與統計及成長預測(2026-2031年)北美GPU液冷市場:市佔率分析、產業趨勢與統計及成長預測(2026-2031年)
 資料中心液冷市場:依冷卻技術、組件、液體類型、基礎架構層、資料中心類型、最終用戶產業及資料中心規模分類-2026-2032年全球市場預測
 全球資料中心液冷歧管市場:按歧管類型、冷卻類型、材料類型、設計類型、資料中心類型、安裝類型和地區分類-預測至2033年
 資料中心液冷市場:按組件、冷卻類型、資料中心類型、企業規模和最終用戶產業分類-市場規模、產業動態、機會分析和預測(2026-2035 年)