


 |
市場調查報告書
商品編碼
2099815
美國固定無線接取:市場佔有率分析、產業趨勢與統計、成長預測(2026-2031 年)United States Fixed Wireless Access - Market Share Analysis, Industry Trends & Statistics, Growth Forecasts (2026 - 2031) |
||||||

※ 本網頁內容可能與最新版本有所差異。詳細情況請與我們聯繫。
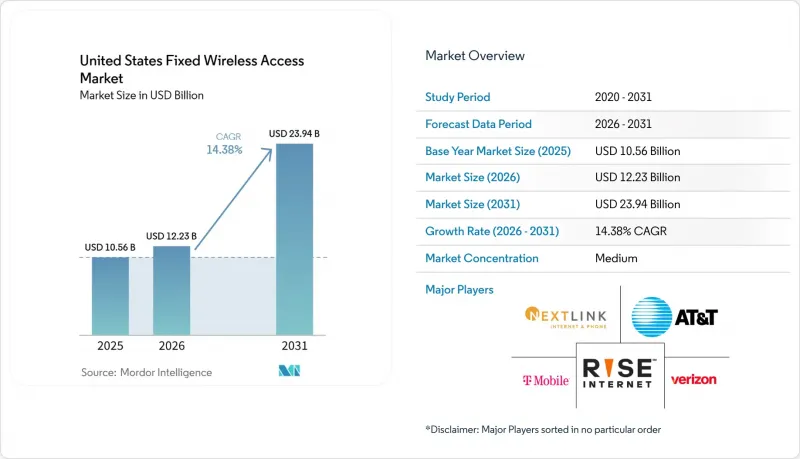
根據 Mordor Intelligence 預測,美國固定無線接取市場規模將從 2025 年的 105.6 億美元和 2026 年的 122.3 億美元成長到 2031 年的 239.4 億美元,2026 年至 2031 年的複合年成長率為 14.38%。
本報告按類型(硬體和服務)、應用(住宅、商業、工業、政府和公共安全)、頻段(6 GHz 以下、毫米波(24 GHz 及以上)和免許可/共用CBRS)以及部署類型(室內 CPE、室外 CPE 和自行安裝的窗式 CPE)進行細分。市場預測以美元 (USD) 為單位。
美國固定無線接入市場趨勢與洞察
5G的部署正在擴展Gigabit級固定無線存取。
美國固定無線接取市場正受惠於更強大的5G效能基礎,這是以往基於LTE的服務所無法實現的。 C頻段(3.45 GHz)和CBRS中波頻段正在擴大家庭寬頻服務的覆蓋範圍,並為典型的寬頻使用提供足夠的速度。三大通訊業者在2026年第一季新增了近100萬個固定無線接入(FWA)網路連接,延續了季度成長趨勢,該類別在美國寬頻成長中佔據了相當大的佔有率。這一成長速度意義重大,因為它表明,擴大5G覆蓋範圍不再只是一個技術性的網路里程碑,而是正在帶來用戶大規模成長。此外,由於基於5G的服務層級能夠處理比傳統FWA服務更嚴苛的流量需求,美國固定無線接取市場正朝向更高價值的商業應用場景轉型。這將使網路部署、頻段復用和服務差異化在整個預測期內保持緊密聯繫。
地方寬頻資金正在加強快速部署的基礎。
美國固定無線接取市場正受惠於農村地區的寬頻資金支持。這是因為無線網路的部署速度遠快於嚴重依賴鑽井的有線專案。這種速度在人口稀少、服務差距依然顯著且居民無法承受漫長建設週期的地區至關重要。其優勢在中西部、南部和山地西部地區尤為明顯,這些地區的區域條件和低人口密度往往阻礙了有線網路的擴張。這筆資金支持了那些已經進入許可權通訊塔和本地覆蓋範圍資訊的本地營運商,使他們能夠比建造大規模有線電視網路更快地推出服務。隨著這些營運商將已獲批准的項目轉化為實際服務交付,預計美國固定無線存取市場將持續活性化農村地區的營運商加入。因此,這筆資金既能獎勵策略短期需求,也能為新業者提供進入市場的途徑。
中波頻寬的限制制約了常用走廊的使用。
由於固定無線存取(FWA)的流量負載遠高於一般智慧型手機流量,美國高密度走廊地區的固定無線接取市場實際上已達到成長上限。隨著越來越多的家庭寬頻用戶接入共用的蜂窩網路基礎設施,與僅依賴行動網路成長的情況相比,網路擁塞的風險將迅速增加。因此,在一些郊區和部分都市區,基於地址的接入合格正逐漸成為網路管理的挑戰,而不僅僅是覆蓋範圍問題。這項限制尤其重要,因為它甚至可能在5G覆蓋已覆蓋的地區減緩用戶成長。在分配更多頻段並全面部署到營運網路之前,美國固定無線接取市場將持續面臨此問題。因此,容量規劃是可能抑制強勁需求的最明顯的短期限制因素之一。
細分市場分析
2025年,硬體設備在美國固定無線接取市場中佔62.12%的佔有率。這主要得益於5G CPE的廣泛部署,通訊業者紛紛升級了客戶閘道器和存取單元。此細分市場仍受到住宅市場擴張的影響,因為新增用戶需要終端設備,通常也需要相關的存取基礎設施。隨著廠商不斷改善室內接收、窗邊安裝和上行鏈路性能,設備設計也持續提升。 2026年3月,Vantiva發布了Hawk 5G FWA家庭閘道器,該產品支援功率等級1.0,採用窗邊安裝外形規格,並整合了第三代室內天線系統,旨在提高中頻寬效率並擴大基地台覆蓋範圍。
美國固定無線存取 (FWA) 服務市場預計將在 2026 年至 2031 年間以 15.55% 的複合年成長率 (CAGR) 成長,超過硬體市場成長速度,這主要得益於通訊業者向託管連接和企業級套餐的轉型。這一趨勢意義重大,因為部署規模已大幅成長,而支援、編配和基於合約的服務層如今在價值池中所佔比例越來越大。這一趨勢與通訊業的大趨勢相符,即設備經濟效益日趨成熟,而軟體、生命週期支援和效能保障的重要性日益凸顯。 2026 年,T-Mobile US 透過提供整合 5G 和衛星連接的託管業務解決方案,進一步強化了這一發展方向,不再僅限於接入硬體的競爭。在美國固定無線接入行業,這種轉變表明,長期盈利將不再主要取決於單一設備的出貨量,而是更多地取決於營運商如何有效地整合服務品質、編配和容錯能力。
2025年,住宅用戶將占美國固定無線接取市場65.33%的佔有率,成為當前收入的主要驅動力。這一細分市場的成長主要得益於郊區和半鄉村家庭尋求更快的服務部署速度和更低的月費,將其作為有線電視和DSL的實用替代方案。這項基礎使得通訊業者無需等待最後一公里基礎設施建設即可拓展用戶,從而推動了美國固定無線接入市場的快速擴張。這也為廣泛的部署奠定了基礎,進而支援了高效能終端、增強的室內覆蓋範圍以及向更高價值套餐的提升銷售。
預計到2031年,政府和公共安全領域將以14.88%的複合年成長率成長,成為美國固定無線接取市場各應用領域中成長最快的領域。此細分市場的成長動力主要來自緊急應變人員的通訊需求、設施連接需求以及公共網路的容錯要求,在這些領域,快速部署和服務連續性至關重要。工業應用也在不斷擴展,因為現場營運商正在物流、公共產業和營運環境中利用無線連接,這些環境對快速覆蓋和可控部署的需求尤其重要。商業需求依然強勁,中小企業和多站點用戶優先考慮的是安裝時間短,以及無需耗時漫長的建設項目即可運作服務。美國固定無線接入行業結構的這些變化表明,到預測期結束時,該市場將不再僅依賴住宅需求。
其他好處:
- Excel格式的市場預測(ME)表
- 3個月的分析師支持
目錄
第1章:引言
- 研究假設和市場定義
- 調查範圍
第2章:調查方法
第3章執行摘要
第4章 市場狀況
- 市場概覽
- 市場促進因素
- 5G 的部署正在加速Gigabit級固定無線存取的普及。
- 為農村地區寬頻建設提供資金,正在促進可快速部署的通訊基礎設施的發展。
- 在成本受限的網路建置中,固定無線存取可作為光纖部署的替代策略。
- 企業網路容錯能力:對主備寬頻的需求
- AI最佳化的CPE和自助安裝功能降低了部署和支援成本。
- 私有頻譜和中波容量再利用正在改善人口密集子市場的經濟狀況。
- 市場限制因素
- 高利用率市場中頻寬頻譜容量的局限性
- 光纖和有線電視之間的競爭給固定無線存取的獲利能力帶來了壓力。
- 毫米波在高密度區域的覆蓋範圍和對視距的敏感性
- 各地經濟狀況不盡相同,在一些郊區,光纖投資的回報正在加速成長。
- 產業價值鏈分析
- 監理情勢
- 技術展望
- FWA實施的關鍵要素
- 供應商計劃和合作關係
- 商業考量和前提條件
- FWA 與 FTTH/FTTdp 的比較
- 農村、郊區和都市區的用例模型
- 宏觀經濟因素對市場的影響
- 波特五力分析
第5章 市場規模與成長預測
- 按類型
- 硬體
- 消費性設備(CPE)
- 接入單元(毫微微基地台和微微型基地台)
- 服務
- 硬體
- 透過使用
- 住宅
- 商業
- 產業
- 政府/公共安全
- 按頻段
- 低於 6 GHz
- 毫米波(24 GHz 以上)
- 無需許可證/共用CBRS
- 部署模式
- 室內CPE
- 戶外CPE
- 自行安裝的窗型CPE
第6章 競爭情勢
- 市場集中度
- 策略趨勢
- 市佔率分析
- 公司簡介
- Verizon Communications Inc.
- T-Mobile US, Inc.
- AT&T Inc.
- LTD Broadband
- Rise Broadband, Inc.(Rise Internet)
- Nextlink Internet
- Ericsson AB
- Nokia Corporation
- Samsung Electronics Co., Ltd.
- Qualcomm Technologies, Inc.
- Inseego Corp.
- Airspan Networks Holdings LLC
- Tarana Wireless, Inc.
- Cambium Networks Corporation
- DZS Inc.
- Arcadyan Technology Corporation
- Sercomm Corporation
- Zyxel Communications Corp.
- Adtran Holdings, Inc.
- Mavenir Systems, Inc.
第7章 市場機會與未來展望
According to Mordor Intelligence, the United States fixed wireless access market size is projected to expand from USD 10.56 billion in 2025 and USD 12.23 billion in 2026 to USD 23.94 billion by 2031, registering a CAGR of 14.38% from 2026 to 2031.
This report is Segmented by Type (Hardware and Services), Application (Residential, Commercial, Industrial, and Government and Public Safety), Frequency Band (Sub-6 GHz, Mmwave (Above 24 GHz), and Unlicensed/Shared CBRS), and Deployment Mode (Indoor CPE, Outdoor CPE, and Self-Install Window-Mount CPE). The Market Forecasts are Provided in Value (USD).
United States Fixed Wireless Access Market Trends and Insights
5G Rollout is Expanding Gigabit-Class Fixed Wireless Access
The United States fixed wireless access market is benefiting from a stronger 5G performance base than earlier LTE-based offerings could deliver. Mid-band spectrum in C-band (3.45 GHz) and CBRS has widened the serviceable footprint for home broadband and supported speeds that meet mainstream broadband use. The three largest carriers added nearly 1 million FWA net connections in the first quarter of 2026, extending a multi-quarter pattern in which this category has captured most U.S. broadband growth. That pace matters because it shows that 5G coverage expansion is now translating into subscriber additions at scale rather than staying as a technical network milestone. The United States fixed wireless access market is also moving into higher-value business use cases, as 5G-based service tiers can support more demanding traffic profiles than earlier FWA offerings. This keeps network rollout, spectrum reuse, and service differentiation tightly linked over the forecast period.
Rural Broadband Funding is Improving the Case for Rapid Deployment
The United States fixed wireless access market has benefited from rural broadband funding because wireless networks can be deployed faster than trench-heavy wired projects. That timing matters in low-density areas where service gaps remain large, and households cannot wait through long construction cycles. The appeal is strongest in the Midwest, the South, and the Mountain West, where geography and lower population density can slow wireline expansion. This funding backdrop also supports regional providers that already have tower access, local coverage knowledge, and lower time-to-service than large-scale wired builds. The United States fixed wireless access market should continue to see stronger rural participation as these operators convert approved projects into live coverage. That makes funding a market access lever as much as a short-term demand stimulus.
Mid-Band Spectrum Limits are Constraining High-Usage Corridors
The United States fixed wireless access market faces a real ceiling in dense usage corridors because FWA traffic loads are far heavier than those of ordinary smartphone traffic. When many home broadband users are added to shared cellular infrastructure, congestion risk rises faster than in mobile-only growth scenarios. This makes address-level eligibility a network management issue rather than a simple coverage issue in some suburban and urban pockets. The constraint is especially important because subscriber growth can slow even in areas where 5G coverage is already available. The United States fixed wireless access market will remain exposed to this issue until additional spectrum is not only assigned but fully deployed in operating networks. That leaves capacity planning as one of the clearest near-term limits on otherwise strong demand.
Other drivers and restraints analyzed in the detailed report include:
- Fixed Wireless Access is Serving as a Fiber Deferral Tool for Cost-Constrained ISPs
- Enterprise Demand for Resilience is Broadening the Revenue Base
- Fiber and Cable Pricing Pressure is Tightening Margins
For complete list of drivers and restraints, kindly check the Table Of Contents.
Segment Analysis
Hardware captured 62.12% of the United States fixed wireless access market share in 2025, supported by widespread 5G CPE deployment as operators upgraded customer gateways and access units. The segment still reflects the volume effect of residential expansion because every new subscriber connection needs a device and, in many cases, related access infrastructure. Equipment design continues to improve as vendors push better indoor reception, near-window placement, and stronger uplink performance. Vantiva introduced its Hawk 5G FWA home gateway in March 2026 with Power Class 1.0 support, a near-window form factor, and a third-generation indoor antenna system aimed at improving mid-band efficiency and extending usable cell reach.
The United States fixed wireless access market size for services is projected to expand at 15.55% CAGR over 2026-2031, ahead of hardware, as carriers shift toward managed connectivity and enterprise-grade packages. This pattern matters because the installed base is now large enough for support, orchestration, and contract-backed service layers to carry a larger share of the value pool. The move also fits a broader telecom pattern in which device economics mature while software, lifecycle support, and performance assurance become more important. T-Mobile US reinforced that direction in 2026 by combining 5G and satellite connectivity into a managed business offer rather than competing only on access hardware. Within the United States fixed wireless access industry, this shift suggests that long-term profitability will depend less on unit shipments alone and more on how effectively providers bundle service quality, orchestration, and resilience.
Residential accounted for 65.33% of the United States fixed wireless access market in 2025, making it the primary driver of current revenue. The segment was led by suburban and semi-rural households seeking a practical alternative to cable and DSL with faster activation and lower monthly pricing. This base enabled the United States fixed wireless access market to scale quickly, as carriers could add subscribers without waiting for last-mile infrastructure. It also created a broad installed base that supported later upselling into improved devices, stronger indoor coverage options, and higher-value plans.
Government and public safety are projected to expand at 14.88% CAGR through 2031, the fastest rate across application segments in the United States fixed wireless access market. This part of the market is supported by first-responder communications, facility connectivity needs, and public network resilience requirements that place emphasis on the speed of deployment and service continuity. Industrial use is also building as site-based operators use wireless connectivity for logistics, utilities, and operational settings where fast coverage and controlled deployment matter. Commercial demand remains important because small businesses and multisite users value short installation times and the ability to activate service without long construction dependencies. Within the United States fixed wireless access industry, this evolving mix should reduce the market's historical dependence on household demand alone by the end of the forecast period.
Complete Report Scope:
- By Type
- Hardware
- Consumer Premise Equipment (CPE)
- Access Units (Femto and Picocells)
- Services
- Hardware
- By Application
- Residential
- Commercial
- Industrial
- Government and Public Safety
- By Frequency Band
- Sub-6 GHz
- mmWave (Above 24 GHz)
- Unlicensed/Shared CBRS
- By Deployment Mode
- Indoor CPE
- Outdoor CPE
- Self-Install Window-Mount CPE
List of Companies Covered in this Report:
- Verizon Communications Inc.
- T-Mobile US, Inc.
- AT&T Inc.
- LTD Broadband
- Rise Broadband, Inc. (Rise Internet)
- Nextlink Internet
- Ericsson AB
- Nokia Corporation
- Samsung Electronics Co., Ltd.
- Qualcomm Technologies, Inc.
- Inseego Corp.
- Airspan Networks Holdings LLC
- Tarana Wireless, Inc.
- Cambium Networks Corporation
- DZS Inc.
- Arcadyan Technology Corporation
- Sercomm Corporation
- Zyxel Communications Corp.
- Adtran Holdings, Inc.
- Mavenir Systems, Inc.
Additional Benefits:
- The market estimate (ME) sheet in Excel format
- 3 months of analyst support
TABLE OF CONTENTS
1 INTRODUCTION
- 1.1 Study Assumptions and Market Definition
- 1.2 Scope of the Study
2 RESEARCH METHODOLOGY
3 EXECUTIVE SUMMARY
4 MARKET LANDSCAPE
- 4.1 Market Overview
- 4.2 Market Drivers
- 4.2.1 5G Roll-Out Accelerating Gigabit-Class Fixed Wireless Access Adoption
- 4.2.2 Rural Broadband Funding Favoring Rapid-Deploy Connectivity
- 4.2.3 Fixed Wireless Access as a Fiber Deferral Strategy for Cost-Constrained Builds
- 4.2.4 Enterprise Network Resilience Demand for Primary and Backup Broadband
- 4.2.5 AI-Optimized CPE and Self-Install to Cut Acquisition and Support Costs
- 4.2.6 Private Spectrum and Mid-Band Capacity Reuse Improving Economics in Dense Submarkets
- 4.3 Market Restraints
- 4.3.1 Mid-Band Spectrum Capacity Limits in High-Usage Markets
- 4.3.2 Fiber and Cable Price Competition Compressing Fixed Wireless Access Yield
- 4.3.3 mmWave Coverage and Line-of-Sight Sensitivity in High-Density Areas
- 4.3.4 Uneven Economics Where Fiber Payback Accelerates in Select Suburbs
- 4.4 Industry Value-Chain Analysis
- 4.5 Regulatory Landscape
- 4.6 Technological Outlook
- 4.6.1 Key Enablers for FWA Adoption
- 4.6.2 Vendor Initiatives and Partnerships
- 4.6.3 Business Considerations and Prerequisites
- 4.6.4 FWA vs FTTH / FTTdp Comparison
- 4.6.5 Rural, Semi-Urban and Urban Use-Case Models
- 4.7 Impact of Macroeconomic Factors on the Market
- 4.8 Porter's Five Forces Analysis
- 4.8.1 Bargaining Power of Suppliers
- 4.8.2 Bargaining Power of Buyers
- 4.8.3 Threat of New Entrants
- 4.8.4 Threat of Substitutes
- 4.8.5 Competitive Rivalry
5 MARKET SIZE AND GROWTH FORECASTS (VALUE)
- 5.1 By Type
- 5.1.1 Hardware
- 5.1.1.1 Consumer Premise Equipment (CPE)
- 5.1.1.2 Access Units (Femto and Picocells)
- 5.1.2 Services
- 5.1.1 Hardware
- 5.2 By Application
- 5.2.1 Residential
- 5.2.2 Commercial
- 5.2.3 Industrial
- 5.2.4 Government and Public Safety
- 5.3 By Frequency Band
- 5.3.1 Sub-6 GHz
- 5.3.2 mmWave (Above 24 GHz)
- 5.3.3 Unlicensed/Shared CBRS
- 5.4 By Deployment Mode
- 5.4.1 Indoor CPE
- 5.4.2 Outdoor CPE
- 5.4.3 Self-Install Window-Mount CPE
6 COMPETITIVE LANDSCAPE
- 6.1 Market Concentration
- 6.2 Strategic Moves
- 6.3 Market Share Analysis
- 6.4 Company Profiles (includes Global Level Overview, Market Level Overview, Core Segments, Financials as Available, Strategic Information, Market Rank/Share for Key Companies, Products and Services, and Recent Developments)
- 6.4.1 Verizon Communications Inc.
- 6.4.2 T-Mobile US, Inc.
- 6.4.3 AT&T Inc.
- 6.4.4 LTD Broadband
- 6.4.5 Rise Broadband, Inc. (Rise Internet)
- 6.4.6 Nextlink Internet
- 6.4.7 Ericsson AB
- 6.4.8 Nokia Corporation
- 6.4.9 Samsung Electronics Co., Ltd.
- 6.4.10 Qualcomm Technologies, Inc.
- 6.4.11 Inseego Corp.
- 6.4.12 Airspan Networks Holdings LLC
- 6.4.13 Tarana Wireless, Inc.
- 6.4.14 Cambium Networks Corporation
- 6.4.15 DZS Inc.
- 6.4.16 Arcadyan Technology Corporation
- 6.4.17 Sercomm Corporation
- 6.4.18 Zyxel Communications Corp.
- 6.4.19 Adtran Holdings, Inc.
- 6.4.20 Mavenir Systems, Inc.
7 MARKET OPPORTUNITIES AND FUTURE OUTLOOK
- 7.1 White-Space and Unmet-Need Assessment

 2026-2030年全球5G固定無線存取(FWA)市場
 固定無線存取:市場佔有率分析、產業趨勢與統計資料、成長預測(2026-2031 年)中國固定無線接取市場:市場佔有率分析、產業趨勢與統計及成長預測(2026-2031年)印度固定無線存取:市場佔有率分析、產業趨勢與統計及成長預測(2026-2031 年)英國固定無線接取:市場佔有率分析、產業趨勢與統計及成長預測(2026-2031 年)日本固定無線接取市場:市場佔有率分析、產業趨勢與統計及成長預測(2026-2031 年)
 固定無線存取固定無線存取(FWA):市場數據概覽(2026 年第二季)消費者 FWA(固定無線存取)消費者固定無線接取市場數據概覽:2026 年第二季度