


 |
市場調查報告書
商品編碼
2123287
固定無線存取:市場佔有率分析、產業趨勢與統計資料、成長預測(2026-2031 年)Fixed Wireless Access - Market Share Analysis, Industry Trends & Statistics, Growth Forecasts (2026 - 2031) |
||||||

※ 本網頁內容可能與最新版本有所差異。詳細情況請與我們聯繫。
根據 Mordor Intelligence 預測,固定無線接取市場預計將從 2025 年的 373 億美元成長到 2026 年的 434.7 億美元,到 2031 年達到 843.7 億美元,2026 年至 2031 年的複合年成長率為 14.18%。
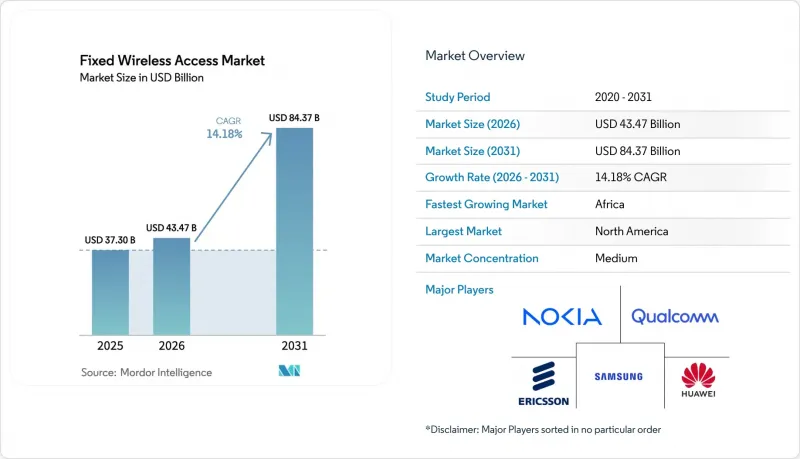
本報告按類型(硬體、服務)、應用(住宅、商業、工業、政府/公共安全)、頻段(6 GHz 以下、毫米波、免許可/共用CBRS)、部署方式(室內 CPE、室外 CPE、自行安裝的窗式 CPE)和地區進行細分。市場預測以美元 (USD) 為單位。
全球固定無線接取市場趨勢與洞察
5G部署正在加速Gigabit級固定無線存取網(FWA)的發展。
中頻寬5G(3.3 GHz至4.2 GHz)兼顧了覆蓋範圍和容量,使Gigabit級固定無線存取(FWA)在商業性可行。到2024年,美國營運商已在70多個大都會圈推出5G家庭網路服務,平均下載速度超過300 Mbps,尖峰時段超過1 Gbps。日本、韓國和印度的業者也紛紛效仿,利用現有的行動基地台,避免鋪設長距離光纖電纜。隨著營運商從LTE過渡到5G新空口(NR),每位元傳輸成本降低了約40%,使其定價能夠與現有有線電視營運商競爭。產業預測,到2029年,全球FWA連線數將超過3.3億,其中5G將佔據2026年及以後新增連線數的幾乎所有佔有率。
區域寬頻推廣計劃
美國「寬頻普及與舉措」(BEAD)已累計424.5億美元用於2024年服務欠缺地區,明確將固定無線存取(FWA)視為一種可接受的解決方案。德克薩斯州和蒙大拿州等州正在資助光纖建設成本超過每戶1萬美元的地區的無線網路開發。歐洲的「數位十年」政策也採取了類似的立場,批准在光纖建設經濟上不可行地區採用FWA,前提是能夠保證對稱的100Mbps速度。印度的「BharatNet第三階段」和澳洲的「區域寬頻計畫」也將FWA納入合格範圍,從而確保了未來多年的穩定需求。
光纖價格的下降給FWA的ARPU(每位用戶平均收入)帶來了壓力。
現有有線電視和光纖營運商計劃在2024年至2025年間將Gigabit線路資費降低高達20%,這將對無線營運商的平均用戶收入(ARPU)造成壓力。一些業者目前正將固定無線存取(FWA)與無限流量行動套餐捆綁銷售,並為捆綁套餐提供10至25美元的折扣,以維持用戶成長。這種策略轉變正促使競爭對手的關注點從單純的價格轉向體驗要素,例如快速自助安裝、每月合約和及時的客戶支援。
細分市場分析
預計到2025年,硬體收入將佔總收入的64.68%,這主要得益於室內閘道器、室外單元和小型基地台的部署。儘管硬體收入佔據主導地位,但預計到2031年,業務收益的複合年成長率將達到15.36%,超過硬體收入的成長速度,因為營運商正專注於訂閱模式以確保穩定的現金流。固定無線存取(FWA)市場預計將從2026年的154億美元成長到2031年的約320億美元。諸如補貼或免費提供CPE(用戶端設備)等策略將加速用戶獲取,使營運商能夠透過24個月或36個月的合約計畫收回終端成本。
提供的託管服務包括網路監控、雲端託管安全性和即時品質分析。德國電信的機器學習引擎能夠預測終端故障,並在服務中斷前發送替換終端,從而降低解約率和服務呼叫量。此外,接取單元的出貨趨勢正轉向兼具網狀網路節點功能的多功能終端,這不僅降低了回程傳輸成本,也擴大了室內覆蓋範圍。
預計到2025年,住宅需求將佔總連接數的71.91%,凸顯了固定無線存取(FWA)作為有線和DSL替代方案的內在提案。然而,政府和公共安全機構使用者目前是成長最快的群體,其複合年成長率(CAGR)高達14.77%,這主要得益於容錯需求。美國緊急應變機構已於2024年為行動指揮中心部署了5G認證的FWA設備。同時,日本各都道府縣也被要求在2026年前建立備用無線網路。
當短期內專用線路無法使用時,零售連鎖店擴大採用固定無線接入 (FWA) 來實現門市的快速部署。咖啡店、物流倉庫和飯店等場所表示,與傳統 DSL 相比,FWA 的總連線成本更低,服務回應時間更短。工業園區也逐漸意識到專用 5G 切片在支援機器人和低延遲自動化方面的價值,固定無線存取市場正在從傳統的寬頻擴展到更廣泛的領域。
區域分析
預計到2025年,北美將佔全球銷售額的33.56%,這主要得益於美國和加拿大積極部署中波頻段,這些頻段是在近期的競標中獲得的。該地區的固定無線接取市場佔有率已趨於穩定,家庭普及率超過15%,促使業者逐步拓展農村地區的業務。儘管來自低價光纖的競爭日益激烈,但透過聯邦計畫收回資本支出的工作仍在繼續。
預計非洲將成為成長最快的地區,到2031年複合年成長率將達到15.06%。南非、肯亞、奈及利亞和埃及的電信業者正在利用現有的LTE基地台,將服務擴展到銅纜和有限的光纖網路之外。價格通常比有線網路低30-40%,這推動了行動優先家庭用戶的快速成長。
亞太地區仍然是成長的主要驅動力,印度、中國和日本正在部署固定無線存取(FWA)技術,以彌合偏遠地區的數位落差。印度的旗艦5G FWA服務面向1億戶家庭,價格比有線網路低約40%。在中東,沙烏地阿拉伯和阿拉伯聯合大公國政府分配的頻段使電信業者能夠提供千兆Gigabit的住宅和商業套餐,而歐洲的成長仍然緩慢,因為政府援助政策仍然優先考慮光纖基礎設施建設。
其他好處:
- Excel格式的市場預測(ME)表
- 3個月的分析師支持
目錄
第1章:引言
- 研究假設和市場定義
- 調查範圍
第2章:調查方法
第3章執行摘要
第4章 市場狀況
- 市場概覽
- 市場促進因素
- 5G 的部署正在加速Gigabit級固定廣域網路 (FWA) 的發展。
- 農村地區寬頻普及推廣計劃
- FWA:一種經濟高效的光纖最後一公里替代方案。
- 企業級 SD-WAN 備份連線的需求
- 設計頻率競標以促進頻寬共用
- AI最佳化的CPE自助安裝減少了現場訪問次數。
- 企業淨零排放目標的日益提高,正在推動更節能的無線存取技術的發展。
- 市場限制因素
- 頻寬不足和監管不確定性
- 與毫米波頻段密度增加相關的資本投資
- 光纖價格的下降給FWA(免費廣域網路)服務的平均每用戶收入(ARPU)帶來了壓力。
- 毫米波頻段中氣象因素導致的訊號劣化
- 國家援助法規限制了補貼性固定資產的引進。
- 產業價值鏈分析
- 監理情勢
- 技術展望
- FWA實施的關鍵要素
- 供應商計劃和合作關係
- 商業考量和前提條件
- FWA 與 FTTH/FTTdp 的比較
- 農村、郊區和都市區的用例模型
- 宏觀經濟因素對市場的影響
- 波特五力分析
第5章 市場規模與成長預測
- 按類型
- 硬體
- 消費性設備(CPE)
- 接入單元(毫微微基地台和微微型基地台)
- 服務
- 硬體
- 透過使用
- 住宅
- 商業的
- 產業
- 政府/公共安全
- 按頻段
- 6GHz以下頻段
- 毫米波(24 GHz 以上)
- 免執照頻段/共用CBRS
- 部署模式
- 室內CPE
- 戶外CPE
- 自行安裝的窗型CPE
- 按地區
- 北美洲
- 美國
- 加拿大
- 墨西哥
- 南美洲
- 巴西
- 阿根廷
- 其他南美國家
- 歐洲
- 英國
- 德國
- 法國
- 義大利
- 其他歐洲國家
- 亞太地區
- 中國
- 日本
- 印度
- 韓國
- 其他亞洲國家
- 中東和非洲
- 中東
- 以色列
- 沙烏地阿拉伯
- 阿拉伯聯合大公國
- 土耳其
- 其他中東國家
- 非洲
- 南非
- 埃及
- 其他非洲國家
- 中東
- 北美洲
第6章 競爭情勢
- 市場集中度
- 策略趨勢
- 市佔率分析
- 公司簡介
- Huawei Technologies Co. Ltd.
- Nokia Corporation
- Ericsson AB
- Qualcomm Technologies Inc.
- Samsung Electronics Co. Ltd.
- Verizon Communications Inc.
- AT&T Inc.
- T-Mobile US Inc.
- United States Cellular Corporation
- ZTE Corporation
- Deutsche Telekom AG
- Vodafone Group Plc
- Orange SA
- Telstra Corporation Limited
- Globe Telecom Inc.
- Inseego Corp.
- Airspan Networks Holdings Inc.
- Siklu Communication Ltd.
- Starry Group Holdings Inc.
- Tarana Wireless Inc.
- Cambium Networks Corporation
- Casa Systems Inc.
- NETGEAR Inc.
第7章 市場機會與未來展望
According to Mordor Intelligence, the fixed wireless access market size is expected to increase from USD 37.30 billion in 2025 to USD 43.47 billion in 2026 and reach USD 84.37 billion by 2031, growing at a CAGR of 14.18% over 2026-2031.
This report is Segmented by Type (Hardware, Services), Application (Residential, Commercial, Industrial, Government and Public Safety), Frequency Band (Sub-6 GHz, Mmwave, Unlicensed/Shared CBRS), Deployment Mode (Indoor CPE, Outdoor CPE, Self-Install Window-Mount CPE), and Geography. The Market Forecasts are Provided in Terms of Value (USD).
Global Fixed Wireless Access Market Trends and Insights
5G Rollout Accelerating Gigabit-Class FWA
Mid-band 5G between 3.3 GHz and 4.2 GHz combines coverage and capacity, making gigabit-class FWA commercially viable. U.S. operators launched 5G home internet in more than 70 metropolitan areas during 2024, delivering median download speeds above 300 Mbps and peaks above 1 Gbps. Carriers in Japan, South Korea, and India mirrored this push, using existing mobile sites to avoid long fiber build-outs. Per-bit delivery cost falls by roughly 40% when operators shift from LTE to 5G New Radio, allowing competitive pricing against cable incumbents. Industry forecasts show global FWA connections exceeding 330 million by 2029, with 5G accounting for nearly all net additions after 2026.
Rural Broadband Stimulus Programmes
The United States BEAD initiative earmarked USD 42.45 billion in 2024 for unserved locations and explicitly labeled FWA as an acceptable solution. States such as Texas and Montana are directing funds toward wireless builds where fiber costs exceed USD 10,000 per passing. Europe's Digital Decade policy takes a similar stance, permitting FWA in areas where fiber economics are unfavorable, provided symmetrical 100 Mbps is guaranteed. India's BharatNet Phase III and Australia's Regional Broadband Scheme also include FWA eligibility, anchoring multi-year demand pipelines.
Fiber Price Erosion Compressing FWA ARPU
Cable and fiber incumbents lowered gigabit tariffs by up to 20% during 2024-2025, squeezing average revenue per user for wireless competitors. Some carriers now bundle FWA with mobile unlimited plans, discounting combined service by USD 10-USD 25 to sustain subscriber growth. The strategic pivot shifts competition from pure price to experiential factors such as rapid self-installation, month-to-month contracts, and responsive customer support.
Other drivers and restraints analyzed in the detailed report include:
- FWA as Cost-Effective Last-Mile Alternative to Fiber
- Enterprise SD-WAN Backup Connectivity Demand
- Weather-Induced Signal Degradation in mmWave Bands
For complete list of drivers and restraints, kindly check the Table Of Contents.
Segment Analysis
Hardware accounted for 64.68% of 2025 revenue, mirroring the installed base of indoor gateways, outdoor units, and small-cell radios. Despite this lead, services revenue is set to outpace hardware at 15.36% CAGR through 2031, as operators lean on subscription models for stable cash flow. The Fixed Wireless Access market size for services is projected to rise from USD 15.4 billion in 2026 to nearly USD 32 billion by 2031. Subsidized or zero-cost CPE tactics accelerate subscriber onboarding, letting carriers recoup device spend over 24- or 36-month plans.
Managed-service offerings span network monitoring, cloud-hosted security, and real-time quality analytics. Deutsche Telekom's machine-learning engine predicts device failure and dispatches replacements before outages occur, cutting churn and service calls. Access-unit shipments are also shifting toward multi-role devices that double as mesh nodes, reducing backhaul costs and expanding indoor reach.
Residential demand captured 71.91% of 2025 connections, underpinning FWA's original value proposition as a cable and DSL substitute. Yet government and public-safety users now represent the fastest-growing slice, advancing at 14.77% CAGR on resilience mandates. First responder agencies in the United States gained 5G-certified FWA gear for mobile command posts in 2024, while Japan's prefectural governments must equip backup wireless links by 2026.
Commercial chains favor FWA for rapid store openings when leased lines are unavailable on short notice. Coffee shops, logistics warehouses, and hospitality venues report lower total connectivity cost and faster provisioning than legacy DSL. Industrial campuses see value in private 5G slices that support robotics and low-latency automation, expanding the Fixed Wireless Access market beyond pure broadband.
Complete Report Scope:
- By Type
- Hardware
- Consumer Premise Equipment (CPE)
- Access Units (Femto and Picocells)
- Services
- Hardware
- By Application
- Residential
- Commercial
- Industrial
- Government and Public Safety
- By Frequency Band
- Sub-6 GHz
- mmWave (Above 24 GHz)
- Unlicensed / Shared CBRS
- By Deployment Mode
- Indoor CPE
- Outdoor CPE
- Self-Install Window-Mount CPE
- By Geography
- North America
- United States
- Canada
- Mexico
- South America
- Brazil
- Argentina
- Rest of South America
- Europe
- United Kingdom
- Germany
- France
- Italy
- Rest of Europe
- Asia-Pacific
- China
- Japan
- India
- South Korea
- Rest of Asia
- Middle East and Africa
- Middle East
- Israel
- Saudi Arabia
- United Arab Emirates
- Turkey
- Rest of Middle East
- Africa
- South Africa
- Egypt
- Rest of Africa
- Middle East
- North America
Geography Analysis
North America generated 33.56% of 2025 revenue, buoyed by aggressive U.S. and Canadian rollouts that leverage mid-band spectrum cleared in recent auctions. The Fixed Wireless Access market share in the region is stabilizing as household penetration tops 15%, prompting carriers to chase incremental growth in rural clusters. Federal programs continue to reimburse capital spend, although competition from discounted fiber is intensifying.
Africa is set to deliver the fastest growth at 15.06% CAGR through 2031. Operators in South Africa, Kenya, Nigeria, and Egypt build on existing LTE towers, vaulting over copper and limited fiber grids. Price points often undercut wired alternatives by 30%-40%, prompting rapid subscriber adoption among mobile-first households.
Asia-Pacific remains a scale engine where India, China, and Japan deploy FWA to close digital gaps in remote regions. India's flagship 5G FWA service targets 100 million households at pricing roughly 40% below cable. In the Middle East, sovereign spectrum allocations allow carriers in Saudi Arabia and the United Arab Emirates to ship multi-gigabit residential and enterprise packages, while Europe's growth trails due to state-aid rules that still prioritize fiber builds.
- Huawei Technologies Co. Ltd.
- Nokia Corporation
- Ericsson AB
- Qualcomm Technologies Inc.
- Samsung Electronics Co. Ltd.
- Verizon Communications Inc.
- AT&T Inc.
- T-Mobile US Inc.
- United States Cellular Corporation
- ZTE Corporation
- Deutsche Telekom AG
- Vodafone Group Plc
- Orange S.A.
- Telstra Corporation Limited
- Globe Telecom Inc.
- Inseego Corp.
- Airspan Networks Holdings Inc.
- Siklu Communication Ltd.
- Starry Group Holdings Inc.
- Tarana Wireless Inc.
- Cambium Networks Corporation
- Casa Systems Inc.
- NETGEAR Inc.
Additional Benefits:
- The market estimate (ME) sheet in Excel format
- 3 months of analyst support
TABLE OF CONTENTS
1 INTRODUCTION
- 1.1 Study Assumptions and Market Definition
- 1.2 Scope of the Study
2 RESEARCH METHODOLOGY
3 EXECUTIVE SUMMARY
4 MARKET LANDSCAPE
- 4.1 Market Overview
- 4.2 Market Drivers
- 4.2.1 5G Roll-Out Accelerating Gigabit-Class FWA
- 4.2.2 Rural Broadband Stimulus Programmes
- 4.2.3 FWA as Cost-Effective Last-Mile Alternative to Fibre
- 4.2.4 Enterprise SD-WAN Back-Up Connectivity Demand
- 4.2.5 Spectrum Auction Design Favouring Mid-Band Sharing
- 4.2.6 AI-Optimised CPE Self-Install Reducing Truck Rolls
- 4.2.7 Rise of Corporate Net-Zero Targets Driving Wireless Power-Efficient Access
- 4.3 Market Restraints
- 4.3.1 Spectrum Scarcity and Regulatory Uncertainty
- 4.3.2 High mmWave Densification CAPEX
- 4.3.3 Fibre Price Erosion Compressing FWA ARPU
- 4.3.4 Weather-Induced Signal Degradation in mmWave Bands
- 4.3.5 State-Aid Rules Limiting Subsidised FWA Deployments
- 4.4 Industry Value-Chain Analysis
- 4.5 Regulatory Landscape
- 4.6 Technological Outlook
- 4.6.1 Key Enablers for FWA Adoption
- 4.6.2 Vendor Initiatives and Partnerships
- 4.6.3 Business Considerations and Prerequisites
- 4.6.4 FWA vs FTTH / FTTdp Comparison
- 4.6.5 Rural, Semi-Urban and Urban Use-Case Models
- 4.7 Impact of Macroeconomic Factors on the Market
- 4.8 Porter's Five Forces Analysis
- 4.8.1 Bargaining Power of Suppliers
- 4.8.2 Bargaining Power of Buyers
- 4.8.3 Threat of New Entrants
- 4.8.4 Threat of Substitutes
- 4.8.5 Competitive Rivalry
5 MARKET SIZE AND GROWTH FORECASTS (VALUE)
- 5.1 By Type
- 5.1.1 Hardware
- 5.1.1.1 Consumer Premise Equipment (CPE)
- 5.1.1.2 Access Units (Femto and Picocells)
- 5.1.2 Services
- 5.1.1 Hardware
- 5.2 By Application
- 5.2.1 Residential
- 5.2.2 Commercial
- 5.2.3 Industrial
- 5.2.4 Government and Public Safety
- 5.3 By Frequency Band
- 5.3.1 Sub-6 GHz
- 5.3.2 mmWave (Above 24 GHz)
- 5.3.3 Unlicensed / Shared CBRS
- 5.4 By Deployment Mode
- 5.4.1 Indoor CPE
- 5.4.2 Outdoor CPE
- 5.4.3 Self-Install Window-Mount CPE
- 5.5 By Geography
- 5.5.1 North America
- 5.5.1.1 United States
- 5.5.1.2 Canada
- 5.5.1.3 Mexico
- 5.5.2 South America
- 5.5.2.1 Brazil
- 5.5.2.2 Argentina
- 5.5.2.3 Rest of South America
- 5.5.3 Europe
- 5.5.3.1 United Kingdom
- 5.5.3.2 Germany
- 5.5.3.3 France
- 5.5.3.4 Italy
- 5.5.3.5 Rest of Europe
- 5.5.4 Asia-Pacific
- 5.5.4.1 China
- 5.5.4.2 Japan
- 5.5.4.3 India
- 5.5.4.4 South Korea
- 5.5.4.5 Rest of Asia
- 5.5.5 Middle East and Africa
- 5.5.5.1 Middle East
- 5.5.5.1.1 Israel
- 5.5.5.1.2 Saudi Arabia
- 5.5.5.1.3 United Arab Emirates
- 5.5.5.1.4 Turkey
- 5.5.5.1.5 Rest of Middle East
- 5.5.5.2 Africa
- 5.5.5.2.1 South Africa
- 5.5.5.2.2 Egypt
- 5.5.5.2.3 Rest of Africa
- 5.5.5.1 Middle East
- 5.5.1 North America
6 COMPETITIVE LANDSCAPE
- 6.1 Market Concentration
- 6.2 Strategic Moves
- 6.3 Market Share Analysis
- 6.4 Company Profiles (includes Global Level Overview, Market Level Overview, Core Segments, Financials as Available, Strategic Information, Market Rank/Share for Key Companies, Products and Services, and Recent Developments)
- 6.4.1 Huawei Technologies Co. Ltd.
- 6.4.2 Nokia Corporation
- 6.4.3 Ericsson AB
- 6.4.4 Qualcomm Technologies Inc.
- 6.4.5 Samsung Electronics Co. Ltd.
- 6.4.6 Verizon Communications Inc.
- 6.4.7 AT&T Inc.
- 6.4.8 T-Mobile US Inc.
- 6.4.9 United States Cellular Corporation
- 6.4.10 ZTE Corporation
- 6.4.11 Deutsche Telekom AG
- 6.4.12 Vodafone Group Plc
- 6.4.13 Orange S.A.
- 6.4.14 Telstra Corporation Limited
- 6.4.15 Globe Telecom Inc.
- 6.4.16 Inseego Corp.
- 6.4.17 Airspan Networks Holdings Inc.
- 6.4.18 Siklu Communication Ltd.
- 6.4.19 Starry Group Holdings Inc.
- 6.4.20 Tarana Wireless Inc.
- 6.4.21 Cambium Networks Corporation
- 6.4.22 Casa Systems Inc.
- 6.4.23 NETGEAR Inc.
7 MARKET OPPORTUNITIES AND FUTURE OUTLOOK
- 7.1 White-Space and Unmet-Need Assessment

 固定無線接取市場預測至2034年-按服務類型、技術、頻率、設備類型、應用、部署環境、最終用戶和地區分類的全球分析
 2026-2030年全球5G固定無線存取(FWA)市場
 中國固定無線接取市場:市場佔有率分析、產業趨勢與統計及成長預測(2026-2031年)印度固定無線存取:市場佔有率分析、產業趨勢與統計及成長預測(2026-2031 年)英國固定無線接取:市場佔有率分析、產業趨勢與統計及成長預測(2026-2031 年)日本固定無線接取市場:市場佔有率分析、產業趨勢與統計及成長預測(2026-2031 年)
 固定無線存取固定無線存取(FWA):市場數據概覽(2026 年第二季)消費者 FWA(固定無線存取)消費者固定無線接取市場數據概覽:2026 年第二季度