


 |
市場調查報告書
商品編碼
2097192
數位電子看板服務:市場佔有率分析、產業趨勢與統計、成長預測(2026-2031)Digital Signage Services - Market Share Analysis, Industry Trends & Statistics, Growth Forecasts (2026 - 2031) |
||||||

※ 本網頁內容可能與最新版本有所差異。詳細情況請與我們聯繫。
根據 Mordor Intelligence 估計,數位電子看板服務市場在 2026 年的價值將達到 54.5 億美元,高於 2025 年的 51.2 億美元,預計到 2031 年將達到 74.2 億美元。
預計從 2026 年到 2031 年,其複合年成長率將達到 6.38%。
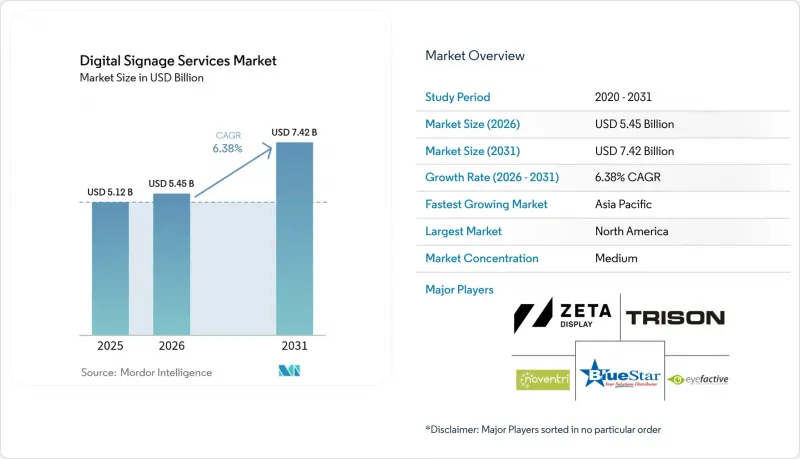
本報告按服務類型(網路設計與安裝、維護與支援等)、部署方式(本地部署、雲端/主機管理)、安裝位置(室內、室外、半室外)、最終用戶產業(零售與批發、運輸與物流、飯店與休閒等)以及地區進行細分。市場預測以美元計價。
全球數位電子看板服務市場趨勢與洞察
零售業對店內動態通訊的需求。
零售商已根據即時資料饋送重新設計了店內通訊系統。沃爾瑪在2300家門市部署數位價格顯示器的專案需要2億美元的資本投資,並需要持續的內容管理和設備監控。像7-Eleven這樣的便利商店連鎖運營著超過8400個雲端管理顯示螢幕,這些顯示螢幕可將促銷活動與存量基準同步。專業的系統整合商正從與資料架構和工作流程自動化相關的諮詢收入中獲益。像Kwik Trip這樣的本地雜貨店報告稱,透過遷移到減少硬體連接點的系統晶片(SoC)顯示螢幕,每年可節省190萬美元的成本。
交通樞紐旅客資訊服務現代化
公車、鐵路和機場營運商正在用雲端託管的整合網路取代孤立的顯示螢幕,該網路可將即時營運資料傳輸到各個站點。灰狗巴士公司利用飛利浦的D-Line和P-Line螢幕,透過單一內容平台進行管理,連接了50多個城市。集中管理簡化了範本標準化、品牌推廣和緊急警報分發流程,同時,雙方也簽署了涵蓋設計、整合和全天候支援的多年期合約。多語言內容、無障礙合規性和行動切換功能正在拓展服務供應商的專案範圍。
新興市場多站點網路的高總擁有成本
在多個地點部署數位電子看板可能需要大量的初始投資和持續投入。這些成本通常包括顯示器、媒體播放機、安裝、網路設定、軟體許可、維護以及定期硬體更換。在新興經濟體,預算緊張和資金籌措有限,使得承擔這些費用更具挑戰性。連接性和電源可靠性問題也會導致營運成本增加和服務中斷。對於管理大規模網路的公司而言,總擁有成本 (TCO) 會隨著時間的推移而迅速成長。這使得一些組織難以在試點階段之後擴展數位電子看板的應用規模。因此,高昂的總擁有成本仍然是成本敏感型市場的重要阻礙因素。
細分市場分析
到2025年,「維護與支援」將佔數位電子看板服務市場佔有率的44.10%,凸顯了全天候診斷、韌體更新和現場維修的重要性。 「託管/雲端網路服務」正以7.95%的複合年成長率快速成長,這主要得益於企業對遠端監控、自動化內容分發和分析儀錶板的需求。因此,與故障響應合約相關的數位電子看板服務市場正轉向結合備件庫和設備狀態警報的預測模型。
持續的雲端遷移正在重塑收入來源。服務提供者透過將託管、API整合和效能報告與訂閱收費相結合,創造了穩定且持續的現金流。諮詢、內容創作和分析服務也順應這一趨勢,幫助客戶將庫存資訊、會員資料和受眾指標整合到動態播放清單中。隨著零售商努力打造衛生安全的體驗,專業的非接觸式互動計畫也作為附加服務被納入其中。
到2025年,本地部署的託管解決方案將佔據數位電子看板服務市場58.90%的佔有率,這主要得益於醫療保健、金融和政府用戶對本地伺服器和資料居住的強勁需求。雲端/託管管理平台則以7.52%的複合年成長率成長,這主要由缺乏內部IT支援的中小型企業以及尋求集中管理的多站點品牌所推動。
混合拓撲結構正在興起,它透過將內容儲存在本地,同時從頻寬獲取調度邏輯,從而平衡運作和擴充性。供應商正透過加密媒體管道、基於角色的存取控制和自動修補框架等功能來凸顯自身優勢。隨著頻寬成本的降低,即使是對資料安全高度敏感的行業也在嘗試使用雲端沙箱來儲存非個人化內容,這預示著託管服務的市場佔有率未來將進一步擴大。
區域分析
預計到2025年,北美地區的銷售額將佔全球總銷售額的37.40%,主要得益於大規模零售門市翻新、覆蓋全國的交通網路以及雲端運算的早期應用。沃爾瑪涵蓋2300家門市的價格標籤項目以及7-Eleven在8400個地點的展示設施,都清晰地展現了需要多年期管理服務合約的項目規模之大。政府旨在促進基礎設施建設的獎勵策略,例如公車和鐵路乘客資訊系統的升級,進一步提振了市場需求。
亞太地區是成長最快的地區,預計到2031年複合年成長率將達到6.95%。高都市區、競爭激烈的零售市場以及政府對中小企業數位轉型的津貼正在推動數位轉型。訂閱式內容管理系統(CMS)解決方案降低了資本支出(CAPEX),並促進了本地零售商和快餐連鎖店的市場准入。中國和韓國強大的面板製造生態系統正在縮短供應週期並降低硬體價格。
歐洲正穩步推動相關工作,但也面臨合規的挑戰。為了滿足NIS 2指令的要求,各公司增加了安全預算。能源效率指令和城市級碳排放目標正在推動LED升級和生命週期服務合約的簽訂。數位電子看板服務產業正努力應對複雜的隱私法規,而歐盟復甦基金則正在幫助中小企業降低實施成本。
其他好處:
- Excel格式的市場預測(ME)表
- 3個月的分析師支持
目錄
第1章:引言
- 研究假設和市場定義
- 調查範圍
第2章:調查方法
第3章執行摘要
第4章 市場狀況
- 市場概覽
- 市場促進因素
- 北美地區的即時數據整合正在加速零售業對店內動態通訊的需求。
- 交通樞紐正透過集中式雲端管理網路實現與乘客溝通的現代化。
- 4K/8K LED幕牆的快速普及促進了長期維護合約的簽訂。
- 亞太地區中小企業採用訂閱式內容管理系統可減少初始資本投入。
- 醫療機構內的標誌和病人參與螢幕正在推動服務外包。
- 節能法規鼓勵對現有照明系統維修,並鼓勵簽訂生命週期服務合約。
- 市場限制因素
- 新興市場多站點網路的高總擁有成本
- 內容更新的負擔給中小型零售商帶來了投資回報率的擔憂。
- 歐洲網路安全和資料隱私合規成本
- 服務標準低的系統整合商透過降價來降低價格,這給利潤率帶來了壓力。
- 產業生態系分析
- 波特五力分析
第5章 市場規模與成長預測
- 按服務類型
- 網路設計與部署
- 維護和支援
- 內容創作與諮詢
- 主機/雲端網路服務
- 分析和報告服務
- 其他專業服務(互動式和非接觸式整合)
- 部署模式
- 本地管理
- 雲端/託管式管理
- 按位置
- 室內的
- 戶外的
- 半戶外
- 按最終用戶行業分類
- 零售和批發
- 運輸/物流
- 飯店及休閒
- 衛生保健
- 教育
- 企業和銀行、金融服務和保險業
- 政府和公共機構
- 體育和娛樂設施
- 其他
- 按顯示格式
- 電視牆
- 自助服務終端和資訊亭
- 選單板
- 數位海報和數位廣告牌
- 互動式觸控螢幕
- 透明顯示器和全像顯示器
- 按地區
- 北美洲
- 美國
- 加拿大
- 墨西哥
- 歐洲
- 德國
- 英國
- 法國
- 西班牙
- 其他歐洲國家
- 南美洲
- 巴西
- 其他南美國家
- 亞太地區
- 中國
- 日本
- 印度
- 東南亞
- 其他亞太國家
- 中東和非洲
- 中東
- 波灣合作理事會(GCC)成員國
- 土耳其
- 其他中東國家
- 非洲
- 南非
- 其他非洲國家
- 中東
- 北美洲
第6章 競爭情勢
- 市場集中度
- 策略趨勢
- 市佔率分析
- 公司簡介
- STRATACACHE Inc.
- Samsung SDS Co., Ltd.
- LG Electronics Inc.
- Sharp NEC Display Solutions Ltd.
- Scala Enterprise(STRATACACHE)
- Four Winds Interactive LLC
- Mood Media Corp.
- Mvix Digital Signage
- Spectrio LLC
- BrightSign LLC
- Broadsign International Inc.
- Signagelive Ltd.
- Visix Inc.
- NoviSign Digital Signage
- Yodeck(Flipnode LLC)
- Enplug, Inc.(Spectrio)
- Nanonation Inc.
- Trison World
- ZetaDisplay AB
- Panasonic Connect Co., Ltd.
- eyefactive GmbH
第7章 市場機會與未來展望
According to Mordor Intelligence, digital signage services market size in 2026 is estimated at USD 5.45 billion, growing from 2025 value of USD 5.12 billion with 2031 projections showing USD 7.42 billion, growing at 6.38% CAGR over 2026-2031.
This report is Segmented by Service Type (Network Design and Installation, Maintenance and Support, and More), Deployment Mode (On-Premise Managed, and Cloud/Hosted Managed), Location (Indoor, Outdoor, and Semi-Outdoor), End-User Vertical (Retail and Wholesale, Transportation and Logistics, Hospitality and Leisure, and More), and Geography. The Market Forecasts are Provided in Terms of Value (USD).
Global Digital Signage Services Market Trends and Insights
Retail demand for dynamic in-store messaging
Retailers redesigned store communication around real-time data feeds. Walmart's roll-out of digital price screens across 2,300 stores represented a USD 200 million capital program that needs ongoing content orchestration and device monitoring. Convenience chains such as 7-Eleven run more than 8,400 cloud-managed displays that synchronize promotions with inventory levels. Specialist integrators benefit from consulting revenues tied to data architecture and workflow automation. Regional grocers like Kwik Trip reported USD 1.9 million in annual savings after shifting to system-on-chip displays that reduce hardware points.
Transportation hubs modernize passenger communication
Bus, rail and airport operators are replacing isolated displays with unified, cloud-hosted networks that push live travel data across sites. Greyhound connected over 50 cities using Philips D-Line and P-Line screens managed through a single content platform. Centralized control simplifies template standards, branding and emergency alerts while creating multi-year service contracts covering design, integration and 24 X 7 support. Multilingual content, accessibility compliance and mobile hand-off features widen project scope for service providers.
High TCO for Multi-Site Networks in Emerging Economies
Deploying digital signage across multiple locations can require substantial upfront and ongoing investment. Costs typically include displays, media players, installation, networking, software licenses, maintenance, and periodic hardware replacement. In emerging economies, these expenses can be harder to absorb because budgets are tighter and access to financing may be limited. Connectivity and power reliability issues can also increase operating costs and service interruptions. For businesses managing large networks, the total cost of ownership can rise quickly over time. This makes it harder for some organizations to scale digital signage beyond pilot deployments. As a result, high TCO remains a major restraint in cost-sensitive markets.
Other drivers and restraints analyzed in the detailed report include:
- Rapid deployment of 4K/8K LED walls
- Subscription-based CMS adoption by SMBs
- Content Refresh Fatigue Causing ROI Concerns for Small Retailers
For complete list of drivers and restraints, kindly check the Table Of Contents.
Segment Analysis
Maintenance and Support accounted for 44.10% of the Digital Signage Services market share in 2025, underscoring the importance of round-the-clock diagnostics, firmware updates and field repairs. Managed / Cloud Network Services is expanding at an 7.95% CAGR as enterprises favor remote monitoring, automated content distribution and analytics dashboards. The Digital Signage Services market size tied to break-fix contracts is therefore evolving toward predictive models that bundle spare-part pools and device health alerts.
Ongoing cloud migration is reshaping revenue mixes. Providers wrap subscription billing around hosting, API integrations and performance reporting, creating stable recurring cash flows. Consulting, content creation and analytics services ride this shift by helping clients connect inventory feeds, loyalty data and audience metrics to dynamic playlists. Specialist touchless-interaction projects add incremental services as retailers aim for hygienic experiences.
On-premise Managed solutions held 58.90% of the Digital Signage Services market size in 2025 as healthcare, finance and government users insisted on local servers and data residency. Cloud / Hosted Managed platforms are growing at 7.52% CAGR, propelled by SMBs that lack in-house IT support and by multi-site brands seeking centralized control.
Hybrid topologies are emerging that store content locally yet draw scheduling logic from the cloud, balancing uptime with scalability. Vendors differentiate through encrypted media pipelines, role-based access and automated patching frameworks. As bandwidth costs fall, even data-sensitive sectors pilot cloud sandboxes for non-personal content, signaling future share gains for hosted services.
Complete Report Scope:
- By Service Type
- Network Design and Installation
- Maintenance and Support
- Content Creation and Consulting
- Managed/Cloud Network Services
- Analytics and Reporting Services
- Other Specialized Services (Interactive and Touchless Integration)
- By Deployment Mode
- On-premise Managed
- Cloud/Hosted Managed
- By Location
- Indoor
- Outdoor
- Semi-Outdoor
- By End-User Vertical
- Retail and Wholesale
- Transportation and Logistics
- Hospitality and Leisure
- Healthcare
- Education
- Corporate and BFSI
- Government and Public Institutions
- Sports and Entertainment Venues
- Others
- By Display Format
- Video Walls
- Kiosks and Self-Service Terminals
- Menu Boards
- Digital Posters and Billboards
- Interactive Touch Screens
- Transparent and Holographic Displays
- By Geography
- North America
- United States
- Canada
- Mexico
- Europe
- Germany
- United Kingdom
- France
- Spain
- Rest of Europe
- South America
- Brazil
- Rest of South America
- Asia-Pacific
- China
- Japan
- India
- South-East Asia
- Rest of Asia-Pacific
- Middle East and Africa
- Middle East
- Gulf Cooperation Council Countries
- Turkey
- Rest of Middle East
- Africa
- South Africa
- Rest of Africa
- Middle East
- North America
Geography Analysis
North America kept 37.40% of 2025 revenue based on large-scale retail make-overs, nationwide transportation networks and early cloud adoption. Walmart's 2,300-store price label project and 7-Eleven's 8,400-display estate underline deal sizes that require multi-year managed-service contracts. Government stimulus for infrastructure upgraded bus and rail passenger information, further fuelling demand.
Asia-Pacific is the fastest-growing region at 6.95% CAGR to 2031. High urban growth, competitive retail markets and supportive SME digitalisation grants drive uptake. Subscription CMS solutions trim capex, fostering entry for local retailers and QSR chains. Strong panel manufacturing ecosystems in China and South Korea shorten supply cycles and lower hardware prices.
Europe advances steadily yet absorbs compliance overheads. Firms increased security budgets to satisfy the NIS 2 Directive. Energy-efficiency directives and city-level carbon targets encourage LED retrofits and life-cycle service agreements. EU recovery funds cushion SME adoption costs even as the Digital Signage Services industry navigates complex privacy regulations.
- STRATACACHE Inc.
- Samsung SDS Co., Ltd.
- LG Electronics Inc.
- Sharp NEC Display Solutions Ltd.
- Scala Enterprise (STRATACACHE)
- Four Winds Interactive LLC
- Mood Media Corp.
- Mvix Digital Signage
- Spectrio LLC
- BrightSign LLC
- Broadsign International Inc.
- Signagelive Ltd.
- Visix Inc.
- NoviSign Digital Signage
- Yodeck (Flipnode LLC)
- Enplug, Inc. (Spectrio)
- Nanonation Inc.
- Trison World
- ZetaDisplay AB
- Panasonic Connect Co., Ltd.
- eyefactive GmbH
Additional Benefits:
- The market estimate (ME) sheet in Excel format
- 3 months of analyst support
TABLE OF CONTENTS
1 INTRODUCTION
- 1.1 Study Assumptions and Market Definition
- 1.2 Scope of the Study
2 RESEARCH METHODOLOGY
3 EXECUTIVE SUMMARY
4 MARKET LANDSCAPE
- 4.1 Market Overview
- 4.2 Market Drivers
- 4.2.1 Retail Demand for Dynamic In-Store Messaging Accelerated by Real-Time Data Integration in North America
- 4.2.2 Transportation Hubs Modernize Passenger Communication Through Centralized Cloud-Managed Networks
- 4.2.3 Rapid Deployment of 4K/8K LED Walls Fueling Long-Term Maintenance Contracts
- 4.2.4 Subscription-Based CMS Adoption by SMBs in Asia-Pacific Reducing Up-Front Capex
- 4.2.5 Healthcare Way-Finding and Patient Engagement Screens Boost Service Outsourcing
- 4.2.6 Energy-Efficiency Mandates Driving LED Retrofits and Lifecycle Service Agreements
- 4.3 Market Restraints
- 4.3.1 High TCO for Multi-Site Networks in Emerging Economies
- 4.3.2 Content Refresh Fatigue Causing ROI Concerns for Small Retailers
- 4.3.3 Cyber-Security and Data-Privacy Compliance Costs in Europe
- 4.3.4 Margin Pressure from Low-Service System Integrator Price-Cutting
- 4.4 Industry Ecosystem Analysis
- 4.5 Porter's Five Forces Analysis
- 4.5.1 Threat of New Entrants
- 4.5.2 Bargaining Power of Buyers/Consumers
- 4.5.3 Bargaining Power of Suppliers
- 4.5.4 Threat of Substitute Products
- 4.5.5 Intensity of Competitive Rivalry
5 MARKET SIZE AND GROWTH FORECASTS (VALUES)
- 5.1 By Service Type
- 5.1.1 Network Design and Installation
- 5.1.2 Maintenance and Support
- 5.1.3 Content Creation and Consulting
- 5.1.4 Managed/Cloud Network Services
- 5.1.5 Analytics and Reporting Services
- 5.1.6 Other Specialized Services (Interactive and Touchless Integration)
- 5.2 By Deployment Mode
- 5.2.1 On-premise Managed
- 5.2.2 Cloud/Hosted Managed
- 5.3 By Location
- 5.3.1 Indoor
- 5.3.2 Outdoor
- 5.3.3 Semi-Outdoor
- 5.4 By End-User Vertical
- 5.4.1 Retail and Wholesale
- 5.4.2 Transportation and Logistics
- 5.4.3 Hospitality and Leisure
- 5.4.4 Healthcare
- 5.4.5 Education
- 5.4.6 Corporate and BFSI
- 5.4.7 Government and Public Institutions
- 5.4.8 Sports and Entertainment Venues
- 5.4.9 Others
- 5.5 By Display Format
- 5.5.1 Video Walls
- 5.5.2 Kiosks and Self-Service Terminals
- 5.5.3 Menu Boards
- 5.5.4 Digital Posters and Billboards
- 5.5.5 Interactive Touch Screens
- 5.5.6 Transparent and Holographic Displays
- 5.6 By Geography
- 5.6.1 North America
- 5.6.1.1 United States
- 5.6.1.2 Canada
- 5.6.1.3 Mexico
- 5.6.2 Europe
- 5.6.2.1 Germany
- 5.6.2.2 United Kingdom
- 5.6.2.3 France
- 5.6.2.4 Spain
- 5.6.2.5 Rest of Europe
- 5.6.3 South America
- 5.6.3.1 Brazil
- 5.6.3.2 Rest of South America
- 5.6.4 Asia-Pacific
- 5.6.4.1 China
- 5.6.4.2 Japan
- 5.6.4.3 India
- 5.6.4.4 South-East Asia
- 5.6.4.5 Rest of Asia-Pacific
- 5.6.5 Middle East and Africa
- 5.6.5.1 Middle East
- 5.6.5.1.1 Gulf Cooperation Council Countries
- 5.6.5.1.2 Turkey
- 5.6.5.1.3 Rest of Middle East
- 5.6.5.2 Africa
- 5.6.5.2.1 South Africa
- 5.6.5.2.2 Rest of Africa
- 5.6.5.1 Middle East
- 5.6.1 North America
6 COMPETITIVE LANDSCAPE
- 6.1 Market Concentration
- 6.2 Strategic Moves
- 6.3 Market Share Analysis
- 6.4 Company Profiles {(includes Global level Overview, Market level overview, Core Segments, Financials as available, Strategic Information, Market Rank/Share for key companies, Products and Services, and Recent Developments)}
- 6.4.1 STRATACACHE Inc.
- 6.4.2 Samsung SDS Co., Ltd.
- 6.4.3 LG Electronics Inc.
- 6.4.4 Sharp NEC Display Solutions Ltd.
- 6.4.5 Scala Enterprise (STRATACACHE)
- 6.4.6 Four Winds Interactive LLC
- 6.4.7 Mood Media Corp.
- 6.4.8 Mvix Digital Signage
- 6.4.9 Spectrio LLC
- 6.4.10 BrightSign LLC
- 6.4.11 Broadsign International Inc.
- 6.4.12 Signagelive Ltd.
- 6.4.13 Visix Inc.
- 6.4.14 NoviSign Digital Signage
- 6.4.15 Yodeck (Flipnode LLC)
- 6.4.16 Enplug, Inc. (Spectrio)
- 6.4.17 Nanonation Inc.
- 6.4.18 Trison World
- 6.4.19 ZetaDisplay AB
- 6.4.20 Panasonic Connect Co., Ltd.
- 6.4.21 eyefactive GmbH
7 MARKET OPPORTUNITIES AND FUTURE OUTLOOK
- 7.1 White-Space and Unmet-Need Assessment

 美國數位電子看板:市場佔有率分析、產業趨勢與統計及成長預測(2026-2031 年)越南數位電子看板市場:市場佔有率分析、產業趨勢與統計及成長預測(2026-2031)中東和非洲數位電子看板市場:市場佔有率分析、行業趨勢和統計數據以及成長預測(2026-2031 年)
 LED指示牌市場-全球市場預測(2026-2032年)數位電子看板:市場佔有率分析、產業趨勢與統計、成長預測(2026-2031)北美數位電子看板市場:市場佔有率分析、產業趨勢與統計及成長預測(2026-2031 年)數位電子看板市場:2026-2032年全球市場預測(按組件、顯示技術、內容類型、解析度、螢幕大小、連接方式、應用、安裝位置和部署模式分類)
 透明數位電子看板冷卻器市場規模、佔有率和成長分析:按產品類型、顯示技術、容量、應用、最終用戶、分銷管道和地區分類-2026-2033年產業預測
 智慧LED室內指示牌市場報告:螢幕大小、最終用戶和地區分類(2026-2034年)
 2026-2030年全球商用大尺寸顯示指示牌市場