


 |
市場調查報告書
商品編碼
2123663
美國數位電子看板:市場佔有率分析、產業趨勢與統計及成長預測(2026-2031 年)United States Digital Signage - Market Share Analysis, Industry Trends & Statistics, Growth Forecasts (2026 - 2031) |
||||||

※ 本網頁內容可能與最新版本有所差異。詳細情況請與我們聯繫。
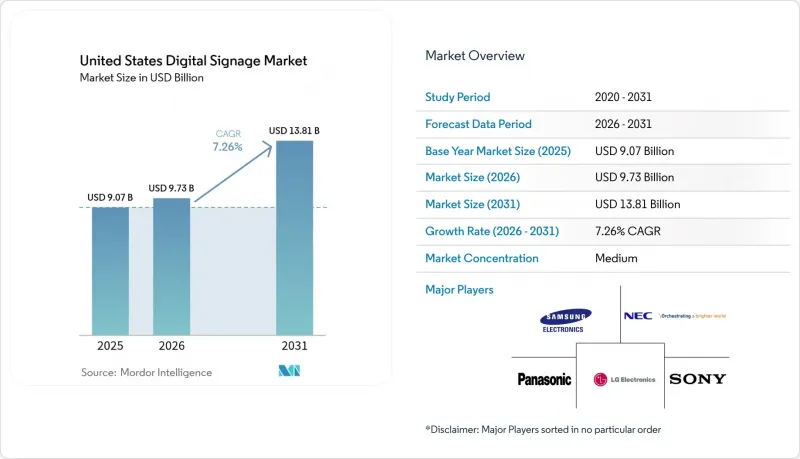
據 Mordor Intelligence 稱,2025 年美國數位電子看板市值為 90.7 億美元,預計到 2031 年將從 2026 年的 97.3 億美元成長至 138.1 億美元,預測期(2026-2031 年)的複合年成長率為 7.26%。
本報告按組件(硬體、軟體、服務)、顯示技術(LCD/LED、OLED、投影等)、螢幕大小(32 吋以下、32 吋至 52 吋、其他)、安裝位置(室內、室外)、最終用戶(零售、交通運輸、飯店和快餐店、銀行、金融服務和保險、教育、醫療保健、其他)以及其他中西部地區(東北部、美國分類)以及中西部地區。
美國數位電子看板市場趨勢與洞察
美國戶外數位廣告支出激增
數位戶外廣告(DOOH)程序化交易平台使廣告主能夠近乎即時地交易廣告曝光量,從而將可衡量性和歸因性提升到傳統靜態戶外媒體無法企及的水平。超過四分之三的受訪消費者表示,他們在看到DOOH訊息後採取了行動,這增強了廣告主對這種廣告形式的信心。電信公司正透過一系列引人注目的收購進入該領域,這表明全國性的光纖和5G網路不僅可以透過連接服務實現盈利,還可以透過廣告實現盈利。人工智慧產生的創新迭代縮短了宣傳活動投放時間,並允許根據當地天氣、交通狀況或受眾特徵自訂內容,從而進一步提高廣告支出回報率(ROAS)。聯網電視廣告購買也得到了類似的資料層支持,使得跨螢幕曝光頻率和覆蓋範圍管理成為常態,鞏固了DOOH作為全通路行銷關鍵支柱的地位。
零售業數位轉型的必要性
實體店在美國的購物活動中仍然佔據相當大的佔有率,連鎖店正在過道、貨架和收銀台附近佈置展示,以鼓勵顧客重複購買並與電商促銷活動保持一致。零售商正在重組門市,使庫存、客戶關係管理工具和視覺通訊都從共用的即時資料湖中獲取資訊。快餐店的數位菜單板、大型量販店的「無限貨架」自助服務終端以及雜貨店的電子貨架標籤都體現了「產品情境化、資訊化和交易化」的相同需求。南部和西部地區的早期部署表明,促銷商品的銷量有所成長,這加快了向其他地區推廣的預算批准。
與資料隱私和選擇加入相關的合規性挑戰
多個州已頒布類似於《加州消費者隱私法案》(CCPA) 的法規,要求設施運營方在收集或處理生物識別或行為數據之前必須獲得用戶的明確同意。目前,顯示器亮度受地方法規的監管。例如,費城規定白天最大亮度為 6500 尼特,夜間為 450 尼特,並強制要求自動調光控制。這些要求迫使整合商採用安全的資料管道、稽核日誌和「隱私設計」原則,從而增加了技術和法律成本。因此,全國性的廣告商必須調整宣傳活動以適應不同地區的不同標準,從而削弱了規模經濟效益。
細分市場分析
硬體部分在收入方面佔了64.15%的市場。業務收益預計將以8.12%的複合年成長率成長,這將重塑美國數位電子看板市場的價值創造結構。雖然硬體在2025年仍將佔收入的近三分之二,但買家越來越傾向於基於雲端的內容管理、網路監控和分析功能,這些功能可以將一次性資本支出轉化為可預測的營運成本。因此,許多製造商將顯示器、媒體播放機和現場維護服務捆綁到多年訂閱服務中。正如全國連鎖商店的實施案例所示,使用這些服務可以消除按需服務呼叫的需求,並自動更新數千個螢幕上的內容,從而降低整體擁有成本 (TCO)。
託管服務還包括創新開發、資料整合和宣傳活動最佳化。這些功能對那些沒有內部設計或IT資源的企業,以及希望最大化客戶參與的零售商、醫療保健機構和地方政府都極具吸引力。透過使用人工智慧工具分析客流模式和人口統計數據,服務合作夥伴可以部署情境感知播放列表,並增強宣傳活動的針對性。隨著服務模式的不斷擴展,預計美國數位電子看板市場將朝著更高的毛利率結構發展,並且能夠投資建設全國性支持網路的公司之間將出現進一步的整合。
儘管液晶顯示器(LCD)和直視型LED顯示器仍佔據70.96%的市場佔有率,但OLED顯示器9.74%的複合年成長率凸顯了市場向高階影像性能方向的明顯轉變。零售旗艦店、企業大廳和高階飯店都將OLED近乎無限的對比和超寬視角作為品牌差異化的重要手段。西部地區的幾家財富500強企業正在將其入口電視牆從LED面板更換為拼接式OLED面板,這表明OLED的市場佔有率正在不斷擴大。
此外,OLED的能源效率符合企業的永續發展計劃,這在有排放報告要求的地區至關重要。軟式電路板使建築師能夠將顯示器彎曲貼合柱子,或打造安裝在天花板上的帶狀顯示螢幕,從而開闢了剛性LCD無法實現的各種設計可能性。雖然投影目前仍主要應用於禮堂等小眾場所,但電子紙顯示器適用於陽光充足的環境和電池供電裝置。隨著OLED製造成本的持續下降,其應用範圍預計將不斷擴大,並且該技術預計將在美國數位電子看板市場佔據更有利的地位。
其他好處:
- Excel格式的市場預測(ME)表
- 3個月的分析師支持
目錄
第1章:引言
- 研究假設和市場定義
- 調查範圍
第2章:調查方法
第3章執行摘要
第4章 市場狀況
- 市場概覽
- 市場促進因素
- 美國戶外數位廣告支出激增
- 推動零售業數位轉型
- 承包“指示牌即服務”解決方案
- 情境感知和程序化廣告的成長
- 指示牌網路與智慧建築的融合
- 低功耗電子紙和反射式顯示器的普及
- 市場限制因素
- 與資料隱私和選擇加入相關的合規性挑戰
- 大型/互動式顯示器的高資本投入
- 中小企業內容管理的營運複雜性
- 更嚴格的城市法令,涉及戶外照明亮度及夜間照明規定。
- 產業生態系分析
- 技術展望
- 波特五力分析
第5章 市場規模與成長預測
- 按組件
- 硬體
- LCD/LED顯示器
- OLED顯示器
- 媒體播放機
- 投影機和投影儀
- 其他硬體
- 軟體
- 服務
- 硬體
- 顯示技術
- LCD/LED
- OLED
- 投影
- 電子紙和反射紙
- 按螢幕尺寸
- 小於 32 英寸
- 32英寸至52英寸
- 超過 52 英寸
- 按安裝位置
- 室內的
- 戶外的
- 最終用戶
- 零售
- 運輸
- 飯店和快餐
- BFSI
- 教育
- 政府和公共機構
- 衛生保健
- 公司及商業辦公室
- 娛樂和體育設施
- 按地區
- 東北
- 中西部
- 南
- 西方
第6章 競爭情勢
- 市場集中度
- 策略趨勢
- 市佔率分析
- 公司簡介
- Samsung Electronics Co., Ltd.
- LG Display Co., Ltd.
- NEC Corporation
- Stratacache, Inc.
- Daktronics, Inc.
- Sony Group Corporation
- Panasonic Holdings Corporation
- Sharp NEC Display Solutions of America, Inc.
- Christie Digital Systems USA, Inc.
- Barco NV
- Planar Systems, Inc.
- BrightSign LLC
- Four Winds Interactive LLC
- Broadsign International, LLC
- Navori Labs SA
- Cisco Systems, Inc.
- Goodview Electronics Co., Ltd.
- Toshiba America Business Solutions, Inc.
- Peerless-AV(Peerless Industries, Inc.)
- Watchfire Signs, LLC
- Rise Vision, Inc.
第7章 市場機會與未來展望
According to Mordor Intelligence, the United States digital signage market size was valued at USD 9.07 billion in 2025 and estimated to grow from USD 9.73 billion in 2026 to reach USD 13.81 billion by 2031, at a CAGR of 7.26% during the forecast period (2026-2031).
This report is Segmented by Component (Hardware, Software and Services), Display Technology (LCD/LED, OLED, Projections, and More), Screen Size (Less Than 32-Inch, 32-Inch - 52-Inch, and More), Installation Location (Indoor, and Outdoor), End User (Retail, Transportation, Hospitality and QSR, BFSI, Education, Healthcare, and More) and Geography (Northeast, Midwest, South, and West).
United States Digital Signage Market Trends and Insights
Surge in United States DOOH Ad-Spend
DOOH programmatic exchanges now allow advertisers to trade impressions almost in real time, elevating measurability and attribution in ways previously unattainable in static outdoor media. More than three-quarters of surveyed consumers reported taking action after seeing a DOOH message, reinforcing advertiser confidence in the format. Telecommunications operators have entered the space through high-profile acquisitions, a signal that nationwide fiber and 5G networks can be monetized through advertising as well as connectivity. AI-generated creative iterations cut campaign setup times and allow content to adjust to local weather, traffic, or audience demographics, which further boosts return on ad spend. Because the same data layers power connected-TV buying, cross-screen frequency and reach management are becoming routine, solidifying DOOH as a critical pillar in omnichannel marketing.
Retail Digital-Transformation Mandates
Brick-and-mortar still captures the majority of U.S. shopping activity, prompting chains to embed displays into aisles, shelves, and checkout zones to encourage incremental purchases and to synchronize with e-commerce promotions. Retailers are re-architecting stores so that inventory, customer-relationship tools, and visual messaging all draw from a shared real-time data lake. Digital menu boards in quick-service restaurants, endless-aisle kiosks in big-box stores, and electronic shelf labels in grocery stores are visible manifestations of the same imperative: curate, inform, and transact in context. Early deployments in the South and West demonstrate revenue uplifts on promoted SKUs, which are accelerating budget approvals for rollouts across other regions.
Data-Privacy and Opt-In Compliance Hurdles
Multiple states have enacted statutes that parallel the California Consumer Privacy Act, compelling venue operators to obtain explicit consent before capturing or processing biometric and behavioral data. Municipal codes now regulate display luminance - for instance, Philadelphia limits maximum brightness to 6,500 nits by day and 450 nits at night while mandating automated dimming controls. Such requirements force integrators to embed secure data pipelines, audit logs, and privacy-by-design principles, adding both engineering and legal costs. National advertisers must subsequently tailor campaigns for a patchwork of local standards, dampening scale economies.
Other drivers and restraints analyzed in the detailed report include:
- Turnkey Signage-as-a-Service Offerings
- Context-Aware and Programmatic Advertising Growth
- High Capex for Large-Format/Interactive Displays
For complete list of drivers and restraints, kindly check the Table Of Contents.
Segment Analysis
The hardware segment accounts for 64.15% of the revenue market share. Services revenue is forecast to grow at an 8.12% CAGR, reshaping value capture inside the United States digital signage market. Although hardware generated almost two-thirds of 2025 revenue, buyers increasingly favor cloud-based content management, network monitoring, and analytics that convert one-time capital expense into predictable operating expense. Many manufacturers, therefore, bundle displays, media players, and field maintenance under multi-year subscriptions. National chain rollouts illustrate that services lower the total cost of ownership by eliminating ad-hoc truck rolls and by automating content updates across thousands of screens.
Managed services also encompass creative development, data integration, and campaign optimization. These capabilities appeal to retailers, healthcare providers, and municipalities lacking in-house design or IT resources yet seeking to maximize engagement. With AI tools detecting traffic patterns and demographics, service partners can deploy context-specific playlists that improve campaign relevance. Continued migration toward services is expected to nudge the United States digital signage market toward higher gross margin profiles, reinforcing consolidation among firms able to fund nationwide support networks.
LCD and direct-view LED continue to account for 70.96% of revenue, yet OLED's 9.74% CAGR underscores a discernible shift toward premium visual performance. Retail flagships, corporate lobbies, and high-end hospitality venues cite OLED's near-infinite contrast and ultra-wide viewing angles as brand differentiation levers. Several Fortune 500 campuses in the West region have migrated entrance lobby video walls from LED to tiled OLED canvases, evidencing wallet share gains.
OLED's energy efficiency also dovetails with corporate sustainability programs, a factor that carries weight in jurisdictions employing emissions reporting. Flexible substrates allow architects to curve displays around pillars or create ceiling-mounted ribbons, unlocking design possibilities unattainable with rigid LCD. Projection remains a niche for auditoriums, while e-paper addresses sun-facing or battery-powered assets. Continued cost declines in OLED manufacturing are anticipated to expand addressable applications, giving the technology a growing footprint within the United States digital signage market.
Complete Report Scope:
- By Component
- Hardware
- LCD/LED Displays
- OLED Displays
- Media Players
- Projection Screens and Projectors
- Other Hardware
- Software
- Services
- Hardware
- By Display Technology
- LCD/LED
- OLED
- Projection
- e-Paper and Reflective
- By Screen Size
- Less than 32-inch
- 32-inch to 52-inch
- Greater than 52-inch
- By Installation Location
- Indoor
- Outdoor
- By End User
- Retail
- Transportation
- Hospitality and QSR
- BFSI
- Education
- Government and Public Institutions
- Healthcare
- Corporate and Commercial Offices
- Entertainment and Sports Venues
- By Geography
- Northeast
- Midwest
- South
- West
List of Companies Covered in this Report:
- Samsung Electronics Co., Ltd.
- LG Display Co., Ltd.
- NEC Corporation
- Stratacache, Inc.
- Daktronics, Inc.
- Sony Group Corporation
- Panasonic Holdings Corporation
- Sharp NEC Display Solutions of America, Inc.
- Christie Digital Systems USA, Inc.
- Barco NV
- Planar Systems, Inc.
- BrightSign LLC
- Four Winds Interactive LLC
- Broadsign International, LLC
- Navori Labs SA
- Cisco Systems, Inc.
- Goodview Electronics Co., Ltd.
- Toshiba America Business Solutions, Inc.
- Peerless-AV (Peerless Industries, Inc.)
- Watchfire Signs, LLC
- Rise Vision, Inc.
Additional Benefits:
- The market estimate (ME) sheet in Excel format
- 3 months of analyst support
TABLE OF CONTENTS
1 INTRODUCTION
- 1.1 Study Assumptions and Market Definition
- 1.2 Scope of the Study
2 RESEARCH METHODOLOGY
3 EXECUTIVE SUMMARY
4 MARKET LANDSCAPE
- 4.1 Market Overview
- 4.2 Market Drivers
- 4.2.1 Surge in United States DOOH ad-spend
- 4.2.2 Retail digital-transformation mandates
- 4.2.3 Turnkey signage-as-a-service offerings
- 4.2.4 Context-aware and programmatic advertising growth
- 4.2.5 Smart-building integration with signage networks
- 4.2.6 Low-power e-paper and reflective displays adoption
- 4.3 Market Restraints
- 4.3.1 Data-privacy and opt-in compliance hurdles
- 4.3.2 High capex for large-format/interactive displays
- 4.3.3 Operational complexity for SME content management
- 4.3.4 Stricter city ordinances on outdoor brightness/curfews
- 4.4 Industry Ecosystem Analysis
- 4.5 Technological Outlook
- 4.6 Porter's Five Forces Analysis
- 4.6.1 Bargaining Power of Suppliers
- 4.6.2 Bargaining Power of Buyers
- 4.6.3 Threat of New Entrants
- 4.6.4 Threat of Substitutes
- 4.6.5 Intensity of Competitive Rivalry
5 MARKET SIZE AND GROWTH FORECASTS (VALUES)
- 5.1 By Component
- 5.1.1 Hardware
- 5.1.1.1 LCD/LED Displays
- 5.1.1.2 OLED Displays
- 5.1.1.3 Media Players
- 5.1.1.4 Projection Screens and Projectors
- 5.1.1.5 Other Hardware
- 5.1.2 Software
- 5.1.3 Services
- 5.1.1 Hardware
- 5.2 By Display Technology
- 5.2.1 LCD/LED
- 5.2.2 OLED
- 5.2.3 Projection
- 5.2.4 e-Paper and Reflective
- 5.3 By Screen Size
- 5.3.1 Less than 32-inch
- 5.3.2 32-inch to 52-inch
- 5.3.3 Greater than 52-inch
- 5.4 By Installation Location
- 5.4.1 Indoor
- 5.4.2 Outdoor
- 5.5 By End User
- 5.5.1 Retail
- 5.5.2 Transportation
- 5.5.3 Hospitality and QSR
- 5.5.4 BFSI
- 5.5.5 Education
- 5.5.6 Government and Public Institutions
- 5.5.7 Healthcare
- 5.5.8 Corporate and Commercial Offices
- 5.5.9 Entertainment and Sports Venues
- 5.6 By Geography
- 5.6.1 Northeast
- 5.6.2 Midwest
- 5.6.3 South
- 5.6.4 West
6 COMPETITIVE LANDSCAPE
- 6.1 Market Concentration
- 6.2 Strategic Moves
- 6.3 Market Share Analysis
- 6.4 Company Profiles (includes Global level Overview, Market level overview, Core Segments, Financials as available, Strategic Information, Market Rank/Share, Products and Services, Recent Developments)
- 6.4.1 Samsung Electronics Co., Ltd.
- 6.4.2 LG Display Co., Ltd.
- 6.4.3 NEC Corporation
- 6.4.4 Stratacache, Inc.
- 6.4.5 Daktronics, Inc.
- 6.4.6 Sony Group Corporation
- 6.4.7 Panasonic Holdings Corporation
- 6.4.8 Sharp NEC Display Solutions of America, Inc.
- 6.4.9 Christie Digital Systems USA, Inc.
- 6.4.10 Barco NV
- 6.4.11 Planar Systems, Inc.
- 6.4.12 BrightSign LLC
- 6.4.13 Four Winds Interactive LLC
- 6.4.14 Broadsign International, LLC
- 6.4.15 Navori Labs SA
- 6.4.16 Cisco Systems, Inc.
- 6.4.17 Goodview Electronics Co., Ltd.
- 6.4.18 Toshiba America Business Solutions, Inc.
- 6.4.19 Peerless-AV (Peerless Industries, Inc.)
- 6.4.20 Watchfire Signs, LLC
- 6.4.21 Rise Vision, Inc.
7 MARKET OPPORTUNITIES AND FUTURE OUTLOOK
- 7.1 White-space and Unmet-need Assessment

 越南數位電子看板市場:市場佔有率分析、產業趨勢與統計及成長預測(2026-2031)中東和非洲數位電子看板市場:市場佔有率分析、行業趨勢和統計數據以及成長預測(2026-2031 年)
 LED指示牌市場-全球市場預測(2026-2032年)數位電子看板:市場佔有率分析、產業趨勢與統計、成長預測(2026-2031)北美數位電子看板市場:市場佔有率分析、產業趨勢與統計及成長預測(2026-2031 年)數位電子看板市場:2026-2032年全球市場預測(按組件、顯示技術、內容類型、解析度、螢幕大小、連接方式、應用、安裝位置和部署模式分類)數位電子看板服務:市場佔有率分析、產業趨勢與統計、成長預測(2026-2031)
 透明數位電子看板冷卻器市場規模、佔有率和成長分析:按產品類型、顯示技術、容量、應用、最終用戶、分銷管道和地區分類-2026-2033年產業預測
 智慧LED室內指示牌市場報告:螢幕大小、最終用戶和地區分類(2026-2034年)
 2026-2030年全球商用大尺寸顯示指示牌市場