


 |
市場調查報告書
商品編碼
2113375
北美數位電子看板市場:市場佔有率分析、產業趨勢與統計及成長預測(2026-2031 年)North America Digital Signage - Market Share Analysis, Industry Trends & Statistics, Growth Forecasts (2026 - 2031) |
||||||

※ 本網頁內容可能與最新版本有所差異。詳細情況請與我們聯繫。
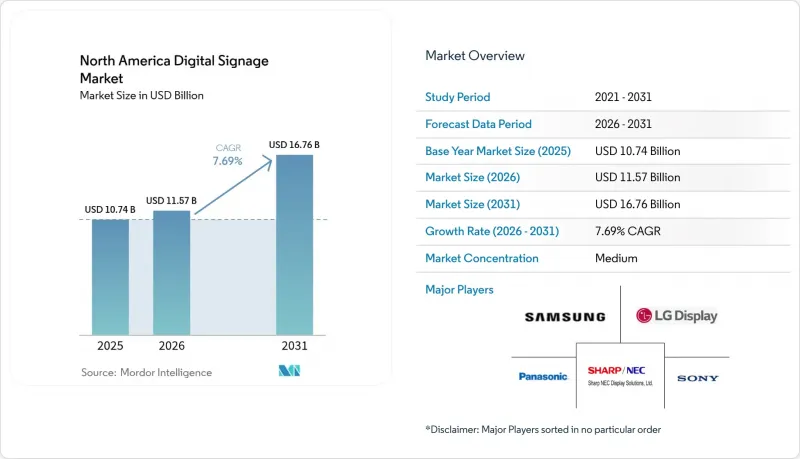
據 Mordor Intelligence 稱,2025 年北美數位電子看板市值為 107.4 億美元,預計到 2031 年將從 2026 年的 115.7 億美元成長至 167.6 億美元,預測期(2026-2031 年)複合年成長率為 7.69%。
本報告按組件(硬體、軟體、服務)、安裝位置(室內、室外)、顯示器尺寸(32吋以下、32-52吋、52吋以上)、安裝位置(店內、店外)、終端用戶產業(零售、運輸等)、硬體(LCD/LED顯示器等)及國家/地區進行細分。市場預測以美元(USD)計價。
北美數位電子看板市場趨勢與洞察
承包解決方案的演進正在加速其在美國零售連鎖店的應用。
自 2023 年以來,整合了螢幕、媒體播放機、軟體、內容模板和遠端監控的捆綁式服務已將全國部署時間縮短了 37%。零售集團目前正在數百家門市實現體驗標準化,同時根據當地庫存水準和情況最佳化促銷活動。基於訂閱的收費系統(而非前期投資)正在推動數位電子看板的普及,60% 的公司計劃在未來兩年內實施該技術。採用此模式的連鎖店的顧客互動率提高了 22%,平均購買金額提高了 18%,這表明數位電子看板已從成本中心轉變為收入來源。
利用行動數據的情境感知廣告正在提高加拿大廣告商的投資報酬率。
匿名化的行動電話訊號如今使內容發布者能夠反映即時受眾估計值。加拿大的先導計畫顯示,與傳統的戶外廣告投放相比,投資報酬率提高了 41%,零售環境中的互動率提高了 27%,轉換率提高了 19%。透過利用地理圍欄技術,品牌可以重新定位那些使用智慧型手機看到廣告的路人,將店內曝光與後續的線上互動聯繫起來,而無需儲存個人識別資訊。
關於基於位置的定向和臉部分析的隱私問題。
美國各州的法律以及加拿大的「數位憲章」正在收緊對用戶同意的監管,迫使供應商從臉部辨識轉向匿名人口統計數據的聚合。一項調查發現,68%的加拿大年輕人反對將臉部分析用於商業用途,迫使零售商權衡聲譽風險與個人化帶來的益處。
細分市場分析
預計到2025年,硬體將佔據北美數位電子看板市場56.35%的佔有率,這主要得益於資本密集螢幕和媒體播放機的開發。儘管硬體佔據主導地位,但軟體領域正以8.73%的複合年成長率快速成長,這主要得益於雲端控制面板、人工智慧調度引擎和受眾分析等技術的進步,因為買家的興趣正從「一次性部署」轉向「終身價值」。訂閱套餐目前佔平台收入的43%,這使得供應商的獎勵與持續的內容最佳化一致。硬體製造商擴大預先安裝許可證和託管服務,從而簡化採購流程,並使零售商擺脫管理多個供應商的負擔。
隨著終端用戶缺乏內部資源來更新覆蓋龐大設施的宣傳活動,涵蓋規劃、佈線、校準、現場維護和創新設計的服務領域正在穩步擴展。網路整合商負責端到端網路管理,他們不僅能夠獲得多年期契約,確保可預測的年度收入,還能將故障率控制在服務等級基準值以下。現代媒體播放機內建的邊緣人工智慧功能可以降低頻寬成本,並支援本地決策,例如在非高峰時段靜音音訊或標記故障 LED 以便進行主動維修。
到2025年,室內場所將佔北美數位電子看板市場67.65%的佔有率,這得益於溫控環境以及現有的電力和數據基礎設施。室內螢幕正被廣泛應用於企業總部、大學和購物中心走廊,用於訪客引導、促銷提升銷售和員工通知。為了緩解使用者的內容疲勞,營運商正在整合觸控、手勢和QR碼互動,將線上和線下體驗整合到一個統一的互動流程中。
戶外網路佔總銷售額的32.35%,正以9.08%的複合年成長率快速成長,超過整體市場成長速度,這得益於其耐用的機殼、自動調光功能和自清潔玻璃處理技術。在智慧城市試點計畫中,公共Wi-Fi、環境感測器和緊急警報功能正在被應用,這為市政預算撥款提供了依據。同時,太陽能圖騰柱正在為電力供應有限的地區提供動態資訊。遠距離診斷軟體的進步顯著降低了現場維修成本,並延長了正常運行時間的服務等級協定(SLA)運作。
其他好處:
- Excel格式的市場預測(ME)表
- 3個月的分析師支持
目錄
第1章:引言
- 研究假設和市場定義
- 調查範圍
第2章:調查方法
第3章執行摘要
第4章 市場狀況
- 市場概覽
- 市場促進因素
- 承包解決方案的演進正在加速其在美國零售連鎖店的應用。
- 利用行動數據的情境感知廣告可提高加拿大廣告商的投資報酬率。
- 4K/8K電視牆的引進正在重振美國各大機場的體驗設施。
- 一項旨在促進墨西哥都市區引入戶外數位電子看板的智慧城市計劃。
- LCD面板價格的下降導致北美各地的中小型企業擴大採用這種面板。
- 程式化戶外數位廣告平台正在提升廣告主的廣告支出和螢幕運轉率。
- 市場限制因素
- 關於基於位置的定向和臉部認證分析的隱私問題
- 加強大型顯示器能源效率法規
- 高亮度LED組件的供應鏈波動
- 區域內獨立速食連鎖店資本投資的障礙
- 產業生態系分析
- 分銷通路分析
- 監管情勢-資料隱私和環境標籤標準
- 技術概述
- 美國數位電子看板解決方案的發展歷程
- 關鍵技術趨勢—電視牆、4K、POS系統以及與社群媒體的整合
- 波特五力分析
第5章 市場規模與成長預測
- 按組件
- 硬體
- 軟體
- 服務
- 按位置
- 室內的
- 戶外的
- 按顯示尺寸
- 小於 32 英寸
- 32-52英寸
- 52吋或更大
- 按安裝位置
- 店內
- 商店外/沿路
- 按最終用戶行業分類
- 零售
- 運輸
- 飯店業
- 公司
- 教育
- 衛生保健
- 政府
- 體育和娛樂設施
- 其他終端用戶產業
- 依硬體類型
- LCD/LED顯示器
- OLED顯示器
- 媒體播放機
- 投影機/投影幕
- 透明LED顯示器
- 其他硬體類型
- 國家
- 美國
- 加拿大
- 墨西哥
第6章 競爭情勢
- 市場集中度
- 策略趨勢
- 市佔率分析
- 公司簡介
- Samsung Electronics Co., Ltd.
- LG Display Co., Ltd.
- SHARP NEC Display Solutions, Ltd.
- Sony Group Corporation
- Panasonic Corporation
- Cisco Systems, Inc.
- Planar Systems, Inc.(Leyard)
- Barco NV
- Daktronics, Inc.
- BrightSign LLC
- STRATACACHE Inc.(Scala)
- Broadsign International, LLC
- Christie Digital Systems USA, Inc.
- AOPEN Inc.
- Goodview Electronics
- Hitachi, Ltd.
- Peerless-AV
- Elo Touch Solutions, Inc.
- Mvix Digital Signage
- Four Winds Interactive
第7章 市場機會與未來展望
According to Mordor Intelligence, the North America digital signage market size was valued at USD 10.74 billion in 2025 and estimated to grow from USD 11.57 billion in 2026 to reach USD 16.76 billion by 2031, at a CAGR of 7.69% during the forecast period (2026-2031).
This report is Segmented by Component (Hardware, Software, and Services), Location (Indoor, and Outdoor), Display Size (Below 32 Inches, 32 - 52 Inches, and Above 52 Inches), Installation Location (In-Store, and Out-Of-Store), End-User Vertical (Retail, Transportation, and More), Hardware (LCD/LED Display, and More), and Country. The Market Forecasts are Provided in Terms of Value in (USD).
North America Digital Signage Market Trends and Insights
Evolution of Turnkey Solutions Accelerating Deployment Across U.S. Retail Chains
Bundled offerings that combine screens, media players, software, content templates, and remote monitoring have reduced national rollouts by 37% since 2023. Retail groups now standardize experiences across hundreds of stores while tailoring promotions to local inventory levels and conditions. Subscription pricing, rather than capital outlay, encourages the adoption of digital signage among 60% of enterprises that intend to subscribe within two years. Chains adopting this model report 22% higher engagement and an 18% increase in average basket value, confirming the pivot from a cost center to a revenue driver.
Context-Aware Advertising Leveraging Mobile Data Enhances ROI for Canadian Advertisers
Anonymized cellphone signals now feed real-time audience estimates into content schedulers. Canadian pilots show ROI gains of 41% over traditional out-of-home buying, plus 27% higher engagement and 19% conversion lifts in retail settings. Geofencing lets brands retarget exposed passers-by on their phones, knitting together physical impressions and digital follow-ups without storing personal identifiers.
Privacy Concerns Regarding Location-Based Targeting and Facial Analytics
State-level U.S. bills and Canada's Digital Charter are tightening consent rules, forcing vendors to shift from face recognition to anonymous demographic counts. Surveys indicate 68% of Canadian youth oppose facial analysis in commerce, prompting retailers to weigh reputational risk against personalization benefits.
Other drivers and restraints analyzed in the detailed report include:
- Integration of 4K/8K Video Walls Powers Experiential Venues in Major U.S. Airports
- Smart-City Initiatives Driving Outdoor Digital Signage Roll-outs in Mexican Urban Centers
- Rising Energy-Efficiency Regulations for Large-Format Displays
For complete list of drivers and restraints, kindly check the Table Of Contents.
Segment Analysis
Hardware captured 56.35% of the North America digital signage market share in 2025, anchored by capital-intensive screens and media players. Despite this lead, the software slice is advancing at an 8.73% CAGR as cloud dashboards, AI scheduling engines, and audience analytics shift buyer focus from one-time installs to lifetime value. Subscription bundles now comprise 43% of platform revenue, aligning vendor incentives with continuous content optimisation. Hardware makers are increasingly pre-loading licenses and managed services, creating a seamless procurement process and freeing retailers from the need to juggle multiple suppliers.
The services tier-covering planning, cabling, calibration, on-site maintenance, and creative design-expands steadily because end-users lack in-house bandwidth to refresh campaigns across sprawling estates. Integrators that manage networks end-to-end win multi-year contracts, locking in predictable annuities while keeping failure rates below service-level thresholds. Edge-AI features embedded in modern media players reduce bandwidth costs and enable localised decisions-such as muting audio during quiet hours or flagging malfunctioning LEDs for proactive repairs.
Indoor venues held 67.65% of North America digital signage market size in 2025, buoyed by climate-controlled conditions and existing power/data infrastructure. Corporate headquarters, colleges and mall walkways rely on indoor screens for visitor orientation, promotional upsells and employee notices. In response to content fatigue, operators layer touch, gesture or QR interactions, merging in-person and mobile experiences into a single engagement funnel.
Outdoor networks, representing 32.35% of revenue but outpacing overall growth at 9.08% CAGR, benefit from durable casings, auto-dimming and self-cleaning glass treatments. Smart-city pilots add public Wi-Fi, environmental sensors and emergency alerts to justify municipal budgets, while solar-powered totems bring dynamic information to energy-constrained locales. The evolution of remote-diagnostic software slashes truck-roll expenses and lengthens uptime SLAs.
Complete Report Scope:
- By Component
- Hardware
- Software
- Services
- By Location
- Indoor
- Outdoor
- By Display Size
- Below 32 Inches
- 32 - 52 Inches
- Above 52 Inches
- By Installation Location
- In-Store
- Out-of-Store/Roadside
- By End-user Vertical
- Retail
- Transportation
- Hospitality
- Corporate
- Education
- Healthcare
- Government
- Sports and Entertainment Venues
- Other End-user Verticals
- By Hardware Type
- LCD/LED Display
- OLED Display
- Media Players
- Projectors/Projection Screens
- Transparent LED Displays
- Other Hardware Types
- By Country
- United States
- Canada
- Mexico
List of Companies Covered in this Report:
- Samsung Electronics Co., Ltd.
- LG Display Co., Ltd.
- SHARP NEC Display Solutions, Ltd.
- Sony Group Corporation
- Panasonic Corporation
- Cisco Systems, Inc.
- Planar Systems, Inc. (Leyard)
- Barco NV
- Daktronics, Inc.
- BrightSign LLC
- STRATACACHE Inc. (Scala)
- Broadsign International, LLC
- Christie Digital Systems USA, Inc.
- AOPEN Inc.
- Goodview Electronics
- Hitachi, Ltd.
- Peerless-AV
- Elo Touch Solutions, Inc.
- Mvix Digital Signage
- Four Winds Interactive
Additional Benefits:
- The market estimate (ME) sheet in Excel format
- 3 months of analyst support
TABLE OF CONTENTS
1 INTRODUCTION
- 1.1 Study Assumptions and Market Definition
- 1.2 Scope of the Study
2 RESEARCH METHODOLOGY
3 EXECUTIVE SUMMARY
4 MARKET LANDSCAPE
- 4.1 Market Overview
- 4.2 Market Drivers
- 4.2.1 Evolution of Turnkey Solutions Accelerating Deployment Across United States Retail Chains
- 4.2.2 Context-Aware Advertising Leveraging Mobile Data Enhances ROI for Canadian Advertisers
- 4.2.3 Integration of 4K/8K Video Walls Powers Experiential Venues in Major United States Airports
- 4.2.4 Smart-City Initiatives Driving Outdoor Digital Signage Roll-outs in Mexican Urban Centers
- 4.2.5 Decline in LCD Panel Prices Expands Adoption Among SMBs Across North America
- 4.2.6 Programmatic DOOH Platforms Increasing Advertiser Spend and Screen Utilisation
- 4.3 Market Restraints
- 4.3.1 Privacy Concerns Regarding Location-Based Targeting and Facial Analytics
- 4.3.2 Rising Energy-Efficiency Regulations for Large-Format Displays
- 4.3.3 Supply-Chain Volatility for High-Brightness LED Components
- 4.3.4 Capex Barriers for Independent QSRs in Rural Areas
- 4.4 Industry Ecosystem Analysis
- 4.5 Distribution Channel Analysis
- 4.6 Regulatory Landscape - Data-Privacy and Environmental Display Standards
- 4.7 Technology Snapshot
- 4.7.1 Evolution of Digital Signage Solutions in the United States
- 4.7.2 Key Technological Trends - Video Walls, 4K/8K, POS and Social Media Integration
- 4.8 Porter's Five Forces Analysis
- 4.8.1 Threat of New Entrants
- 4.8.2 Bargaining Power of Buyers
- 4.8.3 Bargaining Power of Suppliers
- 4.8.4 Threat of Substitutes
- 4.8.5 Intensity of Competitive Rivalry
5 MARKET SIZE AND GROWTH FORECASTS (VALUES)
- 5.1 By Component
- 5.1.1 Hardware
- 5.1.2 Software
- 5.1.3 Services
- 5.2 By Location
- 5.2.1 Indoor
- 5.2.2 Outdoor
- 5.3 By Display Size
- 5.3.1 Below 32 Inches
- 5.3.2 32 - 52 Inches
- 5.3.3 Above 52 Inches
- 5.4 By Installation Location
- 5.4.1 In-Store
- 5.4.2 Out-of-Store/Roadside
- 5.5 By End-user Vertical
- 5.5.1 Retail
- 5.5.2 Transportation
- 5.5.3 Hospitality
- 5.5.4 Corporate
- 5.5.5 Education
- 5.5.6 Healthcare
- 5.5.7 Government
- 5.5.8 Sports and Entertainment Venues
- 5.5.9 Other End-user Verticals
- 5.6 By Hardware Type
- 5.6.1 LCD/LED Display
- 5.6.2 OLED Display
- 5.6.3 Media Players
- 5.6.4 Projectors/Projection Screens
- 5.6.5 Transparent LED Displays
- 5.6.6 Other Hardware Types
- 5.7 By Country
- 5.7.1 United States
- 5.7.2 Canada
- 5.7.3 Mexico
6 COMPETITIVE LANDSCAPE
- 6.1 Market Concentration
- 6.2 Strategic Moves
- 6.3 Market Share Analysis
- 6.4 Company Profiles (includes Global level Overview, Market level overview, Core Segments, Financials as available, Strategic Information, Market Rank/Share for key companies, Products and Services, and Recent Developments)
- 6.4.1 Samsung Electronics Co., Ltd.
- 6.4.2 LG Display Co., Ltd.
- 6.4.3 SHARP NEC Display Solutions, Ltd.
- 6.4.4 Sony Group Corporation
- 6.4.5 Panasonic Corporation
- 6.4.6 Cisco Systems, Inc.
- 6.4.7 Planar Systems, Inc. (Leyard)
- 6.4.8 Barco NV
- 6.4.9 Daktronics, Inc.
- 6.4.10 BrightSign LLC
- 6.4.11 STRATACACHE Inc. (Scala)
- 6.4.12 Broadsign International, LLC
- 6.4.13 Christie Digital Systems USA, Inc.
- 6.4.14 AOPEN Inc.
- 6.4.15 Goodview Electronics
- 6.4.16 Hitachi, Ltd.
- 6.4.17 Peerless-AV
- 6.4.18 Elo Touch Solutions, Inc.
- 6.4.19 Mvix Digital Signage
- 6.4.20 Four Winds Interactive
7 MARKET OPPORTUNITIES AND FUTURE OUTLOOK
- 7.1 White-space and Unmet-Need Assessment

 美國數位電子看板:市場佔有率分析、產業趨勢與統計及成長預測(2026-2031 年)越南數位電子看板市場:市場佔有率分析、產業趨勢與統計及成長預測(2026-2031)中東和非洲數位電子看板市場:市場佔有率分析、行業趨勢和統計數據以及成長預測(2026-2031 年)
 LED指示牌市場-全球市場預測(2026-2032年)數位電子看板:市場佔有率分析、產業趨勢與統計、成長預測(2026-2031)數位電子看板市場:2026-2032年全球市場預測(按組件、顯示技術、內容類型、解析度、螢幕大小、連接方式、應用、安裝位置和部署模式分類)數位電子看板服務:市場佔有率分析、產業趨勢與統計、成長預測(2026-2031)
 透明數位電子看板冷卻器市場規模、佔有率和成長分析:按產品類型、顯示技術、容量、應用、最終用戶、分銷管道和地區分類-2026-2033年產業預測
 智慧LED室內指示牌市場報告:螢幕大小、最終用戶和地區分類(2026-2034年)
 2026-2030年全球商用大尺寸顯示指示牌市場