


 |
市場調查報告書
商品編碼
2120844
數位電子看板:市場佔有率分析、產業趨勢與統計、成長預測(2026-2031)Digital Signage - Market Share Analysis, Industry Trends & Statistics, Growth Forecasts (2026 - 2031) |
||||||

※ 本網頁內容可能與最新版本有所差異。詳細情況請與我們聯繫。
根據 Mordor Intelligence 估計,數位電子看板市場在 2026 年的價值將達到 299.5 億美元,高於 2025 年的 276.6 億美元,預計到 2031 年將達到 446 億美元。
預計從 2026 年到 2031 年,其複合年成長率將達到 8.28%。
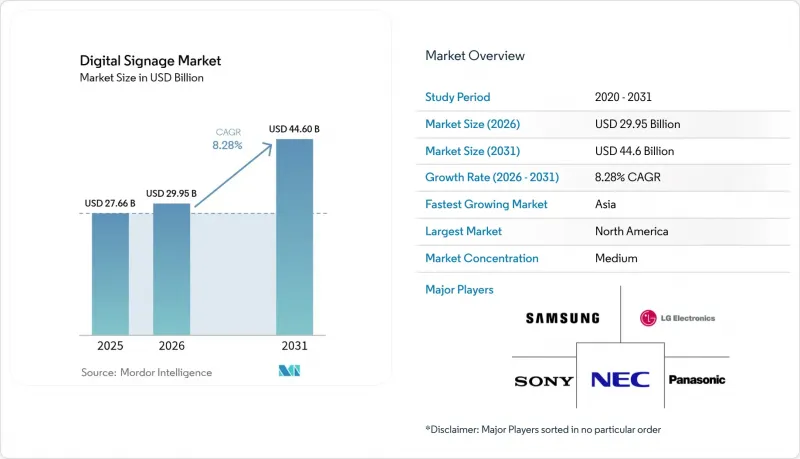
本報告按類型(電視牆、視訊螢幕、自助服務終端等)、組件(硬體、軟體、服務)、部署模式(本地部署、雲端部署、混合式部署)、螢幕大小(32吋以下、32-52吋、其他)、安裝位置(店內/室內、室外)、最終用戶行業(零售、交通運輸、酒店、企業、其他)和地區進行細分。市場預測以美元計價。
全球數位電子看板市場趨勢與洞察
人工智慧驅動的受眾分析有助於實現動態內容的個人化。
零售商如今正用人工智慧引擎取代千篇一律的循環播放,這些引擎能夠根據消費者的接近即時客製化訊息。電腦視覺模組可以測量顧客的年齡、性別和觀看時長,並展示創新的廣告變體,從而將轉換率提升高達 30%。美國、英國、德國和法國的連鎖商店正在將這些洞察與會員應用程式的數據相結合,以增強全通路宣傳活動。廣告公司願意為這種高度精準的曝光支付高額的 CPM,從而將門市網路轉變為高利潤的媒體管道。雖然 GDPR 合規性正在影響歐洲的普及速度,但供應商正在採用「隱私設計」工作流程,在分析之前對影片幀進行本地匿名化處理。這些因素正在推動數位電子看板市場在中期內保持強勁成長勢頭。
5G 和邊緣運算賦能的即時戶外串流播放
東京、首爾、新加坡和雪梨的交通部門正在利用毫米波5G骨幹網,向戶外LED廣告看板提供超低延遲的影片和緊急警報。終端上的邊緣伺服器預先快取了高解析度視訊片段,從而降低了資料傳輸成本,並可在人流感測器活動激增時實現宣傳活動的即時切換。一項針對亞洲交通樞紐的研究表明,以5G取代傳統光纖可將生產力提高52%至245%,並將成本降低高達90%。隨著更多大都會圈獨立5G核心網的投入運作,數位電子看板市場可望迎來快速成長。
CMS標準的分散化使得多個供應商之間的互通性變得複雜。
儘管全球零售商經常使用多個品牌的螢幕,但目前缺乏通用的調度和分析協議。電訊(ITU) 警告稱,這種互通性的缺失將減緩技術的普及速度,並推高總體擁有成本。因此,許多公司被束縛於單一供應商的生態系統,限制了競爭性競標的機會。產業組織正在努力開發應用程式介面 (API),但由於各供應商的藍圖不同,進展緩慢。這種情況阻礙了數位電子看板市場短期內的擴充性。
細分市場分析
電視牆憑藉其在控制室和旗艦店中營造的沉浸式效果,預計將成為市場成長的主要驅動力,到2025年將佔銷售額的27.65%。在數位電子看板市場,這些顯示器的龐大規模對於品牌推廣和企業會議仍然至關重要。快餐店對數位海報的需求也很強勁,因為加盟商優先考慮內容更換的便利性。
同時,自助服務終端預計將成為成長最快的領域,到2031年複合年成長率(CAGR)預計達到9.1%,因為消費者擴大使用自助結帳系統、獲取路線指引和註冊會員計畫。數位電子看板市場的零售商正在透過部署人工智慧模組來提高平均交易額,這些模組會在結帳時推薦附加商品。透明液晶顯示器將產品展示與數據疊加相結合,正在高階商店和汽車展示室等細分市場中佔據一席之地。製造商目前正在試行將多面板電視牆與自助服務終端互動結合的混合系統,用於交通樞紐。
2025年,硬體組件將佔銷售額的60.12%,涵蓋LED顯示器、媒體播放機和安裝套件,並將繼續成為數位電子看板市場的基礎。像素成本的下降使得4-5年更換週期內的資本支出(CAPEX)保持在可控水準。
隨著企業逐漸意識到內容編配與分析能提升投資報酬率,軟體銷售額正以10.39%的複合年成長率達到兩位數成長。雲端控制面板透過遠端診斷確保設備運作,而人工智慧調度器則增強了宣傳活動的針對性。供應商正在整合「存在證明」(PoP)帳本,使廣告主能夠審核曝光量,從而提升了數位電子看板市場的信心。
區域分析
預計到2025年,北美將佔全球收入的33.08%,這主要得益於美國企業對門市大廳的整修,將其升級為「數位化優先」的展示空間。加拿大零售商正在加速收銀台的現代化改造,保持強勁的本地需求。該地區的數位電子看板市場受益於成熟的雲端基礎設施,降低了採用門檻。
亞太地區預計將實現8.42%的複合年成長率,這主要得益於中國的城市叢集項目、日本大力推進技術出口、印度購物中心的蓬勃發展以及東南亞旅遊業的復甦。面板和積體電路的一體化供應鏈正在降低單位成本,為區域買家提供價格柔軟性,並有助於提高數位電子看板市場的滲透率。
在歐洲,由於生態設計法規和高購買力,市場正經歷穩定成長。儘管歷史街區標誌的相關法規要求加強合規力度,但德國和北歐企業正在採用節能的A級顯示螢幕,從而抵消了旅遊區市場成長停滯的影響。東歐機場正透過身臨其境型導視牆競相爭奪樞紐地位,數位電子看板市場向東擴張。
其他好處:
- Excel格式的市場預測(ME)表
- 3個月的分析師支持
目錄
第1章:引言
- 研究假設和市場定義
- 調查範圍
第2章:調查方法
第3章執行摘要
第4章 市場狀況
- 市場概覽
- 市場促進因素
- 人工智慧驅動的受眾分析正在推動北美和歐洲零售及交通樞紐的動態內容個人化。
- 5G 和邊緣運算技術使得在亞洲和大洋洲的主要交通樞紐實現即時戶外串流播放成為可能。
- 歐盟關於企業永續性的法規正在加速節能型MicroLED和電子紙標牌的普及。
- 在美國,疫情後的混合辦公模式正在推動基於雲端的企業通訊儀表板的普及。
- 一個大型智慧大型企劃(NEOM,杜拜 2040)將在整個中東地區整合大型數位廣告看板。
- 拉丁美洲大型零售連鎖店採用電視牆的零售媒體商業化戰略正在推動這一趨勢。
- 市場限制因素
- CMS 標準的分散化使得全球零售商之間的多供應商互通性變得複雜。
- 在歐洲歷史名城建造戶外 LED 帷幕牆需要大量的資金投入,並且在獲得許可和授權也面臨許多障礙。
- 美國公共交通系統顯示器遭受勒索軟體攻擊,凸顯了網路安全漏洞。
- 大型面板專用驅動積體電路供應鏈價格飆升。
- 產業生態系分析
- 技術展望
- 波特五力分析
第5章 市場規模與成長預測
- 按類型
- 電視牆
- 視訊螢幕
- 亭
- 透明液晶顯示器
- 數位海報
- 廣告看板
- 其他類型
- 按組件
- 硬體
- LCD/LED顯示器
- OLED顯示器
- MicroLED顯示器
- 媒體播放機
- 控制器
- 投影機/投影幕
- 其他硬體
- 軟體
- 服務
- 安裝與整合
- 託管服務
- 支援與維護
- 硬體
- 不同的發展
- 現場
- 基於雲端的
- 混合
- 按螢幕尺寸
- 小於 32 英寸
- 32英寸至52英寸
- 52吋或更大
- 特大號,100吋或更大
- 地點
- 店內/室內
- 戶外的
- 按最終用途行業分類
- 零售
- 運輸
- 飯店業
- 公司
- 教育
- 衛生保健
- 政府
- 體育娛樂
- 銀行和金融服務
- 製造工廠
- 按地區
- 北美洲
- 美國
- 加拿大
- 墨西哥
- 歐洲
- 德國
- 英國
- 法國
- 北歐的
- 其他歐洲國家
- 南美洲
- 巴西
- 其他南美國家
- 亞太地區
- 中國
- 日本
- 印度
- 東南亞
- 其他亞太國家
- 中東和非洲
- 中東
- 波灣合作理事會(GCC)成員國
- 土耳其
- 其他中東國家
- 非洲
- 南非
- 其他非洲國家
- 中東
- 北美洲
第6章 競爭情勢
- 市場集中度
- 策略趨勢
- 市佔率分析
- 公司簡介
- NEC Display Solutions Ltd.
- LG Display Co. Ltd.
- Samsung Electronics Co. Ltd.
- Panasonic Corporation
- Sony Group Corporation
- Stratacache
- Planar Systems Inc.
- Hitachi Ltd.
- Barco NV
- Goodview
- Cisco Systems Inc.
- Scala Inc.
- Broadsign International LLC
- Appspace Inc.
- BrightSign LLC
- Mvix Inc.
- Christie Digital Systems USA Inc.
- Daktronics Inc.
- Leyard Optoelectronic Co. Ltd.
- Unilumin Group Co. Ltd.
- JCDecaux SA
- E Ink Holdings Inc.
- Clear Channel Outdoor Holdings Inc.
- Sharp Corporation
第7章 市場機會與未來展望
According to Mordor Intelligence, digital signage market size in 2026 is estimated at USD 29.95 billion, growing from 2025 value of USD 27.66 billion with 2031 projections showing USD 44.6 billion, growing at 8.28% CAGR over 2026-2031.
This report is Segmented by Type (Video Wall, Video Screen, Kiosk, and More), Component (Hardware, Software, and Services), Deployment (On-Premise, Cloud-Based, and Hybrid), Screen Size (Below 32", 32"-52", and More), Location (In-store/Indoor, and Outdoor), End-Use Industry (Retail, Transportation, Hospitality, Corporate, and More), and Geography. The Market Forecasts are Provided in Terms of Value (USD).
Global Digital Signage Market Trends and Insights
AI-powered audience analytics boosting dynamic content personalisation
Retailers now replace one-size-fits-all loops with AI engines that adjust messaging in real time when shoppers approach. Computer-vision modules gauge age bracket, gender and engagement length, then trigger creative variants that can lift conversion by as much as 30%. Chains in the United States, United Kingdom, Germany and France link these insights with loyalty-app data to enrich omnichannel campaigns. Agencies pay premium CPMs for such precise exposure, turning store networks into high-margin media channels. Compliance with GDPR shapes rollout pace in Europe, yet vendors embed privacy-by-design workflows that anonymise video frames locally before analysis. These factors keep the digital signage market on a solid medium-term growth path.
5G + edge computing enabling real-time outdoor streaming
Transit authorities in Tokyo, Seoul, Singapore and Sydney use millimetre-wave 5G backbones to push ultra-low-latency video and emergency alerts to outdoor LED boards. On-device edge servers pre-cache high-resolution clips, cutting data transit cost and letting campaigns switch instantly when foot-traffic sensors spike. Studies for Asian transport hubs show productivity gains from 52% to 245% and cost savings up to 90% when 5G replaces legacy fibre. As more metros activate standalone 5G cores, the digital signage market receives an immediate uplift.
Fragmented CMS standards complicating multi-vendor interoperability
Global retailers often juggle screens from several brands yet find no common protocol for scheduling or analytics. The International Telecommunication Union warns that the lack of interoperability slows deployments and raises total ownership cost. Many firms therefore lock into single-vendor ecosystems, limiting competitive bids. Industry alliances are drafting APIs, but diverging roadmaps among vendors keep progress slow. This reality curbs near-term scalability for the digital signage market.
Other drivers and restraints analyzed in the detailed report include:
- EU corporate sustainability mandates accelerating energy-efficient displays
- Post-pandemic hybrid work models driving cloud dashboards
- Cyber-security vulnerabilities spotlighted by ransomware on transit displays
For complete list of drivers and restraints, kindly check the Table Of Contents.
Segment Analysis
Video walls dominated 2025 revenue with 27.65% share due to their immersive impact in control rooms and flagship retail settings. The digital signage market continues to favour their scale for brand theatre and corporate town-hall events. Demand also stays steady for digital posters in quick-serve restaurants because franchisees value simple content swaps.
Kiosks, however, offer the fastest 9.1% CAGR to 2031 as shoppers embrace self-checkout, wayfinding and loyalty enrollment on responsive touchscreens. Retailers in the digital signage market deploy AI modules that recommend add-ons at check-out, nudging ticket size. Transparent LCD enclosures carve a niche in luxury stores and automotive showrooms, merging product visibility with data overlays. Manufacturers now experiment with hybrid rigs that fuse multi-panel video walls and kiosk interaction for transit concourses.
Hardware parts generated 60.12% of 2025 turnover and remain foundational to the digital signage market, covering LED tiles, media players and mounting kits. Falling pixel costs keep capex manageable for refresh cycles every four-to-five years.
Software revenue is growing at a double-digit 10.39% CAGR as companies discover that content orchestration and analytics drive ROI. Cloud dashboards secure fleet uptime through remote diagnostics, while AI schedulers improve campaign relevance. Vendors integrate proof-of-play ledgers so advertisers can audit exposures, raising confidence in the digital signage market.
Complete Report Scope:
- By Type
- Video Wall
- Video Screen
- Kiosk
- Transparent LCD Screen
- Digital Poster
- Billboard
- Other Types
- By Component
- Hardware
- LCD/LED Display
- OLED Display
- MicroLED Display
- Media Players
- Controllers
- Projector/Projection Screens
- Other Hardware
- Software
- Services
- Installation and Integration
- Managed Services
- Support and Maintenance
- Hardware
- By Deployment
- On-premise
- Cloud-based
- Hybrid
- By Screen Size
- Below 32"
- 32"-52"
- Above 52"
- Ultra-large Above 100"
- By Location
- In-store/Indoor
- Outdoor
- By End-use Industry
- Retail
- Transportation
- Hospitality
- Corporate
- Education
- Healthcare
- Government
- Sports and Entertainment
- Banking and Financial Services
- Manufacturing Facilities
- By Geography
- North America
- United States
- Canada
- Mexico
- Europe
- Germany
- United Kingdom
- France
- Nordics
- Rest of Europe
- South America
- Brazil
- Rest of South America
- Asia-Pacific
- China
- Japan
- India
- South-East Asia
- Rest of Asia-Pacific
- Middle East and Africa
- Middle East
- Gulf Cooperation Council Countries
- Turkey
- Rest of Middle East
- Africa
- South Africa
- Rest of Africa
- Middle East
- North America
Geography Analysis
North America held 33.08% 2025 income, anchored by United States corporate refurbishments that turned lobbies into digital-first showcases. Canadian retailers accelerate checkout modernisation, keeping regional demand steady. The digital signage market here benefits from mature cloud infrastructure that reduces deployment friction.
Asia-Pacific is on an 8.42% CAGR trajectory, propelled by China's city cluster projects, Japan's technology export push, India's mall boom and Southeast Asia's tourism recovery. An integrated supply chain for panels and ICs lowers unit costs, giving regional buyers price latitude that boosts the digital signage market's penetration.
Europe records stable gains supported by ecodesign mandates and high purchasing power. Historic-district signage caps add compliance effort, yet German and Nordic corporates adopt energy-class A displays, offsetting tourist-zone pauses. Eastern European airports compete for hub status through immersive wayfinding walls, expanding the digital signage market eastward.
- NEC Display Solutions Ltd.
- LG Display Co. Ltd.
- Samsung Electronics Co. Ltd.
- Panasonic Corporation
- Sony Group Corporation
- Stratacache
- Planar Systems Inc.
- Hitachi Ltd.
- Barco NV
- Goodview
- Cisco Systems Inc.
- Scala Inc.
- Broadsign International LLC
- Appspace Inc.
- BrightSign LLC
- Mvix Inc.
- Christie Digital Systems USA Inc.
- Daktronics Inc.
- Leyard Optoelectronic Co. Ltd.
- Unilumin Group Co. Ltd.
- JCDecaux SA
- E Ink Holdings Inc.
- Clear Channel Outdoor Holdings Inc.
- Sharp Corporation
Additional Benefits:
- The market estimate (ME) sheet in Excel format
- 3 months of analyst support
TABLE OF CONTENTS
1 INTRODUCTION
- 1.1 Study Assumptions and Market Definition
- 1.2 Scope of the Study
2 RESEARCH METHODOLOGY
3 EXECUTIVE SUMMARY
4 MARKET LANDSCAPE
- 4.1 Market Overview
- 4.2 Market Drivers
- 4.2.1 AI-powered audience analytics boosting dynamic content personalisation in North American and European retail and transit corridors
- 4.2.2 5G + edge computing enabling real-time outdoor streaming across major Asian and Oceanian transport hubs
- 4.2.3 EU corporate sustainability mandates accelerating adoption of energy-efficient MicroLED and e-paper signage
- 4.2.4 Post-pandemic hybrid work models driving cloud-based corporate communication dashboards in the USA
- 4.2.5 Smart-city mega-projects (NEOM, Dubai 2040) integrating large-format digital billboards across the Middle East
- 4.2.6 Retail-media monetisation strategies fuelling video-wall roll-outs by Latin-American big-box chains
- 4.3 Market Restraints
- 4.3.1 Fragmented CMS standards complicating multi-vendor interoperability for global retailers
- 4.3.2 High CAPEX and permitting hurdles for outdoor LED facades in historical European city centres
- 4.3.3 Cyber-security vulnerabilities spotlighted by ransomware on United States transit displays
- 4.3.4 Supply-chain price spikes in specialty driver-ICs for large panels
- 4.4 Industry Ecosystem Analysis
- 4.5 Technological Outlook
- 4.6 Porter's Five Forces Analysis
- 4.6.1 Threat of New Entrants
- 4.6.2 Bargaining Power of Buyers
- 4.6.3 Bargaining Power of Suppliers
- 4.6.4 Threat of Substitutes
- 4.6.5 Intensity of Competitive Rivalry
5 MARKET SIZE AND GROWTH FORECASTS (VALUES)
- 5.1 By Type
- 5.1.1 Video Wall
- 5.1.2 Video Screen
- 5.1.3 Kiosk
- 5.1.4 Transparent LCD Screen
- 5.1.5 Digital Poster
- 5.1.6 Billboard
- 5.1.7 Other Types
- 5.2 By Component
- 5.2.1 Hardware
- 5.2.1.1 LCD/LED Display
- 5.2.1.2 OLED Display
- 5.2.1.3 MicroLED Display
- 5.2.1.4 Media Players
- 5.2.1.5 Controllers
- 5.2.1.6 Projector/Projection Screens
- 5.2.1.7 Other Hardware
- 5.2.2 Software
- 5.2.3 Services
- 5.2.3.1 Installation and Integration
- 5.2.3.2 Managed Services
- 5.2.3.3 Support and Maintenance
- 5.2.1 Hardware
- 5.3 By Deployment
- 5.3.1 On-premise
- 5.3.2 Cloud-based
- 5.3.3 Hybrid
- 5.4 By Screen Size
- 5.4.1 Below 32"
- 5.4.2 32"-52"
- 5.4.3 Above 52"
- 5.4.4 Ultra-large Above 100"
- 5.5 By Location
- 5.5.1 In-store/Indoor
- 5.5.2 Outdoor
- 5.6 By End-use Industry
- 5.6.1 Retail
- 5.6.2 Transportation
- 5.6.3 Hospitality
- 5.6.4 Corporate
- 5.6.5 Education
- 5.6.6 Healthcare
- 5.6.7 Government
- 5.6.8 Sports and Entertainment
- 5.6.9 Banking and Financial Services
- 5.6.10 Manufacturing Facilities
- 5.7 By Geography
- 5.7.1 North America
- 5.7.1.1 United States
- 5.7.1.2 Canada
- 5.7.1.3 Mexico
- 5.7.2 Europe
- 5.7.2.1 Germany
- 5.7.2.2 United Kingdom
- 5.7.2.3 France
- 5.7.2.4 Nordics
- 5.7.2.5 Rest of Europe
- 5.7.3 South America
- 5.7.3.1 Brazil
- 5.7.3.2 Rest of South America
- 5.7.4 Asia-Pacific
- 5.7.4.1 China
- 5.7.4.2 Japan
- 5.7.4.3 India
- 5.7.4.4 South-East Asia
- 5.7.4.5 Rest of Asia-Pacific
- 5.7.5 Middle East and Africa
- 5.7.5.1 Middle East
- 5.7.5.1.1 Gulf Cooperation Council Countries
- 5.7.5.1.2 Turkey
- 5.7.5.1.3 Rest of Middle East
- 5.7.5.2 Africa
- 5.7.5.2.1 South Africa
- 5.7.5.2.2 Rest of Africa
- 5.7.5.1 Middle East
- 5.7.1 North America
6 COMPETITIVE LANDSCAPE
- 6.1 Market Concentration
- 6.2 Strategic Moves
- 6.3 Market Share Analysis
- 6.4 Company Profiles (includes Global level Overview, Market level overview, Core Segments, Financials as available, Strategic Information, Market Rank/Share for key companies, Products and Services, and Recent Developments)
- 6.4.1 NEC Display Solutions Ltd.
- 6.4.2 LG Display Co. Ltd.
- 6.4.3 Samsung Electronics Co. Ltd.
- 6.4.4 Panasonic Corporation
- 6.4.5 Sony Group Corporation
- 6.4.6 Stratacache
- 6.4.7 Planar Systems Inc.
- 6.4.8 Hitachi Ltd.
- 6.4.9 Barco NV
- 6.4.10 Goodview
- 6.4.11 Cisco Systems Inc.
- 6.4.12 Scala Inc.
- 6.4.13 Broadsign International LLC
- 6.4.14 Appspace Inc.
- 6.4.15 BrightSign LLC
- 6.4.16 Mvix Inc.
- 6.4.17 Christie Digital Systems USA Inc.
- 6.4.18 Daktronics Inc.
- 6.4.19 Leyard Optoelectronic Co. Ltd.
- 6.4.20 Unilumin Group Co. Ltd.
- 6.4.21 JCDecaux SA
- 6.4.22 E Ink Holdings Inc.
- 6.4.23 Clear Channel Outdoor Holdings Inc.
- 6.4.24 Sharp Corporation
7 MARKET OPPORTUNITIES AND FUTURE OUTLOOK
- 7.1 White-space and Unmet-need Assessment

 美國數位電子看板:市場佔有率分析、產業趨勢與統計及成長預測(2026-2031 年)越南數位電子看板市場:市場佔有率分析、產業趨勢與統計及成長預測(2026-2031)中東和非洲數位電子看板市場:市場佔有率分析、行業趨勢和統計數據以及成長預測(2026-2031 年)
 LED指示牌市場-全球市場預測(2026-2032年)北美數位電子看板市場:市場佔有率分析、產業趨勢與統計及成長預測(2026-2031 年)數位電子看板市場:2026-2032年全球市場預測(按組件、顯示技術、內容類型、解析度、螢幕大小、連接方式、應用、安裝位置和部署模式分類)數位電子看板服務:市場佔有率分析、產業趨勢與統計、成長預測(2026-2031)
 透明數位電子看板冷卻器市場規模、佔有率和成長分析:按產品類型、顯示技術、容量、應用、最終用戶、分銷管道和地區分類-2026-2033年產業預測
 智慧LED室內指示牌市場報告:螢幕大小、最終用戶和地區分類(2026-2034年)
 2026-2030年全球商用大尺寸顯示指示牌市場