


 |
市場調查報告書
商品編碼
2073436
美國太陽能:市場佔有率分析、行業趨勢和統計數據以及成長預測(2026-2031 年)United States Solar Energy - Market Share Analysis, Industry Trends & Statistics, Growth Forecasts (2026 - 2031) |
||||||

※ 本網頁內容可能與最新版本有所差異。詳細情況請與我們聯繫。
據 Mordor Intelligence 稱,美國太陽能市場規模(按裝置容量計算)預計將從 2026 年的 269.54 吉瓦擴大到 2031 年的 453.37 吉瓦,在預測期(2026-2031 年)內複合年成長率為 10.96%。
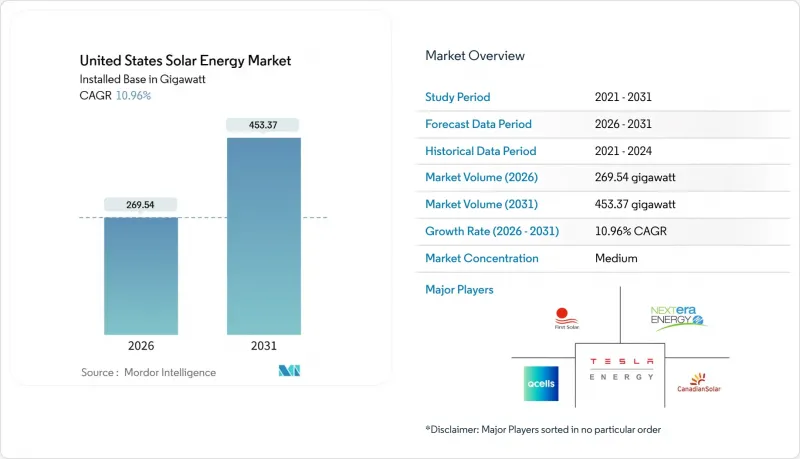
本報告按技術(光伏和聚光型太陽光電)、併網類型(併網和離網)以及最終用戶(公用事業規模、商業/工業和住宅)進行細分。市場規模和預測以裝置容量(GW)表示。
美國太陽能市場趨勢與洞察
《通膨控制法》下的稅收優惠正在加速公用事業規模的購電協議 (PPA) 的簽訂。
由於高達30%的無上限投資稅額扣抵和每兆瓦時26美元的生產稅額扣抵延長至2034年,週期性的採購流程已經結束,使得開發商即使在俄亥俄州和賓夕法尼亞州等曾經經濟落後於西南部地區的州也能資金籌措。加上現有的薪資和國產化率補貼,稅收優惠總額可超過專案成本的50%,這種轉變正促使資本重新配置到符合美國環保署「睦鄰友好計畫」的燃煤發電逐步淘汰地區。企業買家已於2024年簽署了16.6吉瓦的太陽能發電購電協議(PPA),而個人退休帳戶(IRA)提供的確定性降低了收入風險,使他們能夠輕鬆應對15-20年的合約期限。因此,計畫儲備正在多元化,美國太陽能市場正在向傳統的「陽光地帶」以外的州擴展。因此,發電容量的長期成長與電網升級計畫的關聯性越來越強,而與聯邦政策的到期時間的關聯性則相對較弱。
將其與電網邊緣儲能結合,可以提高專案的資金籌措潛力。
2024年,太陽能發電與電池儲能結合的混合項目佔併網等待名單上發電容量的63%。這主要得益於加速折舊的優勢,以及將能源轉移到晚間時段的能力——此時批發價格是白天的三倍。加州的NEM 3.0方案延長了獨立太陽能發電系統的投資回收期,但增加10千瓦時的電池儲能可以恢復住宅的投資回報率,並在黃昏時分電價高峰時段穩定電網需求。在德克薩斯州電力公司的開發案中,永久安裝了4小時的鋰離子電池儲能系統,以便在運作緊張時期(例如2024年8月的熱浪期間,電價飆升至每兆瓦時5000美元)獲取ERCOT的價格。金融機構現在將配備電池儲能的資產視為低風險資產,從而將債務利差降低了多達30個基點。這種信貸優勢正在加速整合系統在美國太陽能市場的滲透。
電網連接隊列的瓶頸導致前置作業時間延長至超過 36 個月。
截至2024年中期,美國併網申請等待名單上積壓的發電和儲能容量超過2600吉瓦,其中95%為太陽能、風能或電池儲能,相當於現有電網容量的2.4倍。 MISO和PJM的平均等待時間已達五年,推高了持有成本,並使專案內部收益率(IRR)下降高達12%。儘管「2023號法令」下的叢集調查改革有望簡化新申請的核准流程,但仍有1350吉瓦的現有項目受制於舊法規,不太可能在2028年之前獲得批准。開發商正擴大轉向佛羅裡達州和卡羅來納州等由垂直一體化電力公司主導的州,這些州的等待時間更短,規劃協調也更有效率。然而,長期延誤仍在拖累美國太陽能市場的整體成長前景。
細分市場分析
到2025年,太陽能發電將占美國太陽能市場的99.35%,並將在2031年之前以10.98%的複合年成長率持續成長。 First Solar的碲化鎘技術雖然目前裝置容量佔比不到5%,但由於其低碳足跡、國內生產認證以及能夠最大限度地利用《通貨膨脹控制法案》(IRA)的獎勵,正經歷著快速成長。 TOPCon電池將組件效率提升至23%,降低了系統總成本,同時進一步強化了晶體矽的優勢。目前,雙面組件佔公用事業規模電站的60%,並在高反射率的安裝地點額外提供10-20%的發電量。 60%的公用事業規模招標書中都明確規定了這個特性。
聚光型太陽光電目前仍限於美國西南部現有地區,且受熔鹽儲熱成本的限制(熔鹽儲熱成本是鋰離子電池的三倍),導致其年複合成長率僅2.1%。鈣鈦礦矽串聯電池在2024年實現了33.9%的實驗室效率,但面臨耐久性挑戰,預計要到2030年或更晚才能商業化。雖然晶體矽仍佔據主導地位,但薄膜技術的興起正在降低供應鏈風險並增強市場韌性。隨著路易斯安那州和俄亥俄州新工廠的運作,預計到2031年,美國薄膜太陽能市場規模將成長兩倍。
其他好處:
- Excel格式的市場預測(ME)表
- 3個月的分析師支持
目錄
第1章:引言
- 研究假設和市場定義
- 調查範圍
第2章:調查方法
第3章執行摘要
第4章 市場狀況
- 市場概覽
- 市場促進因素
- 《通貨膨脹控制法案》(IRA) 下的稅收優惠正在加速公用事業規模的購電協議 (PPA) 的簽訂。
- 透過與電網邊緣儲能系統結合,提高專案資金籌措潛力。
- 企業淨零排放義務正在促進工商業電力購買協議的簽訂。
- 社區太陽能計畫旨在擴大人口稠密州的太陽能接觸。
- 透過國內製造業信貸降低模組進口風險
- Agribol Tikes:改善中西部地區的土地利用經濟效益
- 市場限制因素
- 由於互連排隊造成的瓶頸導致前置作業時間超過 36 個月。
- 根據第 201 條和第 301 條採取的貿易措施會導致模組價格波動。
- 西南地區電網擁塞日益嚴重,阻礙了電力項目的發展。
- 由於技術純熟勞工短缺,EPC成本較去年同期上漲超過18%。
- 供應鏈分析
- 監管和政策展望(聯邦和州)
- 技術趨勢(拓樸互連、異質結電晶體、鈣鈦礦、雙面光接收型)
- 波特五力模型
- PESTLE分析
第5章 市場規模與成長預測
- 透過技術
- 太陽能發電(PV)
- 聚光型太陽熱能發電(CSP)
- 按網格類型
- 併網
- 離網
- 最終用戶
- 公用事業規模
- 商業和工業(C&I)
- 住宅
- 按成分(定性分析)
- 太陽能模組/面板
- 逆變器(組串式、集中式、微型)
- 安裝和追蹤系統
- 系統周邊設備和電氣設備
- 儲能和混合整合
第6章 競爭情勢
- 市場集中度
- 策略趨勢(併購、聯盟、購電協議)
- 市場佔有率分析(主要公司的市場排名和佔有率)
- 公司簡介
- First Solar Inc.
- NextEra Energy Inc.
- SunPower Corporation
- Hanwha Q CELLS USA Corp.
- Canadian Solar Inc.
- JinkoSolar Holding Co. Ltd.
- Tesla Energy
- Sunrun Inc.
- 8minute Solar Energy
- SOLV Energy LLC
- Mortenson Construction
- Rosendin Electric Inc.
- Renewable Energy Systems Americas
- Brookfield Renewable US
- EDF Renewables North America
- Enphase Energy Inc.
- Trina Solar Ltd.
- LONGi Solar
- REC Group(REC Solar Norway AS)
- Array Technologies Inc.
- Nextracker Inc.
第7章 市場機會與未來展望
According to Mordor Intelligence, the united states solar energy market size in terms of installed base is expected to grow from 269.54 gigawatt in 2026 to 453.37 gigawatt by 2031, at a CAGR of 10.96% during the forecast period (2026-2031).
This report is Segmented by Technology (Solar Photovoltaic and Concentrated Solar Power), Grid Type (On-Grid and Off-Grid), and End-User (Utility-Scale, Commercial and Industrial, and Residential). The Market Sizes and Forecasts are Provided in Terms of Installed Capacity (GW).
United States Solar Energy Market Trends and Insights
Inflation Reduction Act Tax Incentives Accelerating Utility-Scale PPAs
The uncapped 30% investment tax credit and USD 26 per MWh production tax credit extended through 2034 have ended boom-bust procurement cycles, enabling developers to underwrite projects in Ohio and Pennsylvania that once trailed the Southwest on economics. Stacking prevailing-wage and domestic-content adders can lift total tax benefits above 50% of project cost, a shift redirecting capital toward coal-retirement regions under EPA's Good Neighbor Plan. Corporate buyers contracted 16.6 GW of solar PPAs in 2024 and are comfortable with 15- to 20-year tenors because IRA certainty reduces revenue risk. The resulting pipeline diversification is broadening the United States solar energy market footprint beyond traditional sunbelt states. As a result, long-term capacity growth now aligns more closely with transmission-upgrade schedules than with federal policy sunsets.
Grid-Edge Storage Pairing Enhancing Project Bankability
Hybrid solar-plus-battery projects represented 63% of capacity in interconnection queues during 2024, driven by accelerated depreciation benefits and the ability to shift energy into evening hours when wholesale prices triple midday levels. California's NEM 3.0 regime lengthened standalone-solar payback periods, but adding a 10 kWh battery restores homeowner ROI and stabilizes grid demand during high-priced twilight peaks. Utility developers in Texas routinely attach 4-hour lithium-ion systems to capture ERCOT scarcity pricing, which surged to USD 5,000 per MWh during the August 2024 heatwave. Lenders now view storage-paired assets as lower risk, tightening debt spreads by up to 30 basis points. This credit advantage is accelerating market penetration of integrated systems across the United States solar energy market.
Interconnection Queue Bottlenecks Increasing Lead-Times Beyond 36 Months
More than 2,600 GW of generation and storage sat in U.S. queues by mid-2024, 95% of it solar, wind, or batteries-equal to 2.4 times existing grid capacity. Wait times average five years in MISO and PJM, lifting holding costs and eroding project IRRs by up to 12%. While Order 2023's cluster-study reforms will streamline new applications, 1,350 GW of legacy projects remain under old rules and are unlikely to clear before 2028. Developers increasingly pursue vertically integrated-utility states, such as Florida and the Carolinas, where queues are shorter and planning is coordinated. Nevertheless, prolonged delays continue to dampen the overall growth outlook for the United States solar energy market.
Other drivers and restraints analyzed in the detailed report include:
- Corporate Net-Zero Mandates Spurring C&I Power-Purchase Agreements
- Community-Solar Programs Expanding Access in High-Population States
- Section 201/301 Trade Actions Causing Module-Price Volatility
For complete list of drivers and restraints, kindly check the Table Of Contents.
Segment Analysis
Solar photovoltaics held 99.35% of the United States solar energy market in 2025, expanding at a 10.98% CAGR through 2031. First Solar's cadmium-telluride technology, though under 5% of capacity, grows swiftly because its lower carbon footprint and domestic-content status unlock maximum IRA adders. TOPCon cells boost module efficiencies to 23%, trimming balance-of-system costs and reinforcing crystalline silicon's lead. Bifacial modules now account for 60% of utility plants, delivering 10-20% extra yield on reflective sites, an attribute written into 60% of utility RFPs.
Concentrated solar power remains confined to legacy southwestern sites, rising only 2.1% CAGR, constrained by molten-salt storage costs three times higher than lithium-ion batteries. Perovskite-silicon tandems hit 33.9% lab efficiency in 2024 but face durability hurdles, implying commercial rollout post-2030. While crystalline silicon dominates, thin-film's rise tempers supply-chain risk, reinforcing resilience in the market. The United States solar energy market size tied to thin-film is projected to triple by 2031 as new fabs in Louisiana and Ohio come online.
Complete Report Scope:
- By Technology
- Solar Photovoltaic (PV)
- Concentrated Solar Power (CSP)
- By Grid Type
- On-Grid
- Off-Grid
- By End-User
- Utility-Scale
- Commercial and Industrial (C&I)
- Residential
- By Component (Qualitative Analysis)
- Solar Modules/Panels
- Inverters (String, Central, Micro)
- Mounting and Tracking Systems
- Balance-of-System and Electricals
- Energy Storage and Hybrid Integration
List of Companies Covered in this Report:
- First Solar Inc.
- NextEra Energy Inc.
- SunPower Corporation
- Hanwha Q CELLS USA Corp.
- Canadian Solar Inc.
- JinkoSolar Holding Co. Ltd.
- Tesla Energy
- Sunrun Inc.
- 8minute Solar Energy
- SOLV Energy LLC
- Mortenson Construction
- Rosendin Electric Inc.
- Renewable Energy Systems Americas
- Brookfield Renewable US
- EDF Renewables North America
- Enphase Energy Inc.
- Trina Solar Ltd.
- LONGi Solar
- REC Group (REC Solar Norway AS)
- Array Technologies Inc.
- Nextracker Inc.
Additional Benefits:
- The market estimate (ME) sheet in Excel format
- 3 months of analyst support
TABLE OF CONTENTS
1 Introduction
- 1.1 Study Assumptions & Market Definition
- 1.2 Scope of the Study
2 Research Methodology
3 Executive Summary
4 Market Landscape
- 4.1 Market Overview
- 4.2 Market Drivers
- 4.2.1 Inflation Reduction Act (IRA) Tax Incentives Accelerating Utility-Scale PPAs
- 4.2.2 Grid-Edge Storage Pairing Enhancing Project Bankability
- 4.2.3 Corporate Net-Zero Mandates Spurring C&I Power-Purchase Agreements
- 4.2.4 Community-Solar Programs Expanding Access in High-Population States
- 4.2.5 Domestic Manufacturing Credits Cutting Module Import Risk
- 4.2.6 Agrivoltaics Improving Land-Use Economics in the Midwest
- 4.3 Market Restraints
- 4.3.1 Interconnection Queue Bottlenecks Increasing Lead-Times Beyond 36 Months
- 4.3.2 Section 201/301 Trade Actions Causing Module-Price Volatility
- 4.3.3 Rising Transmission Congestion Curtailing Southwest Utility Projects
- 4.3.4 Skilled-Labor Shortage Inflating EPC Costs by >18 % YoY
- 4.4 Supply-Chain Analysis
- 4.5 Regulatory & Policy Outlook (Federal + State)
- 4.6 Technological Outlook (TOPCon, HJT, Perovskites, Bifacial)
- 4.7 Porter's Five Forces
- 4.7.1 Threat of New Entrants
- 4.7.2 Bargaining Power of Suppliers
- 4.7.3 Bargaining Power of Buyers
- 4.7.4 Threat of Substitutes (Wind, RNG, Long-Duration Storage)
- 4.7.5 Competitive Rivalry
- 4.8 PESTLE Analysis
5 Market Size & Growth Forecasts
- 5.1 By Technology
- 5.1.1 Solar Photovoltaic (PV)
- 5.1.2 Concentrated Solar Power (CSP)
- 5.2 By Grid Type
- 5.2.1 On-Grid
- 5.2.2 Off-Grid
- 5.3 By End-User
- 5.3.1 Utility-Scale
- 5.3.2 Commercial and Industrial (C&I)
- 5.3.3 Residential
- 5.4 By Component (Qualitative Analysis)
- 5.4.1 Solar Modules/Panels
- 5.4.2 Inverters (String, Central, Micro)
- 5.4.3 Mounting and Tracking Systems
- 5.4.4 Balance-of-System and Electricals
- 5.4.5 Energy Storage and Hybrid Integration
6 Competitive Landscape
- 6.1 Market Concentration
- 6.2 Strategic Moves (M&A, Partnerships, PPAs)
- 6.3 Market Share Analysis (Market Rank/Share for key companies)
- 6.4 Company Profiles (includes Global level Overview, Market level overview, Core Segments, Financials as available, Strategic Information, Products & Services, and Recent Developments)
- 6.4.1 First Solar Inc.
- 6.4.2 NextEra Energy Inc.
- 6.4.3 SunPower Corporation
- 6.4.4 Hanwha Q CELLS USA Corp.
- 6.4.5 Canadian Solar Inc.
- 6.4.6 JinkoSolar Holding Co. Ltd.
- 6.4.7 Tesla Energy
- 6.4.8 Sunrun Inc.
- 6.4.9 8minute Solar Energy
- 6.4.10 SOLV Energy LLC
- 6.4.11 Mortenson Construction
- 6.4.12 Rosendin Electric Inc.
- 6.4.13 Renewable Energy Systems Americas
- 6.4.14 Brookfield Renewable US
- 6.4.15 EDF Renewables North America
- 6.4.16 Enphase Energy Inc.
- 6.4.17 Trina Solar Ltd.
- 6.4.18 LONGi Solar
- 6.4.19 REC Group (REC Solar Norway AS)
- 6.4.20 Array Technologies Inc.
- 6.4.21 Nextracker Inc.
7 Market Opportunities & Future Outlook
- 7.1 White-Space & Unmet-Need Assessment

 法國太陽能:市場佔有率分析、產業趨勢與統計及成長預測(2026-2031)
 太陽能市場
太陽能市場 太陽能發電系統市場:2026-2032年全球市場預測(以交付方式、組件、系統類型、安裝方式、系統規模及最終用途分類)馬來西亞太陽能:市場佔有率分析、產業趨勢與統計及成長預測(2026-2031)
 太陽能市場-全球產業規模、佔有率、趨勢、機會和預測:按技術、太陽能組件、應用、最終用途、地區和競爭格局分類,2021-2031年
 太陽能市場規模、佔有率和成長分析:按產品/組件、技術、安裝類型、併網類型、最終用途、電源和地區分類-2026-2033年產業預測
 太陽能發電設備:全球市場、技術、終端用戶與競爭格局
 2026年全球太陽能市場報告
 太陽能發電系統市場分析及預測(至2035年):依類型、產品類型、服務、技術、組件、應用、安裝類型、最終用戶、功能及設備分類東南亞太陽能:市場佔有率分析、產業趨勢與統計、成長預測(2026-2031)