


 |
市場調查報告書
商品編碼
2072652
美國獨立顯示卡:市佔率分析、產業趨勢與統計及成長預測(2026-2031 年)United States Discrete GPU - Market Share Analysis, Industry Trends & Statistics, Growth Forecasts (2026 - 2031) |
||||||

※ 本網頁內容可能與最新版本有所差異。詳細情況請與我們聯繫。
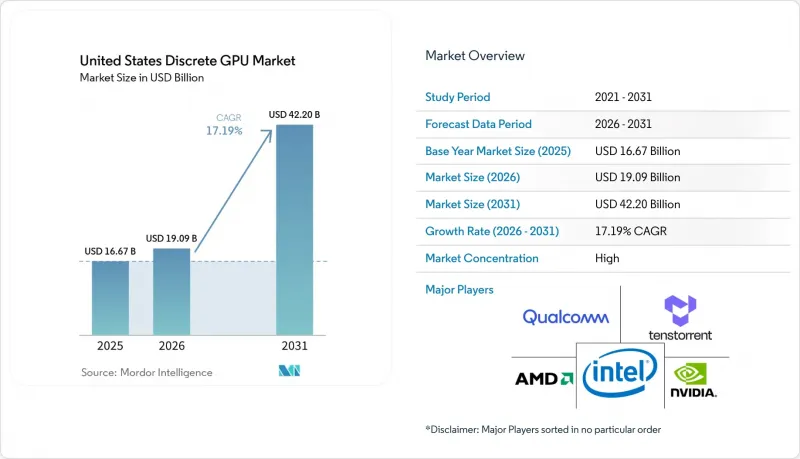
據 Mordor Intelligence 稱,2025 年美國獨立 GPU 市值為 166.7 億美元,預計到 2031 年將達到 422 億美元,而 2026 年為 190.9 億美元,預測期(2026-2031 年)的複合年成長率為 17.19%。
本報告按裝置應用(行動裝置和平板電腦、PC 和工作站、伺服器和資料中心加速器、遊戲主機等)、記憶體類型(基於 GDDR 的 GPU 和基於 HBM 的 GPU)以及效能等級(低成本 GPU、主流 GPU、高效能消費級 GPU 和資料中心/AI 加速器 GPU)進行細分。市場預測以美元 (USD) 為單位。
美國獨立顯示卡市場的趨勢與洞察
資料中心中人工智慧和機器學習工作負載的激增。
超大規模資料中心超大規模資料中心業者正從間歇性的基礎設施更新周期轉向持續的基礎設施擴展,這主要是由於大規模語言模型推理需要持續的運算資源可用性。 OpenAI 已簽署一份多年期契約,購買相當於 6 吉瓦資料中心容量的 AMD Instinct MI400 加速器;Meta 也承諾在 2026 年初部署類似的 6 吉瓦容量。儘管資料中心建設正處於歷史最高水平,但到 2026 年,美國規劃的資料中心容量中只有 23% 能夠保證與電力公司連接,這導致採購標準轉向關注「每瓦性能」。 NVIDIA 的 Rubin 平台透過水冷技術和動態電壓調節,將空閒功耗降低了 40%,從而應對了這項挑戰。隨著電網限制日益嚴格,預計那些推理處理 TDP 低於 300 瓦的供應商將比競爭對手更早獲得大量配額。
《晶片法案》下的補貼刺激了國內GPU的生產。
聯邦政府的獎勵正在重塑製造業格局。英特爾獲得的78.6億美元津貼將用於興建四座先進晶圓廠,預計2027年運作,其18埃製程製程產能將提升。台積電位於亞利桑那州的工廠獲得了66億美元的資金支持,將擁有六座晶圓廠和先進的CoWoS封裝技術,從而實現HBM堆疊的國內整合。設計、製造和封裝環節的緊密結合,預計將把從流片到量產的時間從18個月縮短到不到12個月。美光計畫在紐約建造的HBM工廠將進一步實現其供應鏈多元化,並降低對海外記憶體供應商的依賴。
供應鏈對先進節點製造能力的脆弱性
台積電和三星控制全球整體製程產能,預計兩家公司在2026年之前都將接近運作運轉。英偉達的Blackwell GPU採用台積電的4奈米製程和CoWoS-L封裝,該封裝也用於蘋果的A系列處理器,這導致GPU晶圓的前置作業時間較長。 AMD的MI400採用台積電的3奈米製程,但量產預計要到2026年下半年才能實現。英特爾的18埃製程節點可能是未來的替代方案,但其良率尚未得到驗證。代工廠產能有限有利於擁有多年晶圓供應合約的現有公司,但對新參與企業而言卻是一種限制。
細分市場分析
預計到2025年,美國獨立顯示卡市場中,伺服器和資料中心加速器將佔出貨量的41.62%,反映出市場需求正從以遊戲玩家為中心轉向人工智慧推理叢集。隨著超大規模資料中心業者根據多年藍圖部署數百萬台加速器,預計美國獨立顯示卡市場中該細分市場的佔有率將進一步擴大。曾經是出貨量主要驅動力的個人電腦和工作站,由於整合顯示卡的興起和更長的更換週期,如今僅佔約30%。雖然遊戲主機仍然是一個小眾市場,但諸如NVIDIA DRIVE Thor之類的汽車ADAS設計正在開闢新的市場,並帶來更高的平均售價(ASP)。
剩餘銷售額分佈在行動裝置、嵌入式視覺和邊緣伺服器領域,每個領域都有其專屬的SKU。零售分析、智慧工廠和醫療成像等領域的邊緣推理閘道器蘊藏著巨大的商機,儘管目前仍處於早期階段。鑑於超超大規模資料中心業者資料中心的需求持續旺盛,資料中心的需求正趨於穩定而非週期性波動,預計2028年,該領域將占美國獨立GPU市場營收的50%以上。
其他好處:
- Excel格式的市場預測(ME)表
- 3個月的分析師支持
目錄
第1章:引言
- 研究假設和市場定義
- 調查範圍
第2章:調查方法
第3章執行摘要
第4章 市場狀況
- 市場概覽
- 市場促進因素
- 資料中心中人工智慧和機器學習工作負載的激增。
- 高解析度遊戲和電競顯示器的廣泛應用。
- 美國各地雲端遊戲基礎設施的擴張
- 媒體和娛樂工作流程中對內容創作的需求日益成長
- 《晶片法案》下的津貼正在促進國內GPU的生產。
- 汽車製造商採用獨立GPU來實現高階駕駛輔助系統。
- 市場限制因素
- 供應鏈對先進節點製造能力的脆弱性
- 人們越來越關注資料中心高階GPU的能耗問題。
- 入門級PC中整合GPU的蠶食
- 地緣政治出口限制阻礙了中國與代工廠的合作
- 產業價值鏈分析
- 監理情勢
- 技術展望
- 宏觀經濟因素對市場的影響
- 波特五力分析
第5章 市場規模與成長預測
- 透過設備應用程式
- 行動裝置和平板電腦
- 個人電腦和工作站
- 伺服器和資料中心加速器
- 遊戲主機和掌上型遊戲機
- 汽車/ADAS
- 其他嵌入式和邊緣設備
- 按記憶體類型
- 配備 GDDR 記憶體的 GPU
- 配備 HBM 記憶體的 GPU
- 性能等級
- 低成本GPU(100美元以下)
- 主流GPU(100美元 - 400美元)
- 高效能消費級GPU(400美元至1200美元)
- 資料中心/AI加速器GPU(超過1200美元)
第6章 競爭情勢
- 市場集中度
- 策略趨勢
- 市佔率分析
- 公司簡介
- NVIDIA Corporation
- Advanced Micro Devices, Inc.
- Intel Corporation
- Qualcomm Technologies, Inc.
- Apple Inc.
- Samsung Electronics Co., Ltd.
- Imagination Technologies Limited
- Arm Holdings plc
- Tenstorrent Inc.
- Graphcore Ltd.
- Cerebras Systems Inc.
- Broadcom Inc.
- Marvell Technology, Inc.
- ASUSTeK Computer Inc.
- Giga-Byte Technology Co., Ltd.
- ASRock Inc.
- EVGA Corporation
- Super Micro Computer, Inc.
- Dell Technologies Inc.
- Hewlett Packard Enterprise Company
第7章 市場機會與未來展望
According to Mordor Intelligence, the united states discrete GPU market size was valued at USD 16.67 billion in 2025 and estimated to grow from USD 19.09 billion in 2026 to reach USD 42.20 billion by 2031, at a CAGR of 17.19% during the forecast period (2026-2031).
This report is Segmented by Device Application (Mobile Devices and Tablets, Pcs and Workstations, Servers and Datacenter Accelerators, Gaming Consoles, and More), Memory Type (GDDR-Based GPUs, and HBM-Based GPUs), Performance Tier (Low-Cost GPUs, Mainstream GPUs, High-Performance Consumer GPUs, and Data Center/AI Accelerator GPUs). The Market Forecasts are Provided in Terms of Value (USD).
United States Discrete GPU Market Trends and Insights
Proliferation Of AI And Machine Learning Workloads In Data Centers
Hyperscalers have moved from episodic refresh cycles to continuous fleet expansion, driven by large-language-model inference that demands sustained compute availability. OpenAI signed a multi-year contract for AMD Instinct MI400 accelerators equal to 6 GW of datacenter capacity, while Meta committed to a matching 6 gigawatts in early 2026. Despite record construction, only 23% of planned U.S. data-center capacity through 2026 has secured firm utility interconnects, tilting procurement criteria toward performance-per-watt. NVIDIA's Rubin platform addresses this by cutting idle draw 40% through liquid cooling and dynamic voltage scaling.Vendors demonstrating sub-300-watt TDP for inference stand to win disproportionate allocations as grid constraints tighten.
CHIPS Act Subsidies Stimulating Domestic GPU Production
Federal incentives are re-shaping the production map. Intel's USD 7.86 billion award funds four advanced fabs that will bring 18-angstrom process capacity onstream in 2027. TSMC's Arizona complex, backed by USD 6.6 billion, adds six fabs plus advanced CoWoS packaging, enabling onshore integration of HBM stacks. Close proximity between design, fab, and packaging is projected to compress tape-out-to-volume timelines from 18 months to under 12 months. Micron's planned HBM facility in New York further diversifies supply, mitigating reliance on overseas memory providers.
Supply Chain Vulnerability To Advanced Node Manufacturing Capacity
TSMC and Samsung control above 90% of global sub-7-nanometer capacity, and both are running at near-full utilization through 2026. NVIDIA's Blackwell GPUs rely on TSMC's 4 nm process with CoWoS -L packaging that is also used by Apple's A-series processors, lengthening lead times for GPU wafers. AMD's MI400 uses TSMC 3 nm, yet volume is capped until late 2026. Although Intel's 18-angstrom node provides a prospective hedge, its yields remain unproven. Limited foundry headroom empowers incumbents with multiyear wafer agreements while constraining new entrants.
Other drivers and restraints analyzed in the detailed report include:
- Expansion Of Cloud Gaming Infrastructure Across The United States
- Rise In High-Resolution Gaming And Esports Monitor Adoption
- Growing Energy Consumption Concerns Of High-End GPUs In Data Centers
For complete list of drivers and restraints, kindly check the Table Of Contents.
Segment Analysis
Servers and datacenter accelerators accounted for 41.62% of shipments in 2025 within the United States discrete GPU market, reflecting the pivot from gamer-centric demand to AI inference clusters. The United States discrete GPU market size attributed to this segment is set to widen further as hyperscalers deploy millions of additional accelerators under multi-year roadmaps. PCs and workstations, once the backbone of volumes, now trail at roughly 30%, pressured by integrated GPU gains and longer replacement cycles. Gaming consoles remain niche, while automotive ADAS designs such as NVIDIA DRIVE Thor introduce fresh high-ASP pockets.
The remainder of the unit volume is split across mobile, embedded vision, and edge servers, each consuming specialized SKUs. Edge inference gateways in retail analytics, smart factories, and healthcare imaging illustrate early but material opportunities. Given sustained hyperscaler appetite, datacenter demand has become secular rather than cyclical, positioning the segment to surpass 50% of the United States discrete GPU market revenues before 2028.
Complete Report Scope:
- By Device Application
- Mobile Devices and Tablets
- PCs and Workstations
- Servers and Datacenter Accelerators
- Gaming Consoles and Handhelds
- Automotive / ADAS
- Other Embedded and Edge Devices
- By Memory Type
- GDDR-based GPUs
- HBM-based GPUs
- By Performance Tier
- Low-Cost GPUs (less than 100 USD)
- Mainstream GPUs (100 USD to 400 USD)
- High-Performance Consumer GPUs (400 USD to 1,200 USD)
- Data Center / AI Accelerator GPUs (greater than 1,200 USD)
List of Companies Covered in this Report:
- NVIDIA Corporation
- Advanced Micro Devices, Inc.
- Intel Corporation
- Qualcomm Technologies, Inc.
- Apple Inc.
- Samsung Electronics Co., Ltd.
- Imagination Technologies Limited
- Arm Holdings plc
- Tenstorrent Inc.
- Graphcore Ltd.
- Cerebras Systems Inc.
- Broadcom Inc.
- Marvell Technology, Inc.
- ASUSTeK Computer Inc.
- Giga-Byte Technology Co., Ltd.
- ASRock Inc.
- EVGA Corporation
- Super Micro Computer, Inc.
- Dell Technologies Inc.
- Hewlett Packard Enterprise Company
Additional Benefits:
- The market estimate (ME) sheet in Excel format
- 3 months of analyst support
TABLE OF CONTENTS
1 INTRODUCTION
- 1.1 Study Assumptions and Market Definition
- 1.2 Scope of the Study
2 RESEARCH METHODOLOGY
3 EXECUTIVE SUMMARY
4 MARKET LANDSCAPE
- 4.1 Market Overview
- 4.2 Market Drivers
- 4.2.1 Proliferation of AI and Machine Learning Workloads in Data Centers
- 4.2.2 Rise in High-Resolution Gaming and Esports Monitor Adoption
- 4.2.3 Expansion of Cloud Gaming Infrastructure Across the United States
- 4.2.4 Accelerated Content Creation Demands in Media and Entertainment Workflows
- 4.2.5 CHIPS Act Subsidies Stimulating Domestic GPU Production
- 4.2.6 Automotive OEM Adoption of Discrete GPUs for Advanced Driver-Assistance Systems
- 4.3 Market Restraints
- 4.3.1 Supply Chain Vulnerability to Advanced Node Manufacturing Capacity
- 4.3.2 Growing Energy Consumption Concerns of High-End GPUs in Data Centers
- 4.3.3 Cannibalization by Integrated GPUs in Entry-Level PCs
- 4.3.4 Geopolitical Export Controls Limiting Chinese Foundry Collaboration
- 4.4 Industry Value-Chain Analysis
- 4.5 Regulatory Landscape
- 4.6 Technological Outlook
- 4.7 Impact of Macroeconomic Factors on the Market
- 4.8 Porter's Five Forces Analysis
- 4.8.1 Threat of New Entrants
- 4.8.2 Bargaining Power of Suppliers
- 4.8.3 Bargaining Power of Buyers
- 4.8.4 Threat of Substitutes
- 4.8.5 Competitive Rivalry
5 MARKET SIZE AND GROWTH FORECASTS (VALUE)
- 5.1 By Device Application
- 5.1.1 Mobile Devices and Tablets
- 5.1.2 PCs and Workstations
- 5.1.3 Servers and Datacenter Accelerators
- 5.1.4 Gaming Consoles and Handhelds
- 5.1.5 Automotive / ADAS
- 5.1.6 Other Embedded and Edge Devices
- 5.2 By Memory Type
- 5.2.1 GDDR-based GPUs
- 5.2.2 HBM-based GPUs
- 5.3 By Performance Tier
- 5.3.1 Low-Cost GPUs (less than 100 USD)
- 5.3.2 Mainstream GPUs (100 USD to 400 USD)
- 5.3.3 High-Performance Consumer GPUs (400 USD to 1,200 USD)
- 5.3.4 Data Center / AI Accelerator GPUs (greater than 1,200 USD)
6 COMPETITIVE LANDSCAPE
- 6.1 Market Concentration
- 6.2 Strategic Moves
- 6.3 Market Share Analysis
- 6.4 Company Profiles (includes Global Level Overview, Market Level Overview, Core Segments, Financials as available, Strategic Information, Market Rank/Share, Products and Services, Recent Developments)
- 6.4.1 NVIDIA Corporation
- 6.4.2 Advanced Micro Devices, Inc.
- 6.4.3 Intel Corporation
- 6.4.4 Qualcomm Technologies, Inc.
- 6.4.5 Apple Inc.
- 6.4.6 Samsung Electronics Co., Ltd.
- 6.4.7 Imagination Technologies Limited
- 6.4.8 Arm Holdings plc
- 6.4.9 Tenstorrent Inc.
- 6.4.10 Graphcore Ltd.
- 6.4.11 Cerebras Systems Inc.
- 6.4.12 Broadcom Inc.
- 6.4.13 Marvell Technology, Inc.
- 6.4.14 ASUSTeK Computer Inc.
- 6.4.15 Giga-Byte Technology Co., Ltd.
- 6.4.16 ASRock Inc.
- 6.4.17 EVGA Corporation
- 6.4.18 Super Micro Computer, Inc.
- 6.4.19 Dell Technologies Inc.
- 6.4.20 Hewlett Packard Enterprise Company
7 MARKET OPPORTUNITIES AND FUTURE OUTLOOK
- 7.1 White-space and Unmet-Need Assessment

