


 |
市場調查報告書
商品編碼
2065741
影片串流:市場佔有率分析、產業趨勢與統計、成長預測(2026-2031)Video Streaming - Market Share Analysis, Industry Trends & Statistics, Growth Forecasts (2026 - 2031) |
||||||

※ 本網頁內容可能與最新版本有所差異。詳細情況請與我們聯繫。
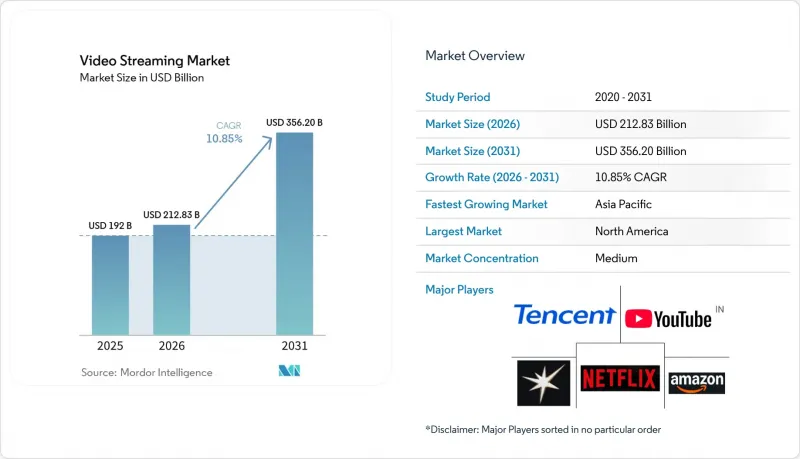
根據 Mordor Intelligence 估計,到 2026 年,影片串流媒體市值將達到 2128.3 億美元,高於 2025 年的 1920 億美元,預計到 2031 年將達到 3562 億美元。
預計從 2026 年到 2031 年,其複合年成長率將達到 10.85%。
本報告按串流媒體類型(直播影片串流、非線性/VOD串流)、組件(軟體、服務)、解決方案(OTT、IPTV等)、平台(智慧型手機/平板電腦、智慧電視、筆記型電腦/桌上型電腦等)、收入模式(訂閱、廣告、租賃/交易)、部署類型(雲端、本地部署)、最終用戶(消費者、企業)和地區進行分類。
全球影片串流媒體市場趨勢及洞察
高速網路連線的擴展
光纖和5G的部署顯著提高了高位元率服務的標準,為影片串流媒體市場奠定了更堅實的基礎。到2025年,5G用戶將超過28億,美國固定無線接取用戶數量將以每季數十萬戶的速度成長。印度和印尼的通訊業者推出了低價5G資料包,優先保障主流串流應用,將新用戶直接引入加值內容生態系統。同時,拉丁美洲校園範圍內的Wi-Fi 6升級提高了4K視訊的持續吞吐量,使當地廣播公司能夠提供符合演播室安全要求的輔助串流服務。隨著區域連線速度的提升,雲端平台的流量也出現了兩位數的成長,證實了頻寬仍然是推動訂閱和廣告收入成長的主要動力。
體育賽事直播和賽事串流的日益普及。
2025年,隨著各大聯盟推出「數位優先」套餐,體育賽事直播迅速從有線電視轉向網路。根據Hub Research的數據顯示,69%的球迷透過串流媒體服務觀看比賽,首次超過了傳統電視直播。與NFL、NBA、西甲和IPL等聯盟的轉播權協議導致每晚並發連線數激增,迫使網路營運商最佳化低延遲線路並改善即時廣告插入技術。 35歲以下的年輕觀眾貢獻了近一半的新增體育發送服務新契約,證明了將直播影像與互動統計數據疊加的平台所採取的積極舉措是合理的。廣告商也紛紛效仿,將品牌預算轉移到直播串流的插播廣告和動態橫幅廣告,從而獲得了比一般娛樂內容更高的CPM(每千次展示成本)。
內容盜版和未經授權的分發
儘管執法力度加大,非法傳播仍導致了收入損失。根據《2024年亞洲影片產業報告》,印度、馬來西亞和越南已頒布新的法律,旨在打擊盜版IPTV機上盒。按次付費(PPV)體育內容仍然是盜版最嚴重的類別,版權所有者現在會在影片中嵌入取證浮水印,以便追蹤每個帳戶。雖然技術措施減少了意外盜版,但網域移除和鏡像網站重新出現的持續鬥爭意味著,缺乏強大法律團隊的小規模服務商將繼續流失用戶,從而削弱影片串流媒體市場的整體成長潛力。
細分市場分析
直播正處於最快的成長軌道,預計從2026年到2031年將以14.4%的複合年成長率成長,因為聯賽和演唱會組織者紛紛選擇直接直播。 2025年,直播影片市場規模達到744.206億美元,預計到2031年將超過1,693億美元,呈現出強勁的成長動能。非線性/視訊點播(VOD)保持了其主導地位,在2025年佔據了61.25%的市場佔有率,這得益於其豐富的片庫和強大的建議引擎,這些引擎推動了各大平台超過80%的播放量。
體育賽事直播將串流平台轉變為重大賽事期間的主要觀看管道,彌合了有線電視的可靠性和網路的柔軟性之間的認知差距。即時互動工具,例如備選說明音軌和應用程式內商品鏈接,開闢了新的收入來源並延長了用戶觀看時長。同時,點播服務不斷改進其壓縮和預取策略,在成本效益和更清晰的影像品質之間取得平衡,從而鞏固了其在更廣泛的影片串流市場中的基石地位。
至2025年,軟體元件(播放器、內容管理系統和分析層)佔總收入的59.15%。然而,隨著發行商將高度專業化的分發營運外包,諸如多CDN編配和伺服器端廣告插入等託管服務預計將實現16.1%的複合年成長率。邊緣感知流量控制即使在全球高峰期也能確保低延遲,從而維護了影片串流媒體市場因早期採用該軟體而獲得的經濟效益。
服務需求的激增與廣告支援型套餐的擴展密切相關,因為伺服器端廣告插入 (SSAI) 技術使得個人化廣告能夠嵌入直播串流中,且幾乎不會出現緩衝。像 Akamai 這樣的服務供應商在應對 2024 年超過 200 Tbps 的流量高峰時,展現了其對第三方技術在基礎設施方面的依賴。在合規性和可訪問性法規日益嚴格的背景下,承包字幕和數位版權管理 (DRM) 服務吸引了許多中型平台的關注,這些平台希望在專注於講故事的同時,有效管理風險。
2025年,OTT(Over-the-Top)繼續佔據56.20%的收入佔有率,這得益於其不受設備限制的覆蓋範圍和直接收費系統。從個人化檔案到「觀影派對」模式等功能的持續推出,提高了已訂閱多個服務的家庭用戶的留存率。 IPTV以13.1%的複合年成長率復甦,為不斷發展的影片串流市場帶來了穩定性,通訊業者更新了FTTH(光纖到戶)套餐,保證了對稱頻寬並捆綁了本地語言套件。
當營運商將OTT應用整合到機上盒中時,混合經營模式應運而生,即使對於不熟悉技術的觀眾來說,也創造出極具吸引力的「一鍵操控」體驗。先進的多播技術實現了超高清直播頻道的高效傳輸,而人工智慧驅動的電子節目指南(EPG)則讓觀眾發現了那些被埋沒在節目庫中的精彩內容。現有的有線電視和衛星電視營運商利用現有的體育賽事轉播契約,將可選的4K串流媒體服務打包出售,但這只能延緩而非阻止市場佔有率向全IP傳輸的長期轉變。
區域分析
到2025年,北美將佔全球整體收入的41.85%。這主要得益於寬頻普及率的提高、對原創內容的大力投資以及廣告支援的混合服務的早期應用。光是在美國,串流媒體收入預計將從2024年的1,120億美元成長到2029年的1,400億美元,進一步鞏固其在影片串流市場的核心地位。由於每個家庭平均同時使用五項付費服務,用戶轉換率居高不下,迫使平台輪換推出折扣套餐,並調整從院線發行到串流媒體的過渡期,以將月度解約率控制在3%以下。加拿大也出現了類似的趨勢,但區域廣播公司獲得了本地體育賽事的轉播權,從而保護了以全國性賽事為主要受眾的觀眾的偏好。
亞太地區以16.8%的複合年成長率(CAGR)領先各大區域,預計2029年營收將達162億美元。印度貢獻了超過四分之一的成長,這主要得益於折扣行動資料方案和獨家板球賽事轉播。同時,中國依靠國營通訊業者加速了光纖到府(FTTH)的普及。日本透過將動畫與高預算電視劇相結合,保持了其在用戶平均收入(ARPU)方面的領先地位。 JioCinema等本土平台建立了一種結合低價套餐和按日付費模式的商業模式,目前東南亞正在效仿。用戶生成的短影片進一步推動了影片串流媒體市場的發展,同時也帶動了優質長篇內容庫的成長。
歐洲市場的發展動能依然強勁,預計到2027年,英國將成為歐洲最大的娛樂市場。這主要歸功於廣告支援型付費方案在對成本敏感的家庭中找到了目標受眾。 2025年第一季,英國新增用戶中有33%選擇了廣告支援型付費方案,其中Prime Video比17%。德國等市場針對資料中心推出了更嚴格的二氧化碳排放揭露法規,推動了更環保的轉碼器策略;而法國則提高了本地內容的配額,影響了內容收購計畫。
在拉丁美洲和中東及非洲地區,儘管絕對收入有所下降,但隨著智慧型手機普及率和行動寬頻升級達到關鍵節點,用戶數量實現了強勁的兩位數成長。 SVOD(訂閱視訊點播)的成長推動了全部區域Wi-Fi 6的部署,從而提高了平均串流媒體位元率。奈及利亞一家通訊業者試行對教育頻道實施零費率,進而刺激了對商業娛樂內容的額外需求。這表明,在不斷成長的影片串流媒體市場中,資料通訊通訊業者和OTT(網路電視)服務供應商之間存在著互惠互利的關係。
其他好處:
- Excel格式的市場預測(ME)表
- 3個月的分析師支持
目錄
第1章:引言
- 研究假設和市場定義
- 調查範圍
第2章:調查方法
第3章執行摘要
第4章 市場狀況
- 市場概覽
- 市場促進因素
- 高速網路連線的擴展
- 體育賽事直播日益普及
- 智慧電視和連網OTT設備的普及
- 人工智慧驅動的在地化配音正在幫助觸達非英語地區的觀眾。
- 新興市場通訊業者對OTT數據實施零費率
- 用於體育場館內直播的 5G多播/廣播 (eMBMS)
- 市場限制因素
- 內容盜版和未經授權的分發
- 內容許可費和製作成本不斷上漲
- 檢驗串流媒體分發的碳足跡
- 由於轉碼器標準的分散化而導致的設備相關問題
- 價值鏈分析
- 監理情勢
- 技術展望
- 波特五力分析
- 投資分析
- 評估宏觀經濟因素對市場的影響
第5章 市場規模與成長預測
- 按串流媒體類型
- 即時影片串流
- 非線性/視訊點播串流媒體
- 按組件
- 軟體
- 服務
- 透過解決方案
- Over-The-Top(OTT)
- 網路協定電視(IPTV)
- 有線電視
- 付費電視
- 按平台
- 智慧型手機和平板電腦
- 智慧電視
- 筆記型電腦和桌上型電腦
- 遊戲機
- 按收入模式
- 訂閱(SVOD)
- 廣告(AVOD/FAST)
- 租賃/交易(TVOD)
- 依部署類型
- 雲
- 現場
- 最終用戶
- 消費者
- 公司
- 按地區
- 北美洲
- 美國
- 加拿大
- 墨西哥
- 南美洲
- 巴西
- 阿根廷
- 其他南美國家
- 歐洲
- 英國
- 德國
- 法國
- 義大利
- 西班牙
- 俄羅斯
- 其他歐洲國家
- 亞太地區
- 中國
- 印度
- 日本
- 韓國
- 澳洲和紐西蘭
- 其他亞太國家
- 中東和非洲
- 中東
- 海灣合作理事會國家(沙烏地阿拉伯、阿拉伯聯合大公國、卡達)
- 土耳其
- 其他中東國家
- 非洲
- 南非
- 奈及利亞
- 其他非洲國家
- 中東
- 北美洲
第6章 競爭情勢
- 市場集中度
- 策略趨勢
- 市佔率分析
- 公司簡介
- Netflix Inc.
- Amazon.com Inc.(Prime Video)
- Alphabet Inc.(YouTube)
- The Walt Disney Company(Disney+, Hulu)
- Warner Bros. Discovery Inc.(Max)
- Tencent Holdings Ltd.(Tencent Video)
- Apple Inc.(Apple TV+)
- JioCinema
- Crunchyroll LLC
- Akamai Technologies Inc.
- iQIYI Inc.
- DAZN Group
- fuboTV Inc.
- Kaltura Inc.
- Vimeo Inc.
- Disney+Hotstar
- iQIYI Inc.
- Bilibili Inc.
- PCCW Media(Viu)
- Rakuten Group Inc.(Rakuten Viki)
- Reliance Industries Ltd.(JioCinema)
- Zee Entertainment Enterprises Ltd.(ZEE5)
- Sky Group Ltd.(NOW)
- Telefonica SA(Movistar+)
- Dish Network Corp.(Sling TV)
第7章 市場機會與未來展望
According to Mordor Intelligence, video streaming market size in 2026 is estimated at USD 212.83 billion, growing from 2025 value of USD 192.0 billion with 2031 projections showing USD 356.2 billion, growing at 10.85% CAGR over 2026-2031.
This report is Segmented by Streaming Type (Live Video Streaming, Non-Linear / VOD Streaming), Component (Software, Services), Solutions (Over-The-Top, Internet Protocol TV, and More), Platform (Smartphones and Tablets, Smart TV, Laptops and Desktops, and More), Revenue Model (Subscription, Advertising, Rental / Transactional), Deployment Type (Cloud, On-Premises), End User (Consumer, Enterprise), and Geography.
Global Video Streaming Market Trends and Insights
Growing Availability of High-Speed Internet Connectivity
The rollout of fiber and 5G radically raised the ceiling for bit-rate-intensive services and set a stronger baseline for the video streaming market. By 2025 more than 2.8 billion 5G subscriptions were in service, and fixed-wireless access added several hundred thousand households each quarter in the United States . Operators in India and Indonesia introduced low-cost 5G data packs that prioritized major streaming apps, pulling first-time viewers directly into premium content ecosystems. In parallel, campus-wide Wi-Fi 6 upgrades in Latin America lifted sustained 4 K throughput, enabling local broadcasters to launch companion streaming services that met studio security requirements. Cloud platforms recorded double-digit traffic spikes with every regional speed upgrade, confirming that bandwidth remains the primary flywheel for subscription and advertising revenue expansion.
Rising Popularity of Live Sports and Event Streaming
Live sports migrated quickly from cable to online in 2025 as top leagues sold digital-first packages. A Hub study showed that 69% of fans viewed matches on streaming services, edging out linear broadcast for the first time. Rights deals with the NFL, NBA, La Liga, and IPL translated into nightly surges in concurrent streams, pressuring networks to refine low-latency paths and real-time ad stitching. Younger viewers under 35 drove nearly half of all new sports subscriptions, validating aggressive bids by platforms that pair live feeds with interactive stats overlays. Advertisers followed, shifting brand budgets toward mid-roll and dynamic banner formats embedded in live streams, thus boosting CPMs relative to general entertainment content.
Content Piracy and Unauthorized Distribution
Illicit restreaming siphoned revenue even as enforcement improved. The Asia Video Industry Report for 2024 documented new blocking statutes in India, Malaysia, and Vietnam that targeted pirate IPTV boxes. Sports pay-per-view content remained the most pirated category, prompting rightsholders to embed forensic watermarking that traces each account. While technical counter-measures reduced casual piracy, the perpetual game of domain takedown versus mirror site re-appearance meant that smaller services without robust legal teams continued to lose prospective subscribers, cutting into the aggregate video streaming market growth potential.
Other drivers and restraints analyzed in the detailed report include:
- Proliferation of Smart-TVs and Connected OTT Devices
- AI-Driven Localized Dubbing Unlocking Non-English Audiences
- Escalating Content Licensing and Production Costs
For complete list of drivers and restraints, kindly check the Table Of Contents.
Segment Analysis
Live streaming posted the fastest trajectory, rising at a 14.4% CAGR from 2026 to 2031 as leagues and concert promoters chose direct distribution. The video streaming market size for live formats stood at USD 74420.6 million in 2025 and is expected to surpass USD 169.3 billion by 2031, indicating a dramatic scaling curve. Non-linear/VOD retained dominance due to its 61.25% share in 2025, backed by expansive libraries and robust recommendation engines that propelled over 80% of total plays on major services.
Live sports coverage turned streaming platforms into primary destinations during key tournaments, narrowing the perception gap between cable reliability and online flexibility. Real-time engagement tools such as alternate commentary tracks and in-app merch links unlocked fresh revenue streams and extended session duration. Meanwhile, on-demand services continued to refine compression and pre-fetching strategies that balanced cost efficiency with sharper picture quality, reinforcing their foundational role inside the broader video streaming market.
Software components-players, CMS, analytics layers-accounted for 59.15% of 2025 revenue. However, managed services such as multi-CDN orchestration and server-side ad insertion registered a 16.1% CAGR forecast as publishers outsourced highly specialized delivery tasks. Edge-aware traffic steering ensured low latency during peak global events, which safeguarded the video streaming market size advantages secured by early software adoption.
The surge in services aligned with ad-supported tier expansion because SSAI blended personalized ads into live streams without overt buffering. Providers like Akamai handled traffic bursts that peaked at more than 200 Tbps in 2024, demonstrating infrastructure reliance on third-party expertise. As compliance and accessibility rules tightened, turnkey captioning and DRM services attracted mid-tier platforms keen to manage risk while staying focused on storytelling.
OTT retained a 56.20% grip on revenue in 2025 thanks to its device-agnostic reach and direct billing. Continuous feature rollouts-from personalized profiles to watch-party modes-raised stickiness among households already juggling multiple subscriptions. IPTV rebounded with a 13.1% CAGR after telcos refreshed fiber-to-the-home bundles that guaranteed symmetric bandwidth and bundled local language packs, thereby adding stability to the evolving video streaming market.
Hybrid business models emerged as operators integrated OTT apps into set-top boxes, ensuring single-remote access that appealed to less tech-savvy viewers. Advanced multicast pushed ultra-HD linear channels efficiently, and AI-enhanced EPGs exposed hidden catalog gems. Cable and satellite incumbents leveraged existing sports contracts to package optional 4K streams, delaying but not preventing a long-term share drift toward full IP delivery.
Geography Analysis
North America held 41.85% of global revenue in 2025 as ubiquitous broadband, aggressive original content budgets, and early adoption of advertising hybrids converged. The United States alone is projected to lift streaming revenue from USD 112 billion in 2024 to USD 140 billion by 2029, reinforcing its anchor role in the video streaming market. Competitive churn remained high because households stacked an average of five paid services, prompting platforms to rotate discount bundles and theater-to-stream windows to keep churn below 3% monthly. Canada mirrored these patterns, although regional broadcasters preserved local sports rights that sheltered nationalist viewer preferences.
Asia-Pacific delivered the fastest regional CAGR at 16.8% and is forecast to add USD 16.2 billion in incremental revenue by 2029. India contributed more than one-quarter of the uplift, fueled by discounted mobile data plans and exclusive cricket streaming, while China leaned on state-owned telcos to accelerate FTTH. Japan blended anime with high-budget serials to maintain ARPU leadership. Local platforms such as JioCinema forged low-price tiers paired with daily payment options, a model now copied in Southeast Asia. The video streaming market size gained additional momentum from user generated short-form clips that acted as funnels into premium long-form libraries.
Europe retained solid traction, and the United Kingdom is set to become the continent's largest entertainment market by 2027 as ad-supported tiers find an addressable audience in cost-sensitive households. Thirty-three percent of new UK sign-ups in Q1 2025 selected an ad tier, and Prime Video captured 17% of those activations. Markets such as Germany tightened CO2 disclosure rules for datacenters, prompting greener codec strategies, while France advanced local content quotas that shaped catalog acquisition plans.
Latin America and the Middle East and Africa registered lower absolute revenue but posted healthy double-digit user growth as smart-phone penetration and mobile broadband upgrades reached critical mass. SVOD growth encouraged Wi-Fi 6 adoption across the region, which in turn improved average streaming bit-rates. Nigeria's telcos trialed zero-rated educational channels that steered incremental demand toward commercial entertainment, illustrating mutual benefits between operators and OTT providers in the continually widening video streaming market.
- Netflix Inc.
- Amazon.com Inc. (Prime Video)
- Alphabet Inc. (YouTube)
- The Walt Disney Company (Disney+, Hulu)
- Warner Bros. Discovery Inc. (Max)
- Tencent Holdings Ltd. (Tencent Video)
- Apple Inc. (Apple TV+)
- JioCinema
- Crunchyroll LLC
- Akamai Technologies Inc.
- iQIYI Inc.
- DAZN Group
- fuboTV Inc.
- Kaltura Inc.
- Vimeo Inc.
- Disney+ Hotstar
- iQIYI Inc.
- Bilibili Inc.
- PCCW Media (Viu)
- Rakuten Group Inc. (Rakuten Viki)
- Reliance Industries Ltd. (JioCinema)
- Zee Entertainment Enterprises Ltd. (ZEE5)
- Sky Group Ltd. (NOW)
- Telefonica S.A. (Movistar+)
- Dish Network Corp. (Sling TV)
Additional Benefits:
- The market estimate (ME) sheet in Excel format
- 3 months of analyst support
TABLE OF CONTENTS
1 INTRODUCTION
- 1.1 Study Assumptions and Market Definition
- 1.2 Scope of the Study
2 RESEARCH METHODOLOGY
3 EXECUTIVE SUMMARY
4 MARKET LANDSCAPE
- 4.1 Market Overview
- 4.2 Market Drivers
- 4.2.1 Growing availability of high-speed internet connectivity
- 4.2.2 Rising popularity of live sports and event streaming
- 4.2.3 Proliferation of smart-TVs and connected OTT devices
- 4.2.4 AI-driven localized dubbing unlocking non-English audiences
- 4.2.5 Telco zero-rating of OTT data in emerging markets
- 4.2.6 5G multicast/broadcast (eMBMS) for in-stadium live feeds
- 4.3 Market Restraints
- 4.3.1 Content piracy and unauthorized distribution
- 4.3.2 Escalating content licensing and production costs
- 4.3.3 Carbon-footprint scrutiny of streaming delivery
- 4.3.4 Codec-standard fragmentation causing device issues
- 4.4 Value Chain Analysis
- 4.5 Regulatory Landscape
- 4.6 Technological Outlook
- 4.7 Porter's Five Forces Analysis
- 4.7.1 Bargaining Power of Suppliers
- 4.7.2 Bargaining Power of Buyers/Consumers
- 4.7.3 Threat of New Entrants
- 4.7.4 Threat of Substitutes
- 4.7.5 Competitive Rivalry
- 4.8 Investment Analysis
- 4.9 Assessment of the Impact of Macroeconomic factors on the Market
5 MARKET SIZE AND GROWTH FORECASTS (VALUE)
- 5.1 By Streaming Type
- 5.1.1 Live Video Streaming
- 5.1.2 Non-Linear / VOD Streaming
- 5.2 By Component
- 5.2.1 Software
- 5.2.2 Services
- 5.3 By Solutions
- 5.3.1 Over-the-Top (OTT)
- 5.3.2 Internet Protocol TV (IPTV)
- 5.3.3 Cable TV
- 5.3.4 Pay-TV
- 5.4 By Platform
- 5.4.1 Smartphones and Tablets
- 5.4.2 Smart TV
- 5.4.3 Laptops and Desktops
- 5.4.4 Gaming Consoles
- 5.5 By Revenue Model
- 5.5.1 Subscription (SVOD)
- 5.5.2 Advertising (AVOD/FAST)
- 5.5.3 Rental / Transactional (TVOD)
- 5.6 By Deployment Type
- 5.6.1 Cloud
- 5.6.2 On-Premises
- 5.7 By End User
- 5.7.1 Consumer
- 5.7.2 Enterprise
- 5.8 By Geography
- 5.8.1 North America
- 5.8.1.1 United States
- 5.8.1.2 Canada
- 5.8.1.3 Mexico
- 5.8.2 South America
- 5.8.2.1 Brazil
- 5.8.2.2 Argentina
- 5.8.2.3 Rest of South America
- 5.8.3 Europe
- 5.8.3.1 United Kingdom
- 5.8.3.2 Germany
- 5.8.3.3 France
- 5.8.3.4 Italy
- 5.8.3.5 Spain
- 5.8.3.6 Russia
- 5.8.3.7 Rest of Europe
- 5.8.4 Asia-Pacific
- 5.8.4.1 China
- 5.8.4.2 India
- 5.8.4.3 Japan
- 5.8.4.4 South Korea
- 5.8.4.5 Australia and New Zealand
- 5.8.4.6 Rest of Asia-Pacific
- 5.8.5 Middle East and Africa
- 5.8.5.1 Middle East
- 5.8.5.1.1 GCC Countries (Saudi Arabia, UAE, Qatar)
- 5.8.5.1.2 Turkey
- 5.8.5.1.3 Rest of Middle East
- 5.8.5.2 Africa
- 5.8.5.2.1 South Africa
- 5.8.5.2.2 Nigeria
- 5.8.5.2.3 Rest of Africa
- 5.8.5.1 Middle East
- 5.8.1 North America
6 COMPETITIVE LANDSCAPE
- 6.1 Market Concentration
- 6.2 Strategic Moves
- 6.3 Market Share Analysis
- 6.4 Company Profiles {(includes Global level Overview, Market level overview, Core Segments, Financials as available, Strategic Information, Market Rank/Share for key companies, Products and Services, and Recent Developments)}
- 6.4.1 Netflix Inc.
- 6.4.2 Amazon.com Inc. (Prime Video)
- 6.4.3 Alphabet Inc. (YouTube)
- 6.4.4 The Walt Disney Company (Disney+, Hulu)
- 6.4.5 Warner Bros. Discovery Inc. (Max)
- 6.4.6 Tencent Holdings Ltd. (Tencent Video)
- 6.4.7 Apple Inc. (Apple TV+)
- 6.4.8 JioCinema
- 6.4.9 Crunchyroll LLC
- 6.4.10 Akamai Technologies Inc.
- 6.4.11 iQIYI Inc.
- 6.4.12 DAZN Group
- 6.4.13 fuboTV Inc.
- 6.4.14 Kaltura Inc.
- 6.4.15 Vimeo Inc.
- 6.4.16 Disney+ Hotstar
- 6.4.17 iQIYI Inc.
- 6.4.18 Bilibili Inc.
- 6.4.19 PCCW Media (Viu)
- 6.4.20 Rakuten Group Inc. (Rakuten Viki)
- 6.4.21 Reliance Industries Ltd. (JioCinema)
- 6.4.22 Zee Entertainment Enterprises Ltd. (ZEE5)
- 6.4.23 Sky Group Ltd. (NOW)
- 6.4.24 Telefonica S.A. (Movistar+)
- 6.4.25 Dish Network Corp. (Sling TV)
7 MARKET OPPORTUNITIES AND FUTURE OUTLOOK
- 7.1 White-space and Unmet-Need Assessment

 美國直播基礎設施市場規模、佔有率和趨勢分析報告:按基礎設施組件、部署方式、最終用途和細分市場預測(2026-2033 年)
 OTT邊緣串流基礎設施:市場佔有率分析、產業趨勢與統計及成長預測(2026-2031年)
 影片串流媒體與廣播設備市場-2026-2032年全球市場預測線上電影市場-2026-2032年全球市場預測OTT電視劇:市場佔有率分析、產業趨勢與統計、成長預測(2026-2031)影片串流媒體市場-2026-2032年全球市場預測籃球直播:市場佔有率分析、產業趨勢與統計、成長預測(2026-2031)足球直播:市場佔有率分析、產業趨勢與統計、成長預測(2026-2031)視訊串流基礎設施:市場佔有率分析、產業趨勢與統計、成長預測(2026-2031)
 2026-2030年全球影像串流媒體及廣播設備市場