


 |
市場調查報告書
商品編碼
2099890
籃球直播:市場佔有率分析、產業趨勢與統計、成長預測(2026-2031)Basketball Streaming - Market Share Analysis, Industry Trends & Statistics, Growth Forecasts (2026 - 2031) |
||||||

※ 本網頁內容可能與最新版本有所差異。詳細情況請與我們聯繫。
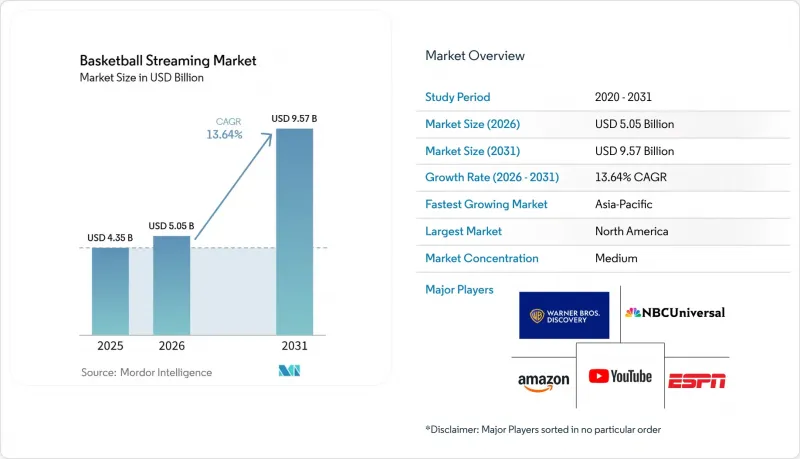
根據 Mordor Intelligence 預測,籃球串流媒體市場預計將在 2025 年達到 43.5 億美元,並在 2026 年至 2031 年以 13.64% 的複合年成長率成長,到 2031 年達到 95.7 億美元。
本報告按裝置類型(智慧型手機和平板電腦、智慧電視、筆記型電腦和桌上型電腦)、內容類型(國際賽事、國內賽事)、串流類型(直播、點播)以及地區(北美、南美、歐洲、亞太、中東和非洲)進行細分。市場預測以美元計價。
全球籃球直播市場趨勢及洞察
D2C(直接面對消費者)聯賽通行證生態系統的擴展
NBA於2024年7月簽署的媒體協議將Prime Video和Peacock與ABC和ESPN置於同等地位,使高階籃球賽事轉入永續的混合模式,流媒體不再僅僅是輔助手段,而是成為全國觀眾獲取賽事的核心。預計到本賽季常規賽結束時,美國的總收視人數將達到相當可觀的水平,全球直播覆蓋範圍也將大幅擴展。這一趨勢表明,數位發行可以在不降低高階轉播權價值的前提下擴大受眾規模。 NBA應用程式上用戶的平均觀看時間預計也將顯著增加,這表明聯盟自有平台正成為提升觀眾參與度和留存率的關鍵管道,而不僅僅是轉播合作夥伴的補充。這種模式使版權所有擁有者能夠更直接地控制定價、套餐結構和觀眾行為。這一點意義重大,因為現在可以更接近購買或續訂點來追蹤用戶的決策。在籃球串流媒體市場,這創造了一個更永續的收入循環,其中發行管理、客戶數據和內容價值隨著時間的推移相互促進。
網路螢幕上的體育賽事直播廣告位價格不斷上漲。
籃球直播持續吸引大規模“預定觀看”,是少數幾種能夠在聯網螢幕上穩定支撐優質廣告的串流內容形式之一。雖然標準的體育賽事直播聯網電視廣告位通常擁有較高的每千次展示成本 (CPM),但互動式和賽事連動廣告單元的 CPM 可能更高,從而提升擁有優質比賽廣告位的平台的收入上限。據 Premion 稱,許多已經在體育賽事直播聯網電視上投放廣告的廣告商計劃在未來 12 個月內增加支出,而許多之前未購買過廣告位的廣告商預計也將進入這一領域。與其他主要依賴少數幾場大型賽事的體育項目不同,籃球的優勢在於,在常規賽期間的許多個夜晚,它都能為平台提供大量的優質廣告位。這種廣告深度在籃球串流媒體市場至關重要,因為它支援一種「雙引擎」模式,即訂閱收入和優質廣告收入共同構成轉播權的變現來源。
跨聯賽、球隊和地區的去中心化所有權
由於籃球內容被分割成國家聯賽套餐、地方球隊套餐和區域性國際協議,版權分散仍然是限制其規模化發展的最明顯結構性因素之一。國際籃球總會(FIBA)的分發結構就清楚地體現了這一點,它針對每個市場(例如德國和中國)制定了單獨的協議,而不是採用統一的全球數位存取模式。 NBA正在進行的區域轉播權過渡進一步加劇了這個問題的複雜性,因為球迷可能仍然需要根據球隊所在地、國家聯賽套餐和賽事類型使用不同的服務。當觀眾無法預測比賽的播出平台時,內容發現的難度就會增加,而單一訂閱的價值也會降低。對於籃球串流媒體市場而言,這意味著球迷的潛在需求很大一部分仍然無法順利轉化為穩定持續的收入。
細分市場分析
到2025年,智慧型手機和平板電腦將佔據籃球串流媒體市場55.23%的佔有率,使行動裝置成為用戶無論身處何地觀看直播和短視訊籃球內容的主要網路基地台。這種主導地位並非僅僅源於便利性;聯賽應用程式、區域服務和國際籃球內容的設計越來越注重快速登入、短影片內容髮現和隨時隨地觀看,從用戶首次接觸這些平台開始就充分考慮了這些需求。迪士尼廣告公司報告稱,到2025年,年輕的體育觀眾將把相當一部分觀看時間花在非電視設備上,這也解釋了為什麼籃球如此適合移動環境。 WSC體育也揭示了Z世代和千禧世代球迷對串流媒體的強烈偏好,進一步印證了籃球串流媒體產業中球迷群體與行動原生行為之間的關聯性。
此外,行動端主導的趨勢與籃球比賽的觀看節奏相契合,球迷通常會在比賽期間多次訪問平台,而不是一次性長時間連續觀看。 NBA 2026年常規賽的數據顯示,近2,000萬次「點擊觀看」直播串流,這印證了快速便捷的行動裝置存取權如今已成為提升用戶參與度的關鍵。智慧電視預計到2031年將以13.86%的複合年成長率成長,這意味著隨著家庭用戶希望在連網家庭娛樂環境中觀看優質體育賽事,客廳串流播放的重要性日益凸顯。這種轉變將推動盈利成長,因為在智慧電視上播放優質體育賽事的版權價格遠高於開放網路影片,隨著用戶螢幕時間轉移到高階設備,版權擁有者將獲得更豐厚的收入。筆記型電腦、桌上型電腦、遊戲機和新興的互動設備雖然在收入方面仍然相對較小,但在籃球直播市場中繼續發揮著重要作用,在這個市場中,人們越來越重視在所有螢幕類型上靈活訪問,而不是單一的主導設備。
區域分析
2025年,北美佔據了籃球串流媒體市場56.66%的佔有率,在籃球觀看付費方面顯著領先其他所有地區。這項領先優勢歸功於NBA強大的媒體基礎設施以及2025-26賽季轉播權的重組,該重組將ABC、ESPN、Peacock、Prime Video和NBA TV整合到一個更廣泛的全國串流媒體週期中。 2026年6月,NBA宣布其例行賽在美國的觀眾人數達1.7億,全球整體直播時間超過13億小時。這凸顯了北美生態系的規模優勢。加拿大也採取了類似的策略,透過強大的體育頻道和直接面對消費者的管道(包括捆綁式和獨立服務)保持了籃球觀看量的穩定成長。雖然南美洲的收入仍然較小,但隨著跨境觀看管道的增加(透過區域平台和國際聯賽的打包發行),籃球串流媒體市場正在不斷擴張。
歐洲的籃球版權格局依然分散,而非統一的整體,各國不同的廣播公司和串流媒體服務商分別負責轉播國際籃球總會(FIBA)、歐洲籃球聯賽(EuroLeague)以及國內聯賽的賽事。 Movistar Plus+和歐洲籃球聯賽已將雙方在西班牙的夥伴關係延長至2030-31賽季,這表明現有的訂閱平台在成熟的歐洲市場仍然扮演著重要角色。雖然這種機制能夠保障持續的收入,但也減緩了直接面對消費者(DTC)的新模式的推廣,因為許多觀眾已經透過付費電視和多運動套餐觀看籃球比賽。預計到2031年,亞太地區的複合年成長率將達到14.23%,成為籃球串流媒體市場成長最快的地區。憑藉國際籃球總會與Miguel在中國的獨家數位合作,以及NBA在全部區域的強勁收視率,該地區在付費觀看和行動主導觀看方面都擁有巨大的長期成長潛力。
在非洲,觀看管道正從有限的觀看環境轉向多層次的接取系統。 2025年11月,NBA將重返SuperSport頻道,並首次透過Showmax在撒哈拉以南非洲的50多個國家播出。 2026年5月,ESPN非洲頻道將獲得NBA總決賽在撒哈拉以南非洲地區的獨家付費電視轉播權,為該地區的發行模式增添高階內容。在中東,體育專屬服務和通訊業者合作的模式正在逐步建立,使觀眾能夠透過熟悉的收費系統觀看優質的籃球內容。在這兩個地區,籃球串流媒體市場最大的成長機會仍然是建立整合本地支付方式、本地語言說明和強大的點播搜尋功能的全面性直接平台。
其他好處:
- Excel格式的市場預測(ME)表
- 3個月的分析師支持
目錄
第1章:引言
- 研究假設和市場定義
- 調查範圍
第2章:調查方法
第3章執行摘要
第4章 市場狀況
- 市場概覽
- 市場促進因素
- 擴展面向消費者的「聯盟通行證」生態系統
- 網路螢幕上的體育賽事直播廣告位價格不斷上漲。
- 「行動優先」的消費趨勢正在年輕的籃球迷中蔓延。
- 與通訊服務和付費電視服務捆綁的合約
- 人工智慧驅動的個人化和特色內容可以提高客戶維繫率。
- 將青少年、大學和國際籃球比賽的轉播權貨幣化。
- 市場限制因素
- 版權所有權分散在各個聯盟、球隊和地區。
- 體育賽事轉播權價格飆升,給利潤率帶來了壓力。
- 盜版和未經授權的再分發正在減少可獲利的覆蓋範圍。
- 寬頻品質不穩定和延遲問題正在阻礙優質直播的流暢播放。
- 產業價值鏈分析
- 宏觀經濟因素對市場的影響
- 監理情勢
- 技術展望
- 波特五力分析
第5章 市場規模與成長預測
- 依設備類型
- 智慧型手機和平板電腦
- 智慧電視
- 筆記型電腦和桌上型電腦
- 其他設備類型
- 按內容類型
- 國際比賽
- 國內比賽
- 其他內容類型
- 按串流媒體類型
- 直播
- 點播串流媒體
- 其他串流媒體類型
- 按地區
- 北美洲
- 美國
- 加拿大
- 墨西哥
- 南美洲
- 巴西
- 阿根廷
- 智利
- 其他南美國家
- 歐洲
- 德國
- 英國
- 法國
- 義大利
- 西班牙
- 其他歐洲國家
- 亞太地區
- 中國
- 日本
- 印度
- 韓國
- 澳洲
- 其他亞太國家
- 中東
- 沙烏地阿拉伯
- 阿拉伯聯合大公國
- 卡達
- 其他中東國家
- 非洲
- 南非
- 埃及
- 奈及利亞
- 其他非洲國家
- 北美洲
第6章 競爭情勢
- 市場集中度
- 策略趨勢
- Vendor Positioning Analysis
- 公司簡介
- ESPN
- Warner Bros. Discovery, Inc.
- Amazon.com, Inc.
- NBCUniversal Media, LLC
- YouTube, LLC
- Paramount Global
- DAZN Limited
- fuboTV Inc.
- NBA Media Ventures, LLC
- Turner Broadcasting System, Inc.
- Eleven Sports Network
- Tencent Holdings Limited
- Viaplay Group AB
- Sky Group Limited
- Walt Disney Company
- Apple Inc.
- Rakuten Group, Inc.
- Sony Group Corporation
- Hudl
- Sportradar Group AG
第7章 市場機會與未來展望
According to Mordor Intelligence, the basketball streaming market size stood at USD 4.35 billion in 2025 and is projected to reach USD 9.57 billion by 2031, at a CAGR of 13.64% from 2026 to 2031.
This report is Segmented by Device Type (Smartphones and Tablets, Smart TVs, and Laptops and Desktops), Content Type (International Matches, and Domestic Matches), Streaming Type (Live Streaming, and On-Demand Streaming), and Geography (North America, South America, Europe, Asia-Pacific, Middle East, and Africa). The Market Forecasts are Provided in Terms of Value (USD).
Global Basketball Streaming Market Trends and Insights
Expansion of Direct-to-Consumer League Pass Ecosystems
The NBA's July 2024 media agreement placed Prime Video and Peacock beside ABC and ESPN, which shifted premium basketball into a lasting hybrid system where streaming sits at the center of national access rather than beside it. By the close of the upcoming regular season, total U.S. viewership is expected to reach a significant level, while global live coverage is projected to expand substantially. This trend shows that digital distribution can expand audience scale without diluting the value of premium rights. Watch hours per user on the NBA App are also expected to increase meaningfully, indicating that owned league platforms are becoming meaningful audience engagement and retention channels rather than support layers for broadcast partners. This model gives rights holders greater direct control over pricing, packaging, and first-party audience behavior, which is important as subscriber decisions can now be tracked closer to the point of purchase and renewal. For the basketball streaming market, this creates a more durable revenue loop in which distribution control, customer data, and content value reinforce each other over time.
Rising Live-Sports Ad Inventory Premiums on Connected Screens
Live basketball continues to deliver appointment viewing at scale, making it one of the few streaming content types that can consistently support premium connected-screen advertising. Standard live sports CTV placements commonly command high CPMs, while interactive or event-triggered units can exceed that range, raising the revenue ceiling for platforms with premium game inventory. Premion reported that most advertisers already active in live sports CTV planned to increase spending over the next 12 months, while many nonbuyers also expected to enter the category. Basketball is particularly well-positioned because the regular season provides platforms with a large volume of premium inventory across many nights, unlike sports that rely primarily on a few tentpole events. In the basketball streaming market, this advertising depth matters because it supports a two-engine model in which subscription revenue and premium advertising both contribute to rights monetization.
Fragmented Rights Ownership Across Leagues, Teams, and Territories
Rights fragmentation remains one of the clearest structural limits on scale because basketball content is divided across national league packages, local team packages, and territory-specific international agreements. FIBA's distribution setup shows this clearly, with separate arrangements across markets such as Germany and China rather than one unified worldwide digital access model. The NBA's ongoing local rights transition adds another layer because fans may still need different services depending on team location, national package, and competition type. When viewers cannot predict where a game will appear, the discovery burden rises, and the value of each individual subscription weakens. For the basketball streaming market, that means a large share of underlying fan demand still does not convert cleanly into stable recurring revenue.
Other drivers and restraints analyzed in the detailed report include:
- Mobile-First Consumption Among Younger Basketball Fans
- Subscription Bundling with Telecom and Pay-TV Offers
- High Sports Rights Inflation Compresses Margins
For complete list of drivers and restraints, kindly check the Table Of Contents.
Segment Analysis
Smartphones and tablets held 55.23% of the basketball streaming market share in 2025, which made mobile the leading access point for both live viewing and short-form basketball consumption across regions. That lead reflects more than convenience because league apps, regional services, and international basketball products are increasingly designed around fast sign-in, short-form discovery, and portable viewing behavior from the first user touchpoint. Disney Advertising reported in 2025 that younger sports audiences already spent most of their viewing time on devices other than television, which helps explain why basketball aligns so well with the mobile environment. WSC Sports also found strong streaming preference among Gen Z and Millennial fans, which reinforces the link between basketball fandom and mobile-native behavior in the basketball streaming industry.
Mobile leadership also fits the rhythm of basketball viewing because fans often check in repeatedly across a game rather than committing only to a single uninterrupted long session. The NBA's 2026 regular-season results showed nearly 20 million live game streams from Tap to Watch, which supports the view that fast, low-friction mobile access is now central to engagement growth. Smart TVs are projected to grow at a 13.86% CAGR through 2031, which shows that living-room streaming is becoming more important as households expect premium sports inside connected home entertainment setups. This shift improves monetization because premium live sports inventory on connected televisions is priced well above open web video, giving rights holders a better revenue mix as screen time migrates upward. Laptops, desktops, consoles, and emerging interactive devices remain smaller in revenue terms, but they still matter because the basketball streaming market increasingly rewards flexible access across every screen type rather than a single dominant device.
Complete Report Scope:
- By Device Type
- Smartphones and Tablets
- Smart TVs
- Laptops and Desktops
- Other Device Type
- By Content Type
- International Matches
- Domestic Matches
- Other Content Type
- By Streaming Type
- Live Streaming
- On-demand Streaming
- Other Streaming Type
- By Geography
- North America
- United States
- Canada
- Mexico
- South America
- Brazil
- Argentina
- Chile
- Rest of South America
- Europe
- Germany
- United Kingdom
- France
- Italy
- Spain
- Rest of Europe
- Asia-Pacific
- China
- Japan
- India
- South Korea
- Australia
- Rest of Asia-Pacific
- Middle East
- Saudi Arabia
- United Arab Emirates
- Qatar
- Rest of Middle East
- Africa
- South Africa
- Egypt
- Nigeria
- Rest of Africa
- North America
Geography Analysis
North America held 56.66% of the basketball streaming market size in 2025, which kept the region far ahead of every other geography in monetized basketball viewing. The lead rests on the NBA's deep media infrastructure and on the 2025-26 rights reset that placed ABC and ESPN, Peacock, Prime Video, and NBA TV inside one broader national streaming cycle. In June 2026, the NBA said the regular season reached 170 million total U.S. viewers and more than 1.3 billion hours of global live coverage, which underlined the scale advantage of the North American ecosystem. Canada followed a similar path through strong sports network distribution and direct-to-consumer access, which kept basketball discoverable across both bundled and stand-alone products. South America remains smaller in revenue terms, but the basketball streaming market is broadening there as regional platforms and imported league packages extend access to more cross-border competitions.
Europe remains a rights mosaic rather than a single unified basketball zone, with different broadcasters and streamers controlling FIBA, EuroLeague, and domestic league access by country. Movistar Plus+ and EuroLeague extended their Spanish partnership through the 2030-31 season, which shows how incumbent subscription platforms still matter in established European markets. This setup supports recurring revenue, but it also slows greenfield direct-to-consumer expansion because many viewers already receive basketball inside broader pay television or multi-sport bundles. Asia-Pacific is projected to grow at a 14.23% CAGR through 2031, making it the fastest-growing region in the basketball streaming market. FIBA's exclusive digital partnership with Migu in China and strong NBA audience momentum across key Asia-Pacific territories give the region a long runway for both premium and mobile-led viewing.
Africa is moving from limited availability toward multi-tier access, with the NBA returning to SuperSport channels and debuting on Showmax across more than 50 sub-Saharan countries in November 2025. In May 2026, ESPN Africa secured exclusive pay television rights to the NBA Finals across sub-Saharan Africa, which added a premium layer to the regional distribution model. The Middle East is advancing through a mix of dedicated sports services and telecom-linked distribution, which helps premium basketball content reach viewers through familiar billing relationship. Across both regions, the biggest opening in the basketball streaming market is still a unified direct platform that combines local payments, localized commentary, and strong on-demand discovery.
- ESPN
- Warner Bros. Discovery, Inc.
- Amazon.com, Inc.
- NBCUniversal Media, LLC
- YouTube, LLC
- Paramount Global
- DAZN Limited
- fuboTV Inc.
- NBA Media Ventures, LLC
- Turner Broadcasting System, Inc.
- Eleven Sports Network
- Tencent Holdings Limited
- Viaplay Group AB
- Sky Group Limited
- Walt Disney Company
- Apple Inc.
- Rakuten Group, Inc.
- Sony Group Corporation
- Hudl
- Sportradar Group AG
Additional Benefits:
- The market estimate (ME) sheet in Excel format
- 3 months of analyst support
TABLE OF CONTENTS
1 INTRODUCTION
- 1.1 Study Assumptions and Market Definition
- 1.2 Scope Of The Study
2 RESEARCH METHODOLOGY
3 EXECUTIVE SUMMARY
4 MARKET LANDSCAPE
- 4.1 Market Overview
- 4.2 Market Drivers
- 4.2.1 Expansion of Direct-To-Consumer League Pass Ecosystems
- 4.2.2 Rising Live-Sports Ad Inventory Premiums on Connected Screens
- 4.2.3 Mobile-First Consumption Among Younger Basketball Fans
- 4.2.4 Subscription Bundling With Telecom and Pay-TV Offers
- 4.2.5 AI-Powered Personalization and Highlights Improve Retention
- 4.2.6 Monetization of Youth, College, and International Basketball Rights
- 4.3 Market Restraints
- 4.3.1 Fragmented Rights Ownership Across Leagues, Teams, and Territories
- 4.3.2 High Sports Rights Inflation Compresses Margins
- 4.3.3 Piracy and Unauthorized Restreaming Reduce Monetizable Reach
- 4.3.4 Variable Broadband Quality and Latency Hurts Premium Live Viewing
- 4.4 Industry Value Chain Analysis
- 4.5 Impact Of Macroeconomic Factors On The Market
- 4.6 Regulatory Landscape
- 4.7 Technological Outlook
- 4.8 Porter's Five Forces Analysis
- 4.8.1 Bargaining Power Of Suppliers
- 4.8.2 Bargaining Power Of Buyers
- 4.8.3 Threat Of New Entrants
- 4.8.4 Threat Of Substitutes
- 4.8.5 Competitive Rivalry
5 MARKET SIZE AND GROWTH FORECASTS (VALUE)
- 5.1 By Device Type
- 5.1.1 Smartphones and Tablets
- 5.1.2 Smart TVs
- 5.1.3 Laptops and Desktops
- 5.1.4 Other Device Type
- 5.2 By Content Type
- 5.2.1 International Matches
- 5.2.2 Domestic Matches
- 5.2.3 Other Content Type
- 5.3 By Streaming Type
- 5.3.1 Live Streaming
- 5.3.2 On-demand Streaming
- 5.3.3 Other Streaming Type
- 5.4 By Geography
- 5.4.1 North America
- 5.4.1.1 United States
- 5.4.1.2 Canada
- 5.4.1.3 Mexico
- 5.4.2 South America
- 5.4.2.1 Brazil
- 5.4.2.2 Argentina
- 5.4.2.3 Chile
- 5.4.2.4 Rest of South America
- 5.4.3 Europe
- 5.4.3.1 Germany
- 5.4.3.2 United Kingdom
- 5.4.3.3 France
- 5.4.3.4 Italy
- 5.4.3.5 Spain
- 5.4.3.6 Rest of Europe
- 5.4.4 Asia-Pacific
- 5.4.4.1 China
- 5.4.4.2 Japan
- 5.4.4.3 India
- 5.4.4.4 South Korea
- 5.4.4.5 Australia
- 5.4.4.6 Rest of Asia-Pacific
- 5.4.5 Middle East
- 5.4.5.1 Saudi Arabia
- 5.4.5.2 United Arab Emirates
- 5.4.5.3 Qatar
- 5.4.5.4 Rest of Middle East
- 5.4.6 Africa
- 5.4.6.1 South Africa
- 5.4.6.2 Egypt
- 5.4.6.3 Nigeria
- 5.4.6.4 Rest of Africa
- 5.4.1 North America
6 COMPETITIVE LANDSCAPE
- 6.1 Market Concentration
- 6.2 Strategic Moves
- 6.3 Vendor Positioning Analysis
- 6.4 Company Profiles (includes Global Level Overview, Market Level Overview, Core Segments, Financials as available, Strategic Information, Market Rank/Share, Products and Services, Recent Developments)
- 6.4.1 ESPN
- 6.4.2 Warner Bros. Discovery, Inc.
- 6.4.3 Amazon.com, Inc.
- 6.4.4 NBCUniversal Media, LLC
- 6.4.5 YouTube, LLC
- 6.4.6 Paramount Global
- 6.4.7 DAZN Limited
- 6.4.8 fuboTV Inc.
- 6.4.9 NBA Media Ventures, LLC
- 6.4.10 Turner Broadcasting System, Inc.
- 6.4.11 Eleven Sports Network
- 6.4.12 Tencent Holdings Limited
- 6.4.13 Viaplay Group AB
- 6.4.14 Sky Group Limited
- 6.4.15 Walt Disney Company
- 6.4.16 Apple Inc.
- 6.4.17 Rakuten Group, Inc.
- 6.4.18 Sony Group Corporation
- 6.4.19 Hudl
- 6.4.20 Sportradar Group AG
7 MARKET OPPORTUNITIES AND FUTURE OUTLOOK
- 7.1 White-Space And Unmet-Need Assessment

 美國直播基礎設施市場規模、佔有率和趨勢分析報告:按基礎設施組件、部署方式、最終用途和細分市場預測(2026-2033 年)
 OTT邊緣串流基礎設施:市場佔有率分析、產業趨勢與統計及成長預測(2026-2031年)
 影片串流媒體與廣播設備市場-2026-2032年全球市場預測線上電影市場-2026-2032年全球市場預測OTT電視劇:市場佔有率分析、產業趨勢與統計、成長預測(2026-2031)影片串流媒體市場-2026-2032年全球市場預測足球直播:市場佔有率分析、產業趨勢與統計、成長預測(2026-2031)視訊串流基礎設施:市場佔有率分析、產業趨勢與統計、成長預測(2026-2031)
 2026-2030年全球影像串流媒體及廣播設備市場影片串流:市場佔有率分析、產業趨勢與統計、成長預測(2026-2031)