

 |
市場調查報告書
商品編碼
2065587
北美遊戲GPU:市佔率分析、產業趨勢與統計及成長預測(2026-2031年)North America Gaming GPU - Market Share Analysis, Industry Trends & Statistics, Growth Forecasts (2026 - 2031) |
||||||
※ 本網頁內容可能與最新版本有所差異。詳細情況請與我們聯繫。
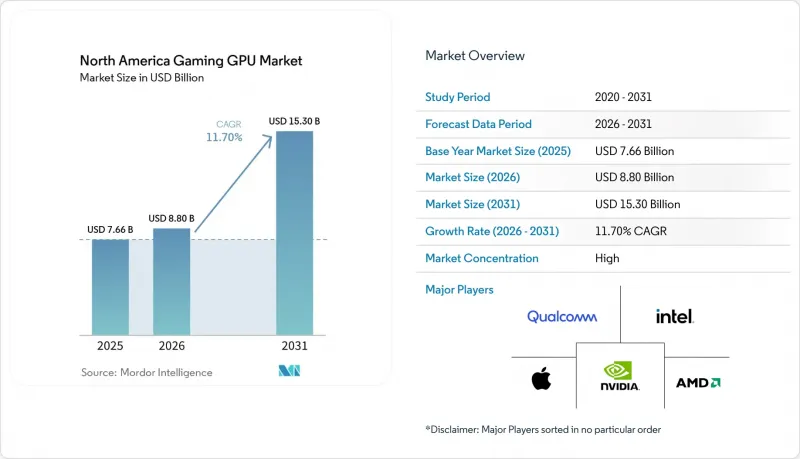
根據 Mordor Intelligence 預測,北美遊戲 GPU 市場規模將從 2025 年的 76.6 億美元和 2026 年的 88 億美元成長到 2031 年的 153 億美元,2026 年至 2031 年的複合年成長率為 11.70%。
本報告按GPU類型(獨立GPU和整合GPU)、裝置類型(遊戲桌上型電腦、遊戲筆記型電腦、智慧型手機和平板電腦(行動遊戲))、最終用戶類型(休閒玩家、發燒友和專業玩家)、記憶體類型(GDDR6、GDDR6X、傳統顯存、統一記憶體)以及國家進行細分。市場預測以美元計價。
北美遊戲GPU市場趨勢與洞察
人工智慧驅動的影像放大和神經渲染徹底改變了升級週期。
在北美遊戲GPU市場,最新的視覺效能提升依賴最新的硬體平台,因此AI驅動的幀生成與純粹的渲染效能同等重要。在2026年國際消費電子展(CES)上,NVIDIA發布了DLSS 4.5,並搭載第二代變壓器模型用於超高解析度處理,以及一項全新的「動態多幀生成」功能,但這些功能僅限於RTX 50系列Blackwell GPU。這些硬體限制正在改變消費者的購買行為。雖然舊款顯示卡也能運行遊戲,但它們無法提供與新顯示卡相同的影像重建、延遲處理或幀交付體驗。 AMD也在進一步推進機器學習驅動的渲染技術,在FSR SDK 2.2中為RDNA 4架構添加了基於機器學習的“FSR超解析度4.1”和“光線再生1.1”,同時保留了針對舊款硬體的基於分析的回退模式。隨著越來越多的主流遊戲針對這些技術進行最佳化,北美遊戲GPU市場對升級週期更短、能夠充分利用視覺堆疊功能的顯示卡的需求日益成長。這使得那些能夠將硬體發布與強大的軟體生態系統結合,並清楚區分各產品層級功能的廠商佔據了優勢。
AAA 級遊戲和射線追蹤提高了對 GPU 的最低要求。
此外,隨著射線追蹤和AI輔助渲染在當前高階遊戲中被視為標準配置而非選配功能,北美遊戲GPU市場正向高階機型轉型。 NVIDIA開發了Blackwell GeForce RTX 50系列,該系列顯示卡以第五代Tensor核心、第四代RT核心、PCIe Gen 5和GDDR7顯存為核心,展現了高階遊戲工作負載的演進趨勢。隨後,NVIDIA於2026年4月發布了RTX 5060,將DLSS 4和多幀渲染技術引入主流市場,售價僅299美元。 AMD在2025年台北國際電腦展上發表了Radeon RX 9060 XT並支援FSR 4,進一步印證了主流市場競爭對手如今不僅依賴傳統的圖形處理能力,也高度依賴神經渲染技術。這促使更多消費者轉向中中階和發燒級配置。這是因為在高刷新率顯示器上流暢運行遊戲不僅依賴大量的著色器,還依賴日益複雜的AI和射線追蹤模組。因此,在北美遊戲GPU市場,如今大型遊戲的發布比以往任何時候都更能推動玩家購買高效能顯示卡。
關稅和貿易措施導致進口成本增加
第232條款改變了北美遊戲GPU市場的定價格局,對某些進口半導體及其衍生產品徵收25%的關稅,該條款將於2026年1月15日生效。由於大多數顯示卡都在美國境外組裝,這項額外關稅將增加零售利潤、物流成本和分銷利潤之前的商品成本。入門級價格區間受此影響最大,因為該價位段的消費者對價格波動高度敏感,而且顯示卡合作夥伴在其他方面抵消價格上漲的柔軟性也較低。此外,這項政策將促使供應鏈更加謹慎地重新考慮其區域組裝地點的選擇,短期內可能推高商店價格,長期來看則可能促使製造地搬遷。加拿大和墨西哥也仍然感受到壓力,因為這些地區的定價通常始於美國分銷管道,然後蔓延至鄰近市場。因此,儘管消費者對新產品發表的興趣依然濃厚,但北美遊戲GPU市場的銷售復甦步伐正在放緩。
細分市場分析
2025年,獨立顯示卡佔據了北美遊戲圖形處理器(GPU)市場86.67%的佔有率,預計到2031年,該細分市場將以12.12%的複合年成長率成長。這一規模和成長率表明,北美遊戲GPU產業仍以專用圖形硬體為主,而非共用晶片解決方案。 NVIDIA的RTX 50系列「Blackwell」架構憑藉第五代Tensor核心和第四代RT核心提高了最低性能門檻,進一步增強了2025-2026年推出的獨立遊戲產品的吸引力。 RTX 5060及相關Blackwell產品也透過以更親民的價格提供這些功能,幫助拓展了目標客戶群體,使其不再局限於高階市場。
儘管整合式顯示卡在北美遊戲顯示卡市場仍佔比小規模,但其效能已顯著提升,使其成為輕量級遊戲和成本績效系統的理想選擇。英特爾「Panther Lake」Arc B390在基準測試中超越了先前的AMD 890M整合式顯示卡,在入門級遊戲中取得了接近筆記型電腦RTX 4050的效能,這表明整合顯示卡的基準正在快速提升。然而,共用記憶體頻寬、更嚴格的功耗限制以及在高要求射線追蹤處理下效能較低等因素意味著,在對效能要求較高的遊戲場景中,整合式顯示卡仍落後於獨立顯示卡。因此,預計在整個預測期內,獨立顯示卡仍將是北美遊戲顯示卡市場銷售、盈利和產品差異化的基礎。
到2025年,遊戲桌上型電腦將佔據北美遊戲GPU市場54.31%的佔有率。這一領先優勢仍然反映了熱衷DIY的玩家群的強勁需求,他們偏愛全功率獨立顯卡、更大的功耗預算、更廣泛的升級柔軟性以及輕薄移動系統所不具備的客製化散熱方案。此外,Blackwell系列是首款基於PCIe Gen 5的消費級GPU產品線,除了效能上的提升,也從相容性角度推動了平台更新,促進了新型桌上型電腦的開發。因此,桌上型電腦仍是北美遊戲GPU市場的核心收入來源,也是高階配置和多樣化擴充卡最容易獲利的領域。
預計到2031年,遊戲筆記型電腦的複合年成長率將達到12.67%,成為北美遊戲GPU市場成長最快的設備類型。這一成長得益於散熱設計的改進、OEM廠商的廣泛支持,以及消費者對能夠在不犧牲頂級遊戲性能的前提下提供先進AI輔助渲染的可攜式系統的日益成長的接受度。 NVIDIA RTX 50系列筆記型電腦的推出推動了高階遊戲筆記型電腦在全部區域的普及,包括來自華碩、聯想、惠普和微星等品牌的大量OEM廠商供貨和預購訂單。智慧型手機和平板電腦在2031年之前仍將是市場佔有率最小的設備類別,但隨著高通和聯發科將主機級渲染能力引入其旗艦行動晶片,它們的圖形性能正在迅速提升。
其他好處:
- Excel格式的市場預測(ME)表
- 3個月的分析師支持
目錄
第1章:引言
- 研究假設和市場定義
- 調查範圍
第2章:調查方法
第3章執行摘要
第4章 市場狀況
- 市場概覽
- 市場促進因素
- 人工智慧驅動的影像放大和神經渲染徹底改變了升級週期。
- AAA 級遊戲和射線追蹤提高了對 GPU 的最低要求。
- 電子競技、直播和內容創作者的需求正在推動高階GPU的支出。
- 行動 AAA 級遊戲的開發平臺正在推動對遊戲 GPU 的需求。
- 均熱板設計使得製造更薄、性能更高的遊戲筆記型電腦成為可能。
- 虛幻引擎 5 的行動工具鏈將利用高階智慧型手機的 GPU 來促進獲利。
- 市場限制因素
- 關稅和貿易措施導致進口成本增加
- GDDR價格飆升給GPU的價格競爭力帶來了壓力。
- 整合式顯示卡效能的提升導致入門級獨立顯示卡的需求下降。
- 筆記型電腦的散熱設計限制阻礙了其在實際使用環境中的效能提升。
- 產業價值鏈分析
- 宏觀經濟因素對市場的影響
- 監理情勢
- 技術展望
- 波特五力分析
第5章 市場規模與成長預測
- 按GPU類型
- 獨立顯示卡
- 整合顯示卡
- 依設備類型
- 遊戲桌上型電腦
- 遊戲筆記型電腦
- 智慧型手機和平板電腦
- 最終用戶
- 休閒玩家
- 業餘玩家和職業玩家
- 按記憶體類型
- GDDR6
- GDDR6X
- 傳統圖形內存
- 統一記憶體
- 按地區
- 美國
- 加拿大
- 墨西哥
第6章 競爭情勢
- 市場集中度
- 策略趨勢
- 市佔率分析
- 公司簡介
- NVIDIA Corporation
- Advanced Micro Devices, Inc.
- Intel Corporation
- Qualcomm Incorporated
- Apple Inc.
- MediaTek Inc.
- Palit Microsystems Ltd.
- ASUSTeK Computer Inc.
- Acer Inc.
- Lenovo Group Limited
- Dell Technologies Inc.
- HP Inc.
- Micro-Star International Co., Ltd.
- GIGABYTE Technology Co., Ltd.
- ASRock Inc.
- ZOTAC Technology Limited
- PNY Technologies, Inc.
- SAPPHIRE Technology Limited
- TUL Corporation
- Pine Technology Holdings Limited
第7章 市場機會與未來展望
According to Mordor Intelligence, the north america gaming GPU market size is projected to expand from USD 7.66 billion in 2025 and USD 8.80 billion in 2026 to USD 15.30 billion by 2031, registering a CAGR of 11.70% between 2026 to 2031.
This report is Segmented by GPU Type (Discrete GPUs, and Integrated GPUs), Device Type (Gaming Desktops, Gaming Laptops, and Smartphones and Tablets (Mobile Gaming)), End-User Type (Casual Gamers, and Enthusiast and Professional Gamers), Memory Type (GDDR6, GDDR6X, Legacy Graphics Memory, and Unified Memory), and Country. The Market Forecasts are Provided in Terms of Value (USD).
North America Gaming GPU Market Trends and Insights
AI Upscaling And Neural Rendering Refresh The Upgrade Cycle
In the North America gaming GPU market, AI frame generation is now as important as raw rendering power because the newest visual gains are tied to the latest hardware platforms. NVIDIA introduced DLSS 4.5 at CES 2026 with a second-generation transformer model for super resolution and a new Dynamic Multi Frame Generation capability, and those features were limited to RTX 50-series Blackwell GPUs. That hardware gating changes buyer behavior because an older card can still run a game, yet it cannot deliver the same image reconstruction, latency handling, or frame delivery experience as a newer model. AMD is also pushing further into ML-assisted rendering, with the FSR SDK 2.2 adding ML-powered FSR Upscaling 4.1 and Ray Regeneration 1.1 for RDNA 4 while still keeping analytical fallback modes for older hardware. As more major titles are optimized around these techniques, the North America gaming GPU market is shifting toward shorter upgrade windows and stronger demand for cards that can unlock the full visual stack. This gives an advantage to vendors that can pair hardware launches with a strong software ecosystem and clear feature separation across each product tier.
AAA Titles And Ray Tracing Raise Baseline GPU Requirements
The North America gaming GPU market is also moving upward because current high-end games treat ray tracing and AI-assisted rendering as baseline expectations rather than as optional extras. NVIDIA built the Blackwell GeForce RTX 50 family around fifth-generation Tensor Cores, fourth-generation RT Cores, PCIe Gen 5, and GDDR7 support, which shows how premium gaming workloads are evolving. The company then extended that feature set into the mainstream tier with the RTX 5060 launch in April 2026, which brought DLSS 4 and Multi Frame Generation to a USD 299 product level. AMD responded at Computex 2025 with the Radeon RX 9060 XT and FSR 4 support, confirming that mainstream competition now depends on neural rendering capability as much as on conventional graphics throughput. This pushes more buyers toward upper mid-range and enthusiast configurations, because smooth play on high refresh displays increasingly depends on dedicated AI and ray-tracing blocks instead of only raw shader count. As a result, major game releases now have a stronger ability to move spending toward higher performance cards in the North America gaming GPU market.
Tariff And Trade Actions Raise Import Costs
Section 232 changed pricing conditions in the North America gaming GPU market by imposing a 25% duty on certain imported semiconductors and derivative products from January 15, 2026. Because a large share of add-in-board supply is assembled outside the United States, the added duty lifts landed cost before retail margin, logistics cost, and channel markup are applied. That is hardest to absorb at entry price points, where buyers are more sensitive to price changes and board partners have less flexibility to offset the increase elsewhere. The policy also pushes supply chains to review regional assembly choices more closely, which may support longer-term manufacturing shifts even while near-term shelf prices remain elevated. Canada and Mexico still feel part of that pressure because pricing decisions for the region often start in the U.S. channel and then spread across neighboring markets. The result is a slower unit recovery path for the North America gaming GPU market, even when interest in new launches remains solid.
Other drivers and restraints analyzed in the detailed report include:
- Esports, Streaming, And Creator Demand Sustain Premium GPU Spend
- Mobile AAA Pipelines Expand Gaming GPU Demand
- Elevated GDDR Pricing Pressures GPU Affordability
For complete list of drivers and restraints, kindly check the Table Of Contents.
Segment Analysis
Discrete GPUs held 86.67% of the North America Gaming Graphics Processing Unit (GPU) market share in 2025, and the segment is projected to expand at a 12.12% CAGR through 2031. This combination of scale and speed shows that the North America gaming GPU industry is still being defined by dedicated graphics hardware rather than by shared silicon solutions. NVIDIA's RTX 50-series Blackwell architecture raised the performance floor with fifth-generation Tensor Cores and fourth-generation RT Cores, which reinforced the appeal of discrete gaming products across 2025 and 2026 launches. The RTX 5060 and related Blackwell products also widened access to those features at lower price points, which helped extend the addressable buyer base beyond only the top end.
Integrated GPUs remained the smaller tier in the North America gaming GPU market, even as their performance improved enough to become a credible option for lighter play and value-focused systems. Intel's Panther Lake Arc B390 was benchmarked above the earlier AMD 890M iGPU and near RTX 4050 laptop-class results in entry-level titles, which shows how quickly the baseline is rising for integrated graphics. Even so, shared memory bandwidth, tighter power limits, and weaker performance under heavier ray-traced loads still keep integrated options below discrete cards in demanding play scenarios. That is why dedicated graphics should continue to anchor revenue, profitability, and product differentiation across the forecast period in the North America gaming GPU market.
Gaming desktops accounted for a 54.31% share of the North America Gaming Graphics Processing Unit (GPU) market size in 2025. That lead reflects the strength of enthusiast builders who still prefer full-power discrete cards, larger power budgets, broader upgrade flexibility, and custom cooling that is not available in thinner mobile systems. The Blackwell generation also encouraged fresh desktop builds because it was the first consumer GPU line built around PCIe Gen 5, which added a compatibility reason for platform refresh beyond raw performance gains. In the North America gaming GPU market, desktops therefore remain the core revenue base where premium specifications and add-in-board variety are easiest to monetize.
Gaming laptops are projected to grow at a 12.67% CAGR through 2031, making them the fastest-expanding device type in the North America gaming GPU market. That growth reflects better thermal design, broader OEM support, and stronger consumer acceptance of portable systems that can deliver advanced AI-assisted rendering without giving up premium gaming performance. NVIDIA's laptop rollout for the RTX 50 family, including broad OEM availability and pre-orders across ASUS, Lenovo, HP, MSI, and other brands, helped normalize premium notebook gaming across the region. Smartphones and tablets remain the smallest device segment through 2031, but their graphics capability is rising quickly as Qualcomm and MediaTek bring console-like rendering features into flagship mobile chips.
List of Companies Covered in this Report:
- NVIDIA Corporation
- Advanced Micro Devices, Inc.
- Intel Corporation
- Qualcomm Incorporated
- Apple Inc.
- MediaTek Inc.
- Palit Microsystems Ltd.
- ASUSTeK Computer Inc.
- Acer Inc.
- Lenovo Group Limited
- Dell Technologies Inc.
- HP Inc.
- Micro-Star International Co., Ltd.
- GIGABYTE Technology Co., Ltd.
- ASRock Inc.
- ZOTAC Technology Limited
- PNY Technologies, Inc.
- SAPPHIRE Technology Limited
- TUL Corporation
- Pine Technology Holdings Limited
Additional Benefits:
- The market estimate (ME) sheet in Excel format
- 3 months of analyst support
TABLE OF CONTENTS
1 INTRODUCTION
- 1.1 Study Assumptions and Market Definition
- 1.2 Scope of the Study
2 RESEARCH METHODOLOGY
3 EXECUTIVE SUMMARY
4 MARKET LANDSCAPE
- 4.1 Market Overview
- 4.2 Market Drivers
- 4.2.1 AI Upscaling and Neural Rendering Refresh the Upgrade Cycle
- 4.2.2 AAA Titles and Ray Tracing Raise Baseline GPU Requirements
- 4.2.3 Esports, Streaming, and Creator Demand Sustain Premium GPU Spend
- 4.2.4 Mobile AAA Pipelines Expand Gaming GPU Demand
- 4.2.5 Vapor-Chamber Designs Unlock Thinner High-Performance Gaming Laptops
- 4.2.6 Unreal Engine 5 Mobile Toolchains Improve Premium Phone GPU Monetization
- 4.3 Market Restraints
- 4.3.1 Tariff and Trade Actions Raise Import Costs
- 4.3.2 Elevated GDDR Pricing Pressures GPU Affordability
- 4.3.3 Stronger Integrated Graphics Erode Entry-Level Discrete Demand
- 4.3.4 Notebook Thermal Limits Constrain Real-World Performance Gains
- 4.4 Industry Value Chain Analysis
- 4.5 Impact of Macroeconomic Factors on the Market
- 4.6 Regulatory Landscape
- 4.7 Technological Outlook
- 4.8 Porter's Five Forces Analysis
- 4.8.1 Bargaining Power of Suppliers
- 4.8.2 Bargaining Power of Buyers
- 4.8.3 Threat of New Entrants
- 4.8.4 Threat of Substitutes
- 4.8.5 Intensity of Competitive Rivalry
5 MARKET SIZE AND GROWTH FORECASTS (VALUE)
- 5.1 By GPU Type
- 5.1.1 Discrete GPUs
- 5.1.2 Integrated GPUs
- 5.2 By Device Type
- 5.2.1 Gaming Desktops
- 5.2.2 Gaming Laptops
- 5.2.3 Smartphones and Tablets
- 5.3 By End-User Type
- 5.3.1 Casual Gamers
- 5.3.2 Enthusiast and Professional Gamers
- 5.4 By Memory Type
- 5.4.1 GDDR6
- 5.4.2 GDDR6X
- 5.4.3 Legacy Graphics Memory
- 5.4.4 Unified Memory
- 5.5 By Geography
- 5.5.1 United States
- 5.5.2 Canada
- 5.5.3 Mexico
6 COMPETITIVE LANDSCAPE
- 6.1 Market Concentration
- 6.2 Strategic Moves
- 6.3 Market Share Analysis
- 6.4 Company Profiles (includes Global Level Overview, Market Level Overview, Core Segments, Financials as available, Strategic Information, Market Rank/Share, Products and Services, Recent Developments)
- 6.4.1 NVIDIA Corporation
- 6.4.2 Advanced Micro Devices, Inc.
- 6.4.3 Intel Corporation
- 6.4.4 Qualcomm Incorporated
- 6.4.5 Apple Inc.
- 6.4.6 MediaTek Inc.
- 6.4.7 Palit Microsystems Ltd.
- 6.4.8 ASUSTeK Computer Inc.
- 6.4.9 Acer Inc.
- 6.4.10 Lenovo Group Limited
- 6.4.11 Dell Technologies Inc.
- 6.4.12 HP Inc.
- 6.4.13 Micro-Star International Co., Ltd.
- 6.4.14 GIGABYTE Technology Co., Ltd.
- 6.4.15 ASRock Inc.
- 6.4.16 ZOTAC Technology Limited
- 6.4.17 PNY Technologies, Inc.
- 6.4.18 SAPPHIRE Technology Limited
- 6.4.19 TUL Corporation
- 6.4.20 Pine Technology Holdings Limited
7 MARKET OPPORTUNITIES AND FUTURE OUTLOOK
- 7.1 White-space and Unmet-Need Assessment


