


 |
市場調查報告書
商品編碼
2062320
北美電子商務倉庫:市場佔有率分析、產業趨勢與統計及成長預測(2026-2031 年)North America E-Commerce Warehouse - Market Share Analysis, Industry Trends & Statistics, Growth Forecasts (2026 - 2031) |
||||||

※ 本網頁內容可能與最新版本有所差異。詳細情況請與我們聯繫。
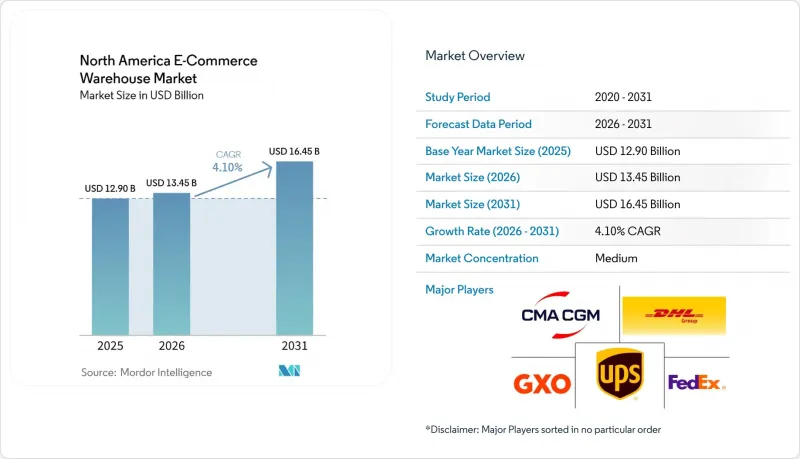
根據 Mordor Intelligence 預測,北美電子商務倉儲市場規模預計將在 2025 年達到 129 億美元,2026 年達到 134.5 億美元,2031 年達到 164.5 億美元,2026 年至 2031 年的複合年成長率為 4.1%。
市場穩定擴張的背後是倉儲經濟的根本重組,托盤式B2B訂單和高速消費品運輸如今都在爭奪同一工業空間。本報告按倉庫類型(履約中心、物流中心、暗店、微型倉配中心等)、服務類型(倉儲、揀貨包裝等)、自動化程度(人工、半自動、全自動)、終端用戶行業(服裝鞋帽等)和國家/地區進行細分。市場預測以美元計價。
北美電子商務倉儲市場趨勢與洞察
B2B電子商務的激增增加了對托盤大小儲存的需求。
隨著B2B數位化銷售的擴張,市場對能夠容納托盤貨物並毗鄰揀貨包裝區的混合型貨架系統的需求日益成長。預計到2024年,美國B2B電子商務市場規模將超過1.88兆美元,這將推動對可透過倉庫管理演算法一夜之間重新配置的限流系統的需求。在一些多租戶倉庫中,托盤訂單已佔每日吞吐量的30-40%,加劇了倉庫層高和裝卸貨平台的競爭。因此,具有快速變更條款的彈性租賃協議的成長速度超過了長期一次性使用合約。這種轉變也吸引了製造商直接在線銷售,無需批發商,從而提高了排班靈活性,並有利於全天候運營。
訂閱模式和 DTC 品牌的成長推動了產品套裝的創建和個人化自訂能力的提升。
預計到2025年,直接面對消費者(DTC)的銷售額將超過1200億美元,這主要得益於小型化、更頻繁的小包裹包裝趨勢日益成長,這些包裹在出貨前需要進行個性化客製化,以及每筆訂單工時不斷增加。業者正將20%至30%的占地面積分配給配備品管控制站和客製化包裝設施的套件組裝單元,以更高的員工配置換取每平方英尺40%至50%的收入成長。美國聯邦貿易委員會(FTC)規定的複雜標籤要求進一步提高了系統對可追溯性的要求。能夠在需求高峰期快速擴展工作單元數量的工廠,如今正收到更多來自訂閱平台的招標提案書(RFP)。
由於火災和洪水風險,倉庫保險費飆升。
2025年,美國商業不動產的保險費上漲了8.4%,但在易受野火和洪水侵襲的地區,漲幅高達25%至40%,有時甚至超過了房產稅支出。由於機器人資產的可保價值較高,全自動設施的保費漲幅最為顯著。傳統建築的保費為每平方英尺每年5至7美元,而部分設施的保費報價已超過每年15美元。開發商目前正將緊急災難管理署)的洪水風險和野火風險評估納入其網路設計,旨在透過略微增加「最後一公里」的距離來降低持有成本。此外,保險公司也變得更加嚴格,對位置和建築規格進行仔細審查。因此,開發商和營運商正面臨利潤率下降、擴張計畫放緩以及位置自由度降低的壓力,尤其是在易受洪水和火災侵襲的地區。
細分市場分析
截至2025年,在北美電商倉儲市場,履約中心將佔據43.47%的佔有率,這主要得益於該地區對大容量儲存和越庫作業的需求。同時,受零售商日益成長的需求驅動,預計到2031年,暗店和微型倉配中心的複合年成長率將達到9.34%,這主要源於零售商對在人口密集的都市區提供兩小時送達服務的需求不斷成長。隨著高周轉率的SKU支撐起城市中心附近的高租金,北美暗店電商倉儲市場預計將穩定擴張。儘管物流樞紐在貨櫃卸貨(入境)方面仍然佔據主導地位,但線上生鮮市場的擴張正在加速對低溫運輸設施的需求。
開發商正將利用率低的大型零售店改造成都市區暗倉,與傳統零售模式相比,揀貨效率提高了40-50%。然而,各市政當局之間就分區規劃問題爆發了爭議,討論的焦點集中在原零售區域的卡車交通和噪音問題上。由於高度限制,在都市區建造高層倉庫仍然很少見,因此,允許在不違反屋頂高度規定的前提下增加倉儲容量的夾層結構正在被推廣。由於位置接近性,營運商不受郊區倉庫租金下降的影響,這凸顯了北美電子商務倉儲市場需求的兩極化。
截至2025年,倉儲服務佔北美電商倉儲市場的46.15%,但附加價值服務預計到2031年將以8.81%的複合年成長率成長,超過其他任何類別。北美電商倉儲市場的主導地位在於第三方物流(3PL)供應商,他們能夠在一個設施內整合套件組裝、預組裝、禮品包裝和嚴格的品管控制(QC)流程。由於業者按15分鐘人事費用,每個托盤的收入增加,毛利率通常是僅使用貨架儲存的兩倍。
DTC品牌之所以使用這些服務,是因為內部訂單履約會拖慢其產品推出週期。目前,營運商正透過將工作單元設置在高週轉率的庫存通道旁並盡可能縮短移動距離來提高日常訂單處理效率。然而,這些區域需要重複性、細緻的工作,導致離職率高達30%,因此,參與企業正在實施遊戲化儀錶板和分級工資制度來留住員工。此外,一些靈活的勞動力平台也正在興起,在假期季節提供經過預先篩選的零工人員。
其他好處:
- Excel格式的市場預測(ME)表
- 3個月的分析師支持
目錄
第1章:引言
- 研究假設和市場定義
- 調查範圍
第2章:調查方法
第3章執行摘要
第4章 市場狀況
- 市場概覽
- 市場促進因素
- B2B電子商務的快速成長增加了對托盤式儲存的需求。
- 訂閱模式和 DTC 品牌的成長正在推動套裝和個人化產品的產能。
- 「免費退貨文化」正在推動逆向物流設施面積的擴張。
- 大宗進口商品(家具、健身器材)推高了對高層倉庫的需求。
- 由排碳權資金籌措的「綠色倉庫」計畫正在促進資本投資。
- 沿著聯邦航空管理局 (FAA) 配送路線整合屋頂無人機樞紐
- 市場限制因素
- 由於火災和洪水風險,倉庫保險費飆升。
- 由於建築材料供應不穩定,新的建設項目被迫延長。
- 物聯網資料隱私法規使感測器部署變得複雜。
- 機器人維修技術人員短缺,增加了停機風險。
- 價值供應鏈分析
- 監理情勢
- 技術展望
- 波特五力分析
第5章 市場規模與成長預測
- 倉庫類型
- 履約中心
- 物流中心(DC)
- 低溫運輸倉庫
- 暗店/微型倉配中心
- 其他(逆向物流中心、保稅倉庫、多功能空間等)
- 按服務類型
- 貯存
- 揀貨和包裝
- 附加價值服務及其他服務(套件組裝、貼標籤)
- 按自動化級別
- 手動的
- 半自動
- 全自動
- 按最終用戶行業分類
- 服裝和鞋類
- 家用電子產品
- 食品和快速消費品
- 醫藥、美容和健康
- 家居用品和家具
- 其他
- 國家
- 美國
- 加拿大
- 墨西哥
第6章 競爭情勢
- 市場集中度
- 策略趨勢
- 市佔率分析
- 公司簡介
- DHL Group
- GXO Logistics
- FedEx
- United Parcel Service of America, Inc.(UPS)
- XPO, Inc.
- GEODIS
- CH Robinson
- Kenco Logistics
- Ryder System, Inc.
- Lineage, Inc.
- Americold
- NFI Industries
- Omni Logistics
- Penske Corporation
- Stord
- ShipNetwork
- Red Stag Fulfillment
- Buske Logistics
- CMA CGM Group(Including CEVA Logistics)
- DSV A/S
第7章 市場機會與未來展望
According to Mordor Intelligence, the north america e-commerce warehouse market size is projected to be USD 12.9 billion in 2025, USD 13.45 billion in 2026, and reach USD 16.45 billion by 2031, growing at a CAGR of 4.1% from 2026 to 2031.
The market's measured expansion masks a fundamental restructuring of warehouse economics as pallet-level B2B orders and high-velocity consumer shipments now compete for the same industrial footprints. This report is Segmented by Warehouse Type (Fulfillment Centers, Distribution Centers, Dark Stores and Micro-Fulfillment Centers, and More), by Service Type (Storage, Picking and Packing, and More), Automation Level (Manual, Semi-Automated, Automated), by End-User Industry (Apparel and Footwear, and More), and by Country. The Market Forecasts are Provided in Terms of Value (USD).
North America E-Commerce Warehouse Market Trends and Insights
B2B E-Commerce Surge Expanding Pallet-Level Storage Needs
Heightened B2B digital sales now require hybrid racking that supports full-pallet moves adjacent to pick-and-pack zones. United States B2B e-commerce exceeded USD 1.88 trillion in 2024, fueling demand for slotting systems that can be re-configured overnight through warehouse management algorithms. Some multi-tenant facilities already report 30-40% of daily volume in pallet orders, intensifying competition for ceiling height and dock doors. Flexible leases with quick change-over clauses are therefore outpacing long-term single-use contracts. The shift also attracts manufacturers bypassing wholesalers to sell directly online, which adds scheduling volatility that favors 24/7 operations.
Subscription and DTC Brand Growth Driving Kitting and Personalization Capacity
DTC sales exceeded USD 120 billion in 2025 and are trending toward smaller, more frequent boxes that must be personalized before shipping, raising labor minutes per order. Operators carve 20-30% of floor space into kitting cells equipped with QA stations and bespoke packaging, accepting denser headcounts in exchange for 40-50% higher revenue per square foot. Complex labeling obligations under United States Federal Trade Commission rules add to system requirements for traceability. Facilities that can scale work-cell counts rapidly during holiday spikes now win more RFPs from subscription platforms.
Escalating Warehouse-Insurance Premiums for Fire and Flood Risk
Commercial property premiums rose 8.4% nationwide in 2025, but spiked 25-40% in wildfire and flood zones, occasionally surpassing property-tax outlays. Fully automated sites see the sharpest uptick because robotics assets elevate insured values; some quotes exceed USD 15 per square foot each year versus USD 5-7 for conventional buildings. Operators now map FEMA floodplains and wildfire risk scorings as part of network design, trading slightly longer final-mile distances for lower carrying costs. Furthermore, insurers are becoming more discerning, scrutinizing both locations and building specifications. Consequently, developers and operators are contending with squeezed profit margins, a deceleration in expansion efforts, and diminished leeway in site selection, particularly in areas vulnerable to flooding or prone to fires.
Other drivers and restraints analyzed in the detailed report include:
- Free-Return Culture Escalating Reverse-Logistics Square Footage
- Oversized Imports Spurring High-Bay Warehouse Demand
- Construction-Material Supply Volatility Delaying New Builds
For complete list of drivers and restraints, kindly check the Table Of Contents.
Segment Analysis
Fulfillment centers accounted for 43.47% of the North America e-commerce warehouse market share in 2025, underpinned by regional demand for bulk storage and cross-docking. At the other end, dark stores and micro-fulfillment centers post a 9.34% CAGR to 2031 as retailers chase two-hour delivery promises in dense metros. The North America e-commerce warehouse market size for dark stores is projected to expand steadily as high-velocity SKUs justify higher rent profiles close to city cores. Distribution hubs still dominate inbound container deconsolidation, whereas cold-chain facilities accelerate alongside online grocery adoption.
Developers repurpose dormant big-box retail into urban dark stores, boosting pick rates by 40-50% compared with in-aisle shopping models. Yet zoning battles erupt as municipalities debate truck traffic and noise in former retail districts. High-bay construction within city limits remains rare due to height caps, encouraging mezzanine builds that stretch cubic capacity without breaching roof-height codes. Proximity's value shields operators from the rate cuts now visible at suburban sheds, underscoring bifurcated demand inside the North America e-commerce warehouse market.
Storage retained 46.15% of the North America e-commerce warehouse market size in 2025, but value-added services are on an 8.81% CAGR path that outpaces any other category through 2031. North America e-commerce warehouse market advantages accrue to 3PLs able to integrate kitting, light assembly, gift wrapping, and stringent QC routines under one roof. Revenue per pallet climbs as operators bill labor in fifteen-minute increments, frequently doubling gross margins relative to racked storage alone.
DTC brands resort to these services because in-house fulfillment would delay launch cycles. Operators now allocate work cells next to high-velocity inventory lanes, minimizing travel and lifting daily order-processing efficiency. However, these zones carry turnover rates up to 30% due to repetitive fine-motor tasks, so market participants deploy gamified dashboards and stepped wage ladders to retain staff. Flexible labor platforms also emerge, supplying pre-vetted gig workers during holiday peaks.
List of Companies Covered in this Report:
- DHL Group
- GXO Logistics
- FedEx
- United Parcel Service of America, Inc. (UPS)
- XPO, Inc.
- GEODIS
- C.H. Robinson
- Kenco Logistics
- Ryder System, Inc.
- Lineage, Inc.
- Americold
- NFI Industries
- Omni Logistics
- Penske Corporation
- Stord
- ShipNetwork
- Red Stag Fulfillment
- Buske Logistics
- CMA CGM Group (Including CEVA Logistics)
- DSV A/S
Additional Benefits:
- The market estimate (ME) sheet in Excel format
- 3 months of analyst support
TABLE OF CONTENTS
1 Introduction
- 1.1 Study Assumptions and Market Definition
- 1.2 Scope of the Study
2 Research Methodology
3 Executive Summary
4 Market Landscape
- 4.1 Market Overview
- 4.2 Market Drivers
- 4.2.1 B2B E-Commerce Surge Expanding Pallet-Level Storage Needs
- 4.2.2 Subscription and DTC Brand Growth Driving Kitting and Personalization Capacity
- 4.2.3 Free-Return Culture Escalating Reverse-Logistics Square Footage
- 4.2.4 Oversized Imports (Furniture, Fitness) Spurring High-Bay Warehouse Demand
- 4.2.5 Carbon-Credit Funded "Green Warehouse" Projects Unlocking Capex
- 4.2.6 Rooftop Drone-Hub Integration Along FAA Delivery Corridors
- 4.3 Market Restraints
- 4.3.1 Escalating Warehouse-Insurance Premiums for Fire and Flood Risk
- 4.3.2 Construction-Material Supply Volatility Delaying New Builds
- 4.3.3 IoT Data-Privacy Regulations Complicating Sensor Deployment
- 4.3.4 Shortage of Robotics-Maintenance Technicians Elevating Downtime Risk
- 4.4 Value / Supply-Chain Analysis
- 4.5 Regulatory Landscape
- 4.6 Technological Outlook
- 4.7 Porter's Five Forces Analysis
- 4.7.1 Threat of New Entrants
- 4.7.2 Bargaining Power of Buyers
- 4.7.3 Bargaining Power of Suppliers
- 4.7.4 Threat of Substitutes
- 4.7.5 Competitive Rivalry
5 Market Size and Growth Forecasts (Value, USD)
- 5.1 By Warehouse Type
- 5.1.1 Fulfilment Centers
- 5.1.2 Distribution Centers (DCs)
- 5.1.3 Cold-Chain Warehouses
- 5.1.4 Dark Stores / Micro-Fulfillment Centers
- 5.1.5 Others (Reverse Logistics Hubs, Bonded Warehouses, Hybrid-use Spaces, etc.)
- 5.2 By Service Type
- 5.2.1 Storage
- 5.2.2 Picking and Packing
- 5.2.3 Value-Added Services and Others (Kitting, Labelling)
- 5.3 By Automation Level
- 5.3.1 Manual
- 5.3.2 Semi-Automated
- 5.3.3 Fully Automated
- 5.4 By End-User Industry
- 5.4.1 Apparel and Footwear
- 5.4.2 Consumer Electronics
- 5.4.3 Grocery and FMCG
- 5.4.4 Pharmaceuticals, Beauty and Wellness
- 5.4.5 Home Essentials and Furnishings
- 5.4.6 Others
- 5.5 By Country
- 5.5.1 United States
- 5.5.2 Canada
- 5.5.3 Mexico
6 Competitive Landscape
- 6.1 Market Concentration
- 6.2 Strategic Moves
- 6.3 Market Share Analysis
- 6.4 Company Profiles (Includes Global Level Overview, Market Level Overview, Core Segments, Financials as Available, Strategic Information, Market Rank/Share, Products and Services, Recent Developments)
- 6.4.1 DHL Group
- 6.4.2 GXO Logistics
- 6.4.3 FedEx
- 6.4.4 United Parcel Service of America, Inc. (UPS)
- 6.4.5 XPO, Inc.
- 6.4.6 GEODIS
- 6.4.7 C.H. Robinson
- 6.4.8 Kenco Logistics
- 6.4.9 Ryder System, Inc.
- 6.4.10 Lineage, Inc.
- 6.4.11 Americold
- 6.4.12 NFI Industries
- 6.4.13 Omni Logistics
- 6.4.14 Penske Corporation
- 6.4.15 Stord
- 6.4.16 ShipNetwork
- 6.4.17 Red Stag Fulfillment
- 6.4.18 Buske Logistics
- 6.4.19 CMA CGM Group (Including CEVA Logistics)
- 6.4.20 DSV A/S
7 Market Opportunities and Future Outlook

 全球食品飲料倉儲市場。
 個人及家庭服務機器人市場規模、佔有率及趨勢分析報告:按類型、技術、地區及細分市場分類(2026-2033 年)
 2026年全球多深度穿梭系統市場報告
 化學品倉儲市場報告:按類型、應用和地區分類(2026-2034年)
 按需倉儲:市場佔有率分析、產業趨勢與統計、成長預測(2026-2031)德國電子商務倉庫:市場佔有率分析、產業趨勢與統計及成長預測(2026-2031)印度倉儲市場:市場佔有率分析、產業趨勢與統計及成長預測(2026-2031)法國電子商務倉庫:市場佔有率分析、產業趨勢與統計及成長預測(2026-2031)亞太地區化學品倉儲市場:市佔率分析、產業趨勢與統計、成長預測(2026-2031年)
 全球按需倉儲市場:按組織、產業和地區分類-市場規模、產業動態、機會分析和預測(2026-2035 年)