


 |
市場調查報告書
商品編碼
2062480
按需倉儲:市場佔有率分析、產業趨勢與統計、成長預測(2026-2031)On-demand Warehousing - Market Share Analysis, Industry Trends & Statistics, Growth Forecasts (2026 - 2031) |
||||||
※ 本網頁內容可能與最新版本有所差異。詳細情況請與我們聯繫。
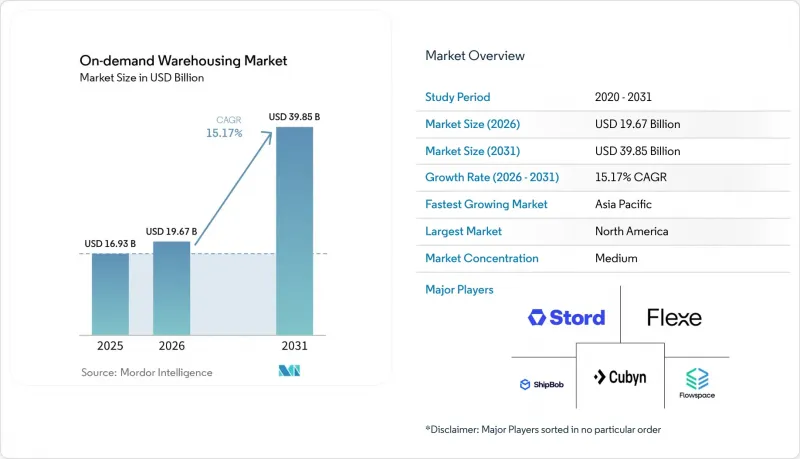
根據 Mordor Intelligence 預測,按需倉儲市場規模將從 2025 年的 169.3 億美元和 2026 年的 196.7 億美元成長到 2031 年的 398.5 億美元,2026 年至 2031 年的複合年成長率為 15.17%。
儘管信貸環境趨緊,但由於企業為應對通膨導致的租賃成本波動而大量採用可變成本倉儲能力,以及為確保疫情後業務永續營運必須儲備緩衝資金,市場需求依然旺盛。本報告按服務類型(倉儲、物流、履約附加價值服務)、儲存期限(短期、中期、長期)、倉庫規模(小規模、中型、大型)、產業(電子商務和零售、消費品等)以及地區(北美等)進行細分。市場預測以美元計價。
全球按需倉儲市場趨勢及洞察
疫情後的復甦策略正在提升溢出儲存能力。
經營團隊指令目前優先考慮的是產能盈餘而非單純的成本效益。這反映了疫情期間學到的教訓:短缺導致企業利潤下降,品牌忠誠度受損。靈活的合約允許將固定成本轉化為僅在需求激增時產生的按需成本,從而在維持服務水準的同時確保流動性。研究表明,擁有可變產能的公司從供應中斷中恢復的速度比其他公司快30%。需求最高的產業是消費電子和服裝等波動性較大的產業,這些產業的缺貨會導致巨大的商機損失。因此,即時可用的倉儲空間溢價較高,從而支撐了按需倉儲市場的持續成長。
與通貨膨脹相關的租金波動會促進可變成本合約的簽訂。
遞增條款使得傳統租賃合約難以預測,財務人員如今不僅將靈活使用倉庫視為一種營運工具,更將其視為一種風險對沖機制。基於使用量的收費系統將佔用成本與收入週期緊密連結起來,從而在通膨環境下提升利潤率管理水準。面臨空置風險增加的業主開始提案更短的合約期限,降低了簽訂可變合約的門檻。隨著企業重組其固定成本和可變成本結構,這些因素共同推動了對按需倉儲市場的需求成長。
倉儲業員工離職率急劇上升,正削弱服務水準的可靠性。
倉儲業者面臨員工流動率高的巨大挑戰,尤其當年離職率超過30%時。如此高的離職率不僅會增加招募和培訓成本,還會提高出錯的可能性,最終削弱客戶對履約網路可靠性的信心。為了應對這個問題,營運商正致力於提高工資和實現重複性工作的自動化。然而,這些解決方案往往會增加營運成本,可能會抵消固定設施的成本優勢。
細分市場分析
在2025年的按需倉儲市場中,倉儲服務將佔據54.28%的市場佔有率,這反映了其作為該行業核心收入來源的地位。然而,商品化正在擠壓利潤空間,因此投資正轉向差異化、高價位的服務,例如退貨處理、套件組裝和客製化包裝。儘管規模較小,但預計到2031年,附加價值服務將以17.80%的年均成長率成長,超過基礎倉儲服務,因為品牌商正利用其履約經驗來獲得競爭優勢。柔軟性該行業的關鍵,能夠無縫整合WMS(倉庫管理系統)、OMS(訂單管理系統)和逆向物流的供應商正在獲得長期合約。這種專業化使得分等級定價成為可能,從而抵消不斷上漲的客戶轉換成本、人事費用和保險費。因此,技術高度先進的倉庫正在成為新產品發布和季節性促銷的策略合作夥伴,並更深入地融入客戶的營運中。
第二個因素是D2C(直接面對消費者)模式的普及,這種模式需要快速的SKU配置、訂閱盒組裝和極快的退貨處理。這些工作流程無法由標準化的設施完成,因此連接專業地點的利基營運商和平台的需求不斷成長。由此,按需倉儲市場持續兩極化。通用倉儲提供者主要以價格競爭,而服務型倉儲地點則追求兩位數的溢價收益。這種兩極化正在推動產業持續重組,大型營運商透過收購利基專業公司來擴展服務,同時又不犧牲運轉率。
到2025年,短期倉儲空間(少於一個月)將佔按需倉儲市場佔有率的52.11%,這反映出企業越來越重視彈性,而非透過長期合約來節省成本。人工智慧驅動的預測工具能夠減少安全庫存,推動這一轉變,使品牌能夠提前數天而非數月預訂倉儲能力,從而進一步加速市場成長,預計在預測期內將以16.24%的複合年成長率成長。隨著疫情影響的消退,在宏觀需求不確定的情況下,企業仍然對過度承諾保持謹慎,並在托盤成本上漲的情況下優先考慮流動性。供應商正透過動態定價引擎應對市場波動,該引擎平衡有限的碼頭容量和即時需求,並借鑒航空公司收益管理模式來保護利潤率。
中期(1-6個月)合約主要針對需求可預測的季節性企業,約佔該細分市場的三分之一。另一方面,長期合約(超過6個月)則呈下降趨勢,因為庫存可見度的提高降低了企業佔用資金的合理性。然而,那些為應對地緣政治衝擊而維持戰略緩衝的耐用品公司仍然重視高度自動化倉庫設施的長期租賃。總體而言,短期合約的普遍存在使產能規劃變得複雜,但如果透過複雜的部位分配演算法進行管理,則可以提高每平方英尺的收益,從而使按需倉儲市場即使在平均合約期限縮短的情況下也能保持收入成長勢頭。
區域分析
預計到2025年,北美將維持35.06%的市場佔有率,但由於薪資上漲和房地產貸款收緊,成長速度正在放緩。強大的第三方物流生態系統、密集的運輸網路和廣泛的倉儲管理系統部署支撐著市場的持續擴張,但住宅附近的新分區法規正在延長開發週期。颶風頻繁的墨西哥灣沿岸和野火頻發的西部各州不斷上漲的保險費加劇了成本壓力,促使客戶轉向風險較低的內陸地區。美國企業擴大利用售後回租交易來釋放資金,將所有權轉移給房地產投資信託基金(REITs),這些基金透過與按需倉儲市場模式相契合的混合租賃結構提供靈活性。
在亞太地區,複合年成長率高達17.57%,這主要得益於製造商向中國以外地區多元化發展,以及印度、印尼和越南等國電子商務的加速普及。政府對工業園區的激勵措施,加上行動商務的快速成長,刺激了郊區和都市區微型網站的需求。跨國公司利用其「中國+1」籌資策略,在東協地區建立區域中心,隨著供應鏈的重組,臨時倉儲需求也隨之增加。為了應對這一需求,平台正在增加雙語介面和本地化支付選項,以方便全部區域的中小企業使用。
歐洲也緊跟其後,在強力的ESG(環境、社會和治理)法規的支持下,共用倉儲模式蓬勃發展。然而,有關數據主權的法規阻礙了整合,將歐洲大陸分類為多個合規區域,並推高了平台營運成本。南美洲的發展勢頭得益於墨西哥的近岸外包和巴西電子商務的蓬勃發展,但物流基礎設施的匱乏限制了其發展速度。在中東和非洲地區,傑貝阿里自由區物流園區等大規模自由區計畫正在提供現代化的多租戶倉儲設施,使該地區成為連接亞洲、歐洲和非洲的交通樞紐。這些多元化的趨勢,加上區域的特殊性,正在推動全球按需倉儲市場實現兩位數的成長。
其他好處:
- Excel格式的市場預測(ME)表
- 3個月的分析師支持
目錄
第1章:引言
- 研究假設和市場定義
- 調查範圍
第2章:調查方法
第3章執行摘要
第4章 市場狀況
- 市場概覽
- 市場促進因素
- 疫情後的復甦策略正在提升溢出儲存能力。
- 與通貨膨脹掛鉤的租賃價格波動性促使人們簽訂可變成本合約。
- 製造業回流/近岸外包的加速發展造成了意想不到的庫存積壓。
- 零售全通路整合需要分散式安全庫存地點。
- 範圍 3排放報告正在透過平台促進未充分利用空間的共用。
- 人工智慧驅動的需求預測能夠實現微季節尺度的生產能力互換。
- 市場限制因素
- 倉庫員工離職率飆升,正在削弱服務水準的可靠性。
- 多租戶設施的保險費上漲
- 《資料主權法案》使跨境倉庫管理系統 (WMS) 部署的實施變得更加複雜。
- 銀行收緊貸款政策降低了房東提供短期租賃的意願。
- 波特五力分析
- 價值供應鏈分析
- 產業的技術創新
- 政府法規和政策
- 地緣政治事件對市場的影響
第5章 市場規模與成長預測
- 按服務類型
- 倉庫/存儲
- 物流與履約
- 附加價值服務(套件組裝、退貨)
- 按保留期限
- 短期(少於1個月)
- 中期(1-6個月)
- 長期(6個月或以上)
- 倉庫規模
- 小規模(小於50,000平方英尺)
- 中型(50,000-200,000平方英尺)
- 大型(超過20萬平方英尺)
- 按行業分類
- 電子商務與零售
- 面向消費者的包裝商品
- 食品和飲料(包括低溫運輸)
- 醫療保健和製藥
- 工業和製造業
- 其他
- 按地區
- 北美洲
- 美國
- 加拿大
- 墨西哥
- 南美洲
- 巴西
- 秘魯
- 智利
- 阿根廷
- 其他南美國家
- 亞太地區
- 印度
- 中國
- 日本
- 澳洲
- 韓國
- 東南亞(新加坡、馬來西亞、泰國、印尼、越南、菲律賓)
- 其他亞太國家
- 歐洲
- 英國
- 德國
- 法國
- 西班牙
- 義大利
- 比荷盧經濟聯盟(比利時、荷蘭、盧森堡)
- 北歐國家(丹麥、芬蘭、冰島、挪威、瑞典)
- 其他歐洲國家
- 中東和非洲
- 阿拉伯聯合大公國
- 沙烏地阿拉伯
- 南非
- 奈及利亞
- 其他中東和非洲國家
- 北美洲
第6章 競爭情勢
- 市場集中度
- 策略趨勢
- 市佔率分析
- 公司簡介
- Flexe
- Flowspace
- Stord
- ShipBob
- Darkstore/FastAF
- Cubyn
- Stockspots
- SpaceFill
- Storeganise
- Saltbox
- Ohi
- NinjaVan Warehousing
- ShipHype
- Flexport Logistics Centers
- DHL Group
- GXO Logistics
- ShipHero
- Airhouse
- Parcelhub
- Extensiv
第7章 市場機會與未來展望
According to Mordor Intelligence, the on-demand warehousing market is projected to expand from USD 16.93 billion in 2025 and USD 19.67 billion in 2026 to USD 39.85 billion by 2031, registering a 15.17% CAGR between 2026 and 2031.
Surging adoption of variable-cost capacity in response to inflation-linked lease volatility, coupled with mandates for post-pandemic resiliency buffers, is keeping demand elevated even as credit conditions tighten. This report is Segmented by Service Type (Warehousing and Storage, Distribution and Fulfilment, Value-Added Services), by Storage Duration (Short-Term, Medium-Term, Long-Term), by Warehouse Size (Small, Medium, Large), by Industry Vertical (E-Commerce and Retail, Consumer Packaged Goods, and More), and Geography (North America, and More). The Market Forecasts are Provided in Terms of Value (USD).
Global On-demand Warehousing Market Trends and Insights
Post-pandemic Resiliency Agendas Boosting Overflow Storage
Board-level mandates now prioritize overflow capacity over pure cost efficiency, reflecting lessons from pandemic shortages that cut revenue and eroded brand loyalty. Flexible contracts convert fixed costs into on-demand expenses that activate only during surges, preserving liquidity while protecting service levels. Research found companies with variable capacity recovered 30% faster from disruptions. Demand is strongest in volatile sectors such as consumer electronics and apparel, where stockouts carry steep opportunity costs. The resulting premium for readily activatable space underpins sustained growth in the on-demand warehousing market.
Inflation-linked Lease-rate Volatility Incentivizing Variable-cost Contracts
Escalation clauses have made traditional leases unpredictable, prompting finance chiefs to view flexible warehousing as both an operational and hedging tool. Usage-based pricing closely aligns occupancy cost with revenue cycles, improving margin control in inflationary environments. Landlords contending with rising vacancy risk have begun offering shorter terms, lowering barriers to variable arrangements. These factors collectively channel more volume toward the on-demand warehousing market as firms rebalance fixed and variable cost structures.
Soaring Warehouse Labor Turnover Undermining Service-level Reliability
Warehouse operators face a significant challenge with labor turnover, especially when attrition rates exceed 30% annually. Such high turnover not only escalates hiring and training expenses but also heightens the likelihood of errors, ultimately eroding client trust in the reliability of fulfillment networks. In response, operators have turned to offering higher wages and automating repetitive tasks. However, these solutions come with increased overhead costs, potentially diminishing the cost benefits of fixed facilities.
Other drivers and restraints analyzed in the detailed report include:
- Accelerated Reshoring / Nearshoring Creating Unplanned Inventory Buffers
- Retail Omni-channel Convergence Requiring Distributed Safety-stock Nodes
- Rising Insurance Premiums for Multi-tenant Facilities
For complete list of drivers and restraints, kindly check the Table Of Contents.
Segment Analysis
Warehousing and storage contributed to the on-demand warehousing market size in 2025, equal to 54.28% share, reflecting its role as the sector's core revenue stream. Yet commoditization is squeezing margins, steering investment toward differentiated offerings such as returns processing, kitting, and custom packaging that command premium rates. Value-added services, while smaller, are slated to expand 17.80% annually through 2031, outpacing basic storage as brands leverage fulfillment experience for competitive advantage. Providers able to integrate WMS, OMS, and reverse logistics seamlessly are winning long-term contracts despite the industry's preference for flexibility. This specialization raises switching costs for clients and supports tiered pricing that offsets rising labor and insurance expenses. In turn, technology-rich warehouses position themselves as strategic partners during product launches and seasonal promotions, further embedding themselves within client operations.
A second catalyst is the proliferation of direct-to-consumer models that require rapid SKU configuration, subscription box assembly, and hyper-responsive returns handling. These workflows are incompatible with one-size-fits-all facilities, reinforcing demand for niche operators or platform matching of specialized nodes. Consequently, the on-demand warehousing market continues to bifurcate: general capacity providers compete largely on price, while service-rich nodes chase double-digit premium yields. This divergence supports continued consolidation, as scale operators acquire niche specialists to broaden offerings without sacrificing utilization.
Short-term space (<= 1 month) accounted for 52.11% of the On-demand warehousing market share in 2025, reflecting enterprises' emphasis on agility over cost savings from longer commitments. AI-driven forecasting tools that reduce safety stocks are driving this shift, enabling brands to book capacity days rather than months in advance, further accelerating the market with a 16.24% CAGR over the forecast period. As pandemic disruptions recede, companies remain wary of over-committing amid uncertain macro demand, favoring liquidity despite higher per-pallet rates. Providers counter volatility through dynamic pricing engines that balance real-time demand with finite dock capacity, mirroring airline yield management models to protect margins.
Medium-term (1-6 months) contracts serve predictable seasonal businesses and account for roughly one-third of the segment, while long-term agreements (over 6 months) trend down as improved inventory visibility weakens the rationale for tying up capital. Nonetheless, durable goods firms that stock strategic buffers against geopolitical shocks still value extended leases within high-automation buildings. Overall, the prevalence of short spans complicates capacity planning but unlocks higher revenue per square foot when managed through sophisticated slotting algorithms, ensuring the on-demand warehousing market maintains its revenue growth momentum even as average contract length declines.
Geography Analysis
North America retained 35.06% market share in 2025, but growth moderates amid wage inflation and real estate credit tightening. Strong 3PL ecosystems, dense transportation networks, and widespread WMS adoption underpin continued expansion, yet new zoning restrictions near residential areas elevate development timelines. Insurance premiums in hurricane-prone Gulf Coast and wildfire-exposed Western states add cost pressure, nudging clients toward inland nodes with lower risk profiles. United States corporations increasingly deploy sale-leaseback deals to unlock capital, shifting ownership to REITs that are more open to hybrid lease structures aligned with the on-demand warehousing market model.
Asia Pacific is reflecting a strong 17.57% CAGR as manufacturers diversify beyond China and e-commerce penetration accelerates in India, Indonesia, and Vietnam. Government incentives for industrial parks, coupled with rapid adoption of mobile commerce, spur demand for suburban and urban micro-sites. Multinationals leveraging "China-plus-one" sourcing strategies establish regional hubs in ASEAN, driving transitory storage needs while supply chains recalibrate. Platforms have responded by adding bilingual interfaces and localized payment options, easing onboarding for SMEs across the region.
Europe follows closely, buoyed by robust ESG regulations that favor shared capacity models. However, data-sovereignty rules create integration hurdles, splitting the continent into multiple compliance zones that raise platform operating costs. South America's momentum stems from nearshoring to Mexico and Brazil's e-commerce boom, though logistics infrastructure gaps constrain speed. In the Middle East and Africa, large-scale free-zone projects such as Jafza Logistics Park offer modern multi-tenant warehousing, positioning the region as a trans-shipment hub between Asia, Europe, and Africa. Collectively, these diverse dynamics ensure the on-demand warehousing market maintains double-digit global growth despite regional idiosyncrasies.
- Flexe
- Flowspace
- Stord
- ShipBob
- Darkstore / FastAF
- Cubyn
- Stockspots
- SpaceFill
- Storeganise
- Saltbox
- Ohi
- NinjaVan Warehousing
- ShipHype
- Flexport Logistics Centers
- DHL Group
- GXO Logistics
- ShipHero
- Airhouse
- Parcelhub
- Extensiv
Additional Benefits:
- The market estimate (ME) sheet in Excel format
- 3 months of analyst support
TABLE OF CONTENTS
1 Introduction
- 1.1 Study Assumptions and Market Definition
- 1.2 Scope of the Study
2 Research Methodology
3 Executive Summary
4 Market Landscape
- 4.1 Market Overview
- 4.2 Market Drivers
- 4.2.1 Post-Pandemic Resiliency Agendas Boosting Overflow Storage
- 4.2.2 Inflation-Linked Lease-Rate Volatility Incentivizing Variable-Cost Contracts
- 4.2.3 Accelerated Reshoring / Nearshoring Creating Unplanned Inventory Buffers
- 4.2.4 Retail Omni-Channel Convergence Requiring Distributed Safety-Stock Nodes
- 4.2.5 Scope-3 Emission Reporting Propelling Platform-Enabled Idle-Space Sharing
- 4.2.6 Generative-AI Demand Forecasting Enabling Micro-Seasonal Capacity Swaps
- 4.3 Market Restraints
- 4.3.1 Soaring Warehouse Labor Turnover Undermining Service-Level Reliability
- 4.3.2 Rising Insurance Premiums for Multi-Tenant Facilities
- 4.3.3 Data-Sovereignty Laws Complicating Cross-Border WMS Deployments
- 4.3.4 Bank Credit Tightening Limiting Landlord Appetite for Short-Term Tenancies
- 4.4 Porter's Five Forces Analysis
- 4.4.1 Threat of New Entrants
- 4.4.2 Bargaining Power of Buyers
- 4.4.3 Bargaining Power of Suppliers
- 4.4.4 Threat of Substitutes
- 4.4.5 Competitive Rivalry
- 4.5 Value / Supply-Chain Analysis
- 4.6 Technological Innovations in the Industry
- 4.7 Government Regulations and Policies
- 4.8 Impact of Geopolitical Events on the Market
5 Market Size and Growth Forecasts
- 5.1 By Service Type
- 5.1.1 Warehousing and Storage
- 5.1.2 Distribution and Fulfilment
- 5.1.3 Value-added Services (kitting, returns)
- 5.2 By Storage Duration
- 5.2.1 Short-term (Less than 1 month)
- 5.2.2 Medium-term (1-6 months)
- 5.2.3 Long-term (More than 6 months)
- 5.3 By Warehouse Size
- 5.3.1 Small (less than 50 k sq ft)
- 5.3.2 Medium (50-200 k sq ft)
- 5.3.3 Large (greater than 200 k sq ft)
- 5.4 By Industry Vertical
- 5.4.1 E-commerce and Retail
- 5.4.2 Consumer Packaged Goods
- 5.4.3 Food and Beverage (incl. Cold-chain)
- 5.4.4 Healthcare and Pharma
- 5.4.5 Industrial and Manufacturing
- 5.4.6 Others
- 5.5 By Geography
- 5.5.1 North America
- 5.5.1.1 United States
- 5.5.1.2 Canada
- 5.5.1.3 Mexico
- 5.5.2 South America
- 5.5.2.1 Brazil
- 5.5.2.2 Peru
- 5.5.2.3 Chile
- 5.5.2.4 Argentina
- 5.5.2.5 Rest of South America
- 5.5.3 Asia-Pacific
- 5.5.3.1 India
- 5.5.3.2 China
- 5.5.3.3 Japan
- 5.5.3.4 Australia
- 5.5.3.5 South Korea
- 5.5.3.6 Southeast Asia (Singapore, Malaysia, Thailand, Indonesia, Vietnam, and Philippines)
- 5.5.3.7 Rest of Asia-Pacific
- 5.5.4 Europe
- 5.5.4.1 United Kingdom
- 5.5.4.2 Germany
- 5.5.4.3 France
- 5.5.4.4 Spain
- 5.5.4.5 Italy
- 5.5.4.6 BENELUX (Belgium, Netherlands, and Luxembourg)
- 5.5.4.7 NORDICS (Denmark, Finland, Iceland, Norway, and Sweden)
- 5.5.4.8 Rest of Europe
- 5.5.5 Middle East and Africa
- 5.5.5.1 United Arab Emirates
- 5.5.5.2 Saudi Arabia
- 5.5.5.3 South Africa
- 5.5.5.4 Nigeria
- 5.5.5.5 Rest of Middle East and Africa
- 5.5.1 North America
6 Competitive Landscape
- 6.1 Market Concentration
- 6.2 Strategic Moves
- 6.3 Market Share Analysis
- 6.4 Company Profiles {(Includes Global Level Overview, Market Level Overview, Core Segments, Financials as Available, Strategic Information, Market Rank/Share for Key Companies, Products and Services, and Recent Developments)}
- 6.4.1 Flexe
- 6.4.2 Flowspace
- 6.4.3 Stord
- 6.4.4 ShipBob
- 6.4.5 Darkstore / FastAF
- 6.4.6 Cubyn
- 6.4.7 Stockspots
- 6.4.8 SpaceFill
- 6.4.9 Storeganise
- 6.4.10 Saltbox
- 6.4.11 Ohi
- 6.4.12 NinjaVan Warehousing
- 6.4.13 ShipHype
- 6.4.14 Flexport Logistics Centers
- 6.4.15 DHL Group
- 6.4.16 GXO Logistics
- 6.4.17 ShipHero
- 6.4.18 Airhouse
- 6.4.19 Parcelhub
- 6.4.20 Extensiv
7 Market Opportunities and Future Outlook
 全球食品飲料倉儲市場。
 歐洲化學品倉儲市場:市場佔有率分析、產業趨勢與統計、成長預測(2026-2031 年)
 個人及家庭服務機器人市場規模、佔有率及趨勢分析報告:按類型、技術、地區及細分市場分類(2026-2033 年)
 2026年全球多深度穿梭系統市場報告北美化學品倉儲市場:市場佔有率分析、產業趨勢與統計及成長預測(2026-2031 年)德國化學品倉儲市場:市場佔有率分析、產業趨勢與統計、成長預測(2026-2031)日本化學品倉儲市場:市場佔有率分析、產業趨勢與統計及成長預測(2026-2031年)義大利化學品倉儲市場:市場佔有率分析、產業趨勢與統計及成長預測(2026-2031 年)
 化學品倉儲市場報告:按類型、應用和地區分類(2026-2034年)印度化學品倉儲市場:市場佔有率分析、產業趨勢與統計及成長預測(2026-2031)