


 |
市場調查報告書
商品編碼
1940842
東協貨運與物流:市場佔有率分析、產業趨勢與統計、成長預測(2026-2031)ASEAN Freight and Logistics - Market Share Analysis, Industry Trends & Statistics, Growth Forecasts (2026 - 2031) |
||||||
※ 本網頁內容可能與最新版本有所差異。詳細情況請與我們聯繫。
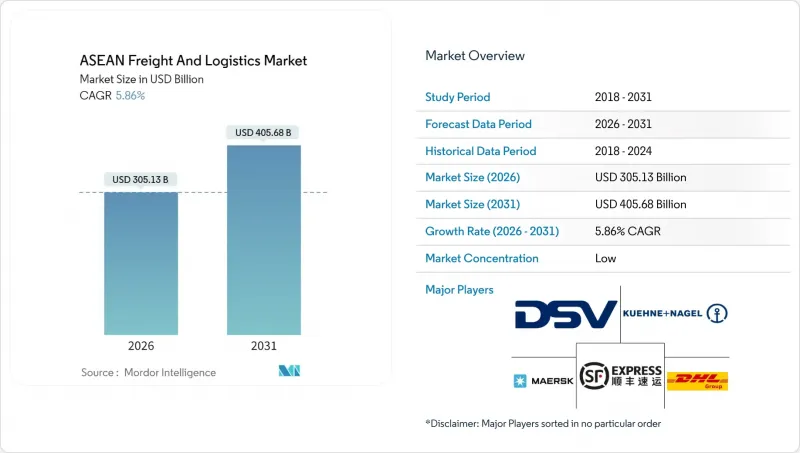
預計東協貨運和物流市場規模將從 2025 年的 2,882.4 億美元成長到 2026 年的 3,051.3 億美元,到 2031 年將達到 4,056.8 億美元,2026 年至 2031 年的複合年成長率為 5.86%。
電子商務的蓬勃發展、製造業供應鏈的重組、關稅減讓貿易協定的簽署以及大規模公共基礎設施項目的實施,共同支撐著東協十個成員國的成長動能。菲律賓加入區域全面經濟夥伴協定(RCEP)後,東協貨運和物流市場從中獲益良多。 RCEP於2025年6月生效,取消了90%貿易商品的關稅,並加快了清關程序。日益激烈的競爭推動了併購,旨在建立密集的區域網路,而電動車電池物流和藥品低溫運輸等新興服務領域則提供了多元化的收入來源。然而,新興市場物流成本佔GDP比重較高、國內航運限制以及運力不平衡等挑戰,給營運商帶來了成本壓力,他們必須透過技術創新和模式最佳化來抵消這些壓力。
東協貨運及物流市場趨勢及洞察
B2C電子商務的爆炸性成長推動了CEP(宅配)量的成長。
在東協主要城市,TikTok、Shopee 和 Lazada 等電商平台推動的小包裹量已超過傳統貨運量。平台主導的承運商分配提高了網路密度,增強了平台相對於第三方營運商的議價能力,促使營運商投資建設日處理數百萬個小包裹的自動化分類中心。獨角獸新創公司 Flash Express 已擴展至 1300 家門市,目前在六個國家/地區日處理高達 200 萬小包裹,這充分展現了快速配送所需的營運強度。分散式履約、都市區集散中心和微旅行車隊提高了最後一公里配送效率,但針對電動自行車和三輪車的區域法規阻礙了這些技術的統一部署。即時追蹤和預測送達時間已成為客戶的基本期望,推動了快遞業者的數位化。
製造業外商直接投資向東協轉移促進了區域內貿易。
外國公司將生產從東北亞轉移到東協,持續推動跨境貨運代理、零件轉運服務和專業倉儲的需求。電子電氣產品主導資本流入,馬來西亞在2024年9月出口了價值341億馬幣(72億美元)的積體電路。越南的工業園區與升級後的深水港和雙軌鐵路走廊直接相連,實現了與內陸地區的無縫連接。準時制生產(JIT)模式提升了交付可靠性和清關效率的重要性,並增強了端到端物流整合商的價值提案。區域全面經濟夥伴關係協定(RCEP)的原產地規則透過鼓勵國內採購進一步推動了供應鏈的區域化,刺激了東協內部的貨運量。
新興東南亞國協: 16-25%
道路狀況不佳、內河航道有限以及電力短缺延長了運輸時間並增加了處理成本,尤其是在內陸國家和島嶼次區域。根據國際能源總署(IEA)預測,2000年至2024年間,東南亞貨運石油需求預計將從每日130萬桶增至每日280萬桶,這將加劇交通堵塞和排放。電網不穩定和柴油發電機的高成本阻礙了低溫運輸的擴展,並限制了藥品和生鮮食品的運輸。如果資金籌措無法加速,新興成員國將面臨服務品質下降的風險,並錯失參與高附加價值價值鏈的機會。
細分市場分析
到了2025年,製造業將佔東協收入的31.74%,凸顯該地區在全球電子、汽車和紡織品供應鏈中的關鍵地位。靈活的倉儲和限時貨運服務能夠實現向越南、泰國和馬來西亞工廠的準時交貨。隨著現代食品雜貨、時尚和一般商品領域不斷拓展全通路分銷網路,東協在批發和零售領域的貨運和物流市場佔有率預計將快速成長,2026年至2031年的複合年成長率將達到6.31%。農業和林業將繼續透過散裝和冷藏貨物運輸佔據相當大的運輸量,而建設業將推動與公共基礎設施建設相關的重型貨物運輸。
在零售供應鏈中,庫存管理正日益自動化,以滿足波動不定的線上需求。暗店和微型倉配中心在人口密集的都市區地區迅速擴張,將配送時間縮短至兩小時以內。同時,製造商為了規避地緣政治風險,正在分散工廠選址,這迫使服務供應商建立區域配送中心,以協調保稅運輸路線和零件流動。溫控倉庫在食品和製藥業越來越受歡迎,預計到2024年,馬來西亞Tasco公司的冷藏倉庫網路運轉率將達到85%至90%。
到2025年,貨運業務將佔總收入的60.12%,這反映了其在散裝和貨櫃運輸領域的核心地位。同時,都市區快遞(CEP)將以6.78%的複合年成長率(CAGR)實現最快成長,2026年至2031年的成長主要得益於都市區電子商務需求的成長(高頻小包裹遞送和透明追蹤)。由於自動化投資,例如曼谷和雅加達日處理能力達300萬件包裹的分揀機,東協地區城市快遞業者的貨運和物流市場規模正在擴大。貨運業透過協調清關和多區域運輸,促進區域內貿易的成長,從而維持收入穩定。倉儲業受益於庫存本地化,特別是冷藏保管的建設,以支持不斷成長的線上生鮮配送。小規模但盈利的特色服務(計劃貨物、逆向物流、售後配件)完善了業務組合,並幫助營運商抵禦經濟週期的影響。
數位轉型已不再是可選項。領先的快遞公司正在整合路線最佳化演算法和手持掃描儀,為賣家和買家提供即時狀態更新。大都會圈線上藥局和食材自煮包服務的擴張,增加了對溫控快遞的需求。本地業者可以透過整合跨境小包裹並利用東協單一窗口,縮短配送週期,並與客戶建立更牢固的關係。由於各地對電動配送自行車的監管規定不盡相同,在每個城市試行推廣合規車輛可以有效應對營運中的不確定性。
其他福利:
- Excel格式的市場預測(ME)表
- 3個月的分析師支持
目錄
第1章 引言
- 研究假設和市場定義
- 調查範圍
第2章調查方法
第3章執行摘要
第4章 市場情勢
- 市場概覽
- 人口統計數據
- 按經濟活動分類的GDP分配
- 按經濟活動分類的GDP成長
- 通貨膨脹
- 經濟表現及概況
- 電子商務產業的趨勢
- 製造業趨勢
- 運輸和倉儲業的GDP
- 出口趨勢
- 進口趨勢
- 燃油價格
- 卡車運輸營運成本
- 卡車運輸車隊規模(按類型)
- 主要卡車供應商
- 物流績效
- 透過交通方式分享
- 海運船隊運力
- 班輪運輸連接
- 停靠港口和演出
- 貨運費率趨勢
- 貨物噸位趨勢
- 基礎設施
- 法規結構(公路和鐵路)
- 印尼
- 馬來西亞
- 泰國
- 越南
- 法規結構(海事和航空)
- 印尼
- 馬來西亞
- 泰國
- 越南
- 價值鍊和通路分析
- 市場促進因素
- B2C電子商務的爆炸性成長推動了CEP交易量的成長
- 製造業外商直接投資向東協轉移促進了區域內貿易。
- 公共部門在多模態走廊和港口方面投入大規模
- 擴大關稅減讓貿易協定(RCEP、擴大ACFTA)
- 引入東協單一窗口,實現24小時內完成海關清關
- 電動車和電池供應鏈的興起催生了對專業物流的需求。
- 市場限制
- 新興亞洲市場基礎設施和物流成本佔GDP的比例:16-25%
- 沿海運輸和許可規則擾亂了區域貨運網路
- 地緣政治關稅導致物流流重組(例如,美國提案在2025年提高關稅)
- 設備失衡-ISO罐和貨櫃供應過剩(改道後)
- 市場創新
- 波特五力分析
- 新進入者的威脅
- 買方的議價能力
- 供應商的議價能力
- 替代品的威脅
- 競爭對手之間的競爭
第5章 市場規模與成長預測
- 終端用戶產業
- 農業、漁業、林業
- 建造
- 製造業
- 石油天然氣、採礦和採石
- 批發和零售
- 其他
- 物流職能
- 快遞小包裹(CEP)
- 按目的地類型
- 國內的
- 國際的
- 按目的地類型
- 貨運代理
- 透過交通工具
- 航空
- 海路和內河航道
- 其他
- 透過交通工具
- 貨物運輸
- 透過交通工具
- 航空
- 管道
- 鐵路
- 路
- 海路和內河航道
- 透過交通工具
- 倉儲
- 透過溫度控制
- 非溫控型
- 溫度控制
- 透過溫度控制
- 其他服務
- 快遞小包裹(CEP)
- 國家
- 印尼
- 馬來西亞
- 泰國
- 越南
- 其他東南亞國協
第6章 競爭情勢
- 市場集中度
- 關鍵策略舉措
- 市佔率分析
- 公司簡介
- AP Moller-Maersk
- CJ Logistics Corporation
- DHL Group
- DP World
- DSV A/S(Including DB Schenker)
- FedEx
- Flash Express
- Kuehne+Nagel
- LOGISTEED, Ltd.(Including Alps Logistics)
- Ninja Van(Including Ninja Express)
- NYK(Nippon Yusen Kaisha)Line
- Pos Indonesia(Persero)
- POS Malaysia Bhd
- PT Jalur Nugraha Ekakurir(JNE Express)
- SCGJWD Group
- SF Express(KEX-SF)
- SPX Express
- Tiong Nam Logistics Holdings Bhd
- United Parcel Service of America, Inc.(UPS)
- YCH Group
第7章 市場機會與未來展望
The ASEAN freight and logistics market is expected to grow from USD 288.24 billion in 2025 to USD 305.13 billion in 2026 and is forecast to reach USD 405.68 billion by 2031 at 5.86% CAGR over 2026-2031.
Robust e-commerce uptake, the relocation of manufacturing supply chains, tariff-cutting trade pacts, and large-scale public infrastructure programs collectively sustain growth momentum across all ten member states. The ASEAN freight and logistics market benefits from the June 2025 entry into force of the Philippines' RCEP accession, which removes duties on 90% of traded goods and accelerates customs clearances. Intensifying competition prompts mergers and acquisitions that aim to build dense regional networks, while new service niches such as EV-battery logistics and pharmaceutical cold chains diversify revenue streams. Nonetheless, high logistics-to-GDP ratios in emerging markets, cabotage restrictions, and equipment imbalances add cost pressures that operators must offset through technology and modal optimization.
ASEAN Freight And Logistics Market Trends and Insights
Explosive B2C E-commerce Growth Fuelling CEP Volumes
E-commerce platforms such as TikTok, Shopee, and Lazada have driven parcel counts that outpace traditional freight volumes across major ASEAN cities. Platform-controlled carrier allocation increases network density and bargaining power over third-party providers, prompting operators to invest in automated sortation hubs that handle millions of parcels daily. Unicorn Flash Express scaled to 1,300 branches and now processes up to 2 million parcels per day across six countries, illustrating the operational intensity required for rapid deliveries. Distributed fulfillment, urban consolidation hubs, and micro-mobility fleets improve last-mile efficiency, although inconsistent local regulations on electric bikes and trikes slow uniform deployment. Real-time tracking and predictive delivery windows become standard customer expectations, reinforcing the digitization push among CEP players.
Manufacturing FDI Shift into ASEAN Boosting Intra-Regional Trade
Foreign investors relocating production from Northeast Asia to ASEAN spur sustained demand for cross-border freight, component shuttle services, and specialized warehousing. Electronics and electrical goods dominate capital inflows, with Malaysia exporting integrated circuits worth MYR 34.1 billion (USD 7.2 billion) in September 2024. Vietnam's industrial parks link directly to upgraded deep-sea ports and double-track rail corridors, enabling seamless hinterland connectivity. Just-in-time manufacturing raises the premium on schedule reliability and customs efficiency, reinforcing the value proposition of end-to-end logistics integrators. Rules of origin under RCEP further localize supply chains by incentivizing regional content, stimulating intra-ASEAN freight volumes.
Infrastructure Gaps and 16-25% Logistics-Cost-to-GDP in Emerging AMS
Road quality deficits, limited inland waterways, and power shortages prolong transit times and inflate handling expenses, particularly in landlocked and archipelagic sub-regions. The International Energy Agency notes that oil demand from Southeast Asian freight transport rose from 1.3 million to 2.8 million barrels per day between 2000 and 2024, magnifying congestion and emissions. Cold-chain rollout is hampered by grid unreliability and high diesel generator costs, constraining pharmaceutical and fresh-produce logistics. Without accelerated infrastructure finance, emerging members risk lower service quality and missed participation in high-value supply chains.
Other drivers and restraints analyzed in the detailed report include:
- Large-Scale Public-Sector Spend on Multimodal Corridors and Ports
- Expansion of Tariff-Cutting Trade Pacts (RCEP, ACFTA Upgrades)
- Cabotage and Licensing Rules Fragmenting Regional Freight Networks
For complete list of drivers and restraints, kindly check the Table Of Contents.
Segment Analysis
Manufacturing generated 31.74% of 2025 revenue, underscoring the region's vital role in global electronics, automotive, and textile supply chains. Flexible warehousing footprints and time-definite freight services enable just-in-sequence deliveries to factories clustered in Vietnam, Thailand, and Malaysia. The ASEAN freight and logistics market share for wholesale and retail trade will rise quickly on a 6.31% CAGR (2026-2031) as modern grocery, fashion, and general merchandise segments expand omnichannel distribution networks. Agriculture and forestry continue to contribute sizable tonnage via bulk and reefer cargoes, while construction drives heavy-lift activity linked to public infrastructure builds.
Retail supply chains embrace automation to align inventory with volatile online demand. Dark stores and micro-fulfillment sites multiply in dense urban pockets, shrinking delivery promises to sub-two-hour windows. Manufacturers, meanwhile, diversify plant footprints to hedge geopolitical risk, prompting service providers to secure bonded trucking corridors and regional distribution centers that synchronize component flows. Temperature-controlled warehousing gains traction across food and pharma verticals, and capacity utilization in Malaysia's Tasco cold storage network averaged 85-90% in 2024.
The freight transport segment supplied 60.12% of 2025 revenue, reflecting its core role in bulk commodity and container movements. CEP, however, grows fastest at 6.78% CAGR (2026-2031), fueled by urban e-commerce that demands high-frequency parcel drops and transparent tracking. The ASEAN freight and logistics market size for CEP operators improves through automation investments such as 3-million-parcel-per-day sorters in Bangkok and Jakarta. Freight forwarding maintains revenue stability by orchestrating customs brokerage and multi-leg shipping for expanding intra-regional trade. Warehousing benefits from inventory localization, including chilled storage nodes that support growing online grocery traffic. Small but lucrative specialized services-project cargo, reverse logistics, and aftermarket parts-round out the portfolio and insulate operators from cyclicality.
Digital transformation is no longer optional. Leading CEP firms integrate route-optimization algorithms and handheld scanners that push real-time status updates to merchants and buyers. Temperature-controlled CEP consignments escalate as online pharmacies and meal-kit services scale in metro areas. Operators with regional footprints can consolidate cross-border parcels and leverage the ASEAN Single Window to shorten cycle times, creating stickier customer relationships. Fragmented regulations on electric delivery bikes present an operational wildcard that companies navigate by piloting compliant fleets city by city.
The ASEAN Freight and Logistics Market Report is Segmented by End User Industry (Agriculture, Fishing, and Forestry, Construction, Manufacturing, and More), by Logistics Function (Courier, Express, and Parcel (CEP), Freight Forwarding, Freight Transport, Warehousing and Storage, and Other Services), and by Country (Indonesia, Malaysia, Thailand, Vietnam, and Rest of ASEAN). The Market Forecasts are Provided in Terms of Value (USD).
List of Companies Covered in this Report:
- A.P. Moller - Maersk
- CJ Logistics Corporation
- DHL Group
- DP World
- DSV A/S (Including DB Schenker)
- FedEx
- Flash Express
- Kuehne+Nagel
- LOGISTEED, Ltd. (Including Alps Logistics)
- Ninja Van (Including Ninja Express)
- NYK (Nippon Yusen Kaisha) Line
- Pos Indonesia (Persero)
- POS Malaysia Bhd
- PT Jalur Nugraha Ekakurir (JNE Express)
- SCGJWD Group
- SF Express (KEX-SF)
- SPX Express
- Tiong Nam Logistics Holdings Bhd
- United Parcel Service of America, Inc. (UPS)
- YCH Group
Additional Benefits:
- The market estimate (ME) sheet in Excel format
- 3 months of analyst support
TABLE OF CONTENTS
1 Introduction
- 1.1 Study Assumptions and Market Definition
- 1.2 Scope of the Study
2 Research Methodology
3 Executive Summary
4 Market Landscape
- 4.1 Market Overview
- 4.2 Demographics
- 4.3 GDP Distribution by Economic Activity
- 4.4 GDP Growth by Economic Activity
- 4.5 Inflation
- 4.6 Economic Performance and Profile
- 4.6.1 Trends in E-Commerce Industry
- 4.6.2 Trends in Manufacturing Industry
- 4.7 Transport and Storage Sector GDP
- 4.8 Export Trends
- 4.9 Import Trends
- 4.10 Fuel Price
- 4.11 Trucking Operational Costs
- 4.12 Trucking Fleet Size by Type
- 4.13 Major Truck Suppliers
- 4.14 Logistics Performance
- 4.15 Modal Share
- 4.16 Maritime Fleet Load Carrying Capacity
- 4.17 Liner Shipping Connectivity
- 4.18 Port Calls and Performance
- 4.19 Freight Pricing Trends
- 4.20 Freight Tonnage Trends
- 4.21 Infrastructure
- 4.22 Regulatory Framework (Road and Rail)
- 4.22.1 Indonesia
- 4.22.2 Malaysia
- 4.22.3 Thailand
- 4.22.4 Vietnam
- 4.23 Regulatory Framework (Sea and Air)
- 4.23.1 Indonesia
- 4.23.2 Malaysia
- 4.23.3 Thailand
- 4.23.4 Vietnam
- 4.24 Value Chain and Distribution Channel Analysis
- 4.25 Market Drivers
- 4.25.1 Explosive B2C E-Commerce Growth Fuelling CEP Volumes
- 4.25.2 Manufacturing FDI Shift into ASEAN Boosting Intra-Regional Trade
- 4.25.3 Large-Scale Public-Sector Spend on Multimodal Corridors and Ports
- 4.25.4 Expansion of Tariff-Cutting Trade Pacts (RCEP, ACFTA Upgrades)
- 4.25.5 Roll-Out of ASEAN Single Window Enabling <24-Hour Customs
- 4.25.6 Emergence of EV-Battery Supply Chains Needing Specialised Logistics
- 4.26 Market Restraints
- 4.26.1 Infrastructure Gaps and 16-25 % Logistics-Cost-To-GDP in Emerging AMS
- 4.26.2 Cabotage and Licensing Rules Fragmenting Regional Freight Networks
- 4.26.3 Geopolitical Tariffs (E.G., Proposed 2025 US Hikes) Redirecting Flows
- 4.26.4 Equipment Imbalance-ISO-Tank and Container Oversupply Post-Rerouting
- 4.27 Technology Innovations in the Market
- 4.28 Porter's Five Forces Analysis
- 4.28.1 Threat of New Entrants
- 4.28.2 Bargaining Power of Buyers
- 4.28.3 Bargaining Power of Suppliers
- 4.28.4 Threat of Substitutes
- 4.28.5 Competitive Rivalry
5 Market Size and Growth Forecasts (Value, USD)
- 5.1 End User Industry
- 5.1.1 Agriculture, Fishing, and Forestry
- 5.1.2 Construction
- 5.1.3 Manufacturing
- 5.1.4 Oil and Gas, Mining and Quarrying
- 5.1.5 Wholesale and Retail Trade
- 5.1.6 Others
- 5.2 Logistics Function
- 5.2.1 Courier, Express, and Parcel (CEP)
- 5.2.1.1 By Destination Type
- 5.2.1.1.1 Domestic
- 5.2.1.1.2 International
- 5.2.1.1 By Destination Type
- 5.2.2 Freight Forwarding
- 5.2.2.1 By Mode of Transport
- 5.2.2.1.1 Air
- 5.2.2.1.2 Sea and Inland Waterways
- 5.2.2.1.3 Others
- 5.2.2.1 By Mode of Transport
- 5.2.3 Freight Transport
- 5.2.3.1 By Mode of Transport
- 5.2.3.1.1 Air
- 5.2.3.1.2 Pipelines
- 5.2.3.1.3 Rail
- 5.2.3.1.4 Road
- 5.2.3.1.5 Sea and Inland Waterways
- 5.2.3.1 By Mode of Transport
- 5.2.4 Warehousing and Storage
- 5.2.4.1 By Temperature Control
- 5.2.4.1.1 Non-Temperature Controlled
- 5.2.4.1.2 Temperature Controlled
- 5.2.4.1 By Temperature Control
- 5.2.5 Other Services
- 5.2.1 Courier, Express, and Parcel (CEP)
- 5.3 Country
- 5.3.1 Indonesia
- 5.3.2 Malaysia
- 5.3.3 Thailand
- 5.3.4 Vietnam
- 5.3.5 Rest of ASEAN
6 Competitive Landscape
- 6.1 Market Concentration
- 6.2 Key Strategic Moves
- 6.3 Market Share Analysis
- 6.4 Company Profiles (Includes Global Level Overview, Market Level Overview, Core Segments, Financials as Available, Strategic Information, Market Rank/Share for Key Companies, Products and Services, and Recent Developments)
- 6.4.1 A.P. Moller - Maersk
- 6.4.2 CJ Logistics Corporation
- 6.4.3 DHL Group
- 6.4.4 DP World
- 6.4.5 DSV A/S (Including DB Schenker)
- 6.4.6 FedEx
- 6.4.7 Flash Express
- 6.4.8 Kuehne+Nagel
- 6.4.9 LOGISTEED, Ltd. (Including Alps Logistics)
- 6.4.10 Ninja Van (Including Ninja Express)
- 6.4.11 NYK (Nippon Yusen Kaisha) Line
- 6.4.12 Pos Indonesia (Persero)
- 6.4.13 POS Malaysia Bhd
- 6.4.14 PT Jalur Nugraha Ekakurir (JNE Express)
- 6.4.15 SCGJWD Group
- 6.4.16 SF Express (KEX-SF)
- 6.4.17 SPX Express
- 6.4.18 Tiong Nam Logistics Holdings Bhd
- 6.4.19 United Parcel Service of America, Inc. (UPS)
- 6.4.20 YCH Group
7 Market Opportunities and Future Outlook
- 7.1 White-Space and Unmet-Need Assessment
 2026年全球貨車市場報告2026年全球貨運和物流市場報告2026年全球零碳運輸市場報告
 貨運及物流市場分析及預測(至2035年):依類型、產品類型、服務、技術、組件、應用、流程、最終使用者及運輸方式分類
 2026-2030年全球貨物審核與支付市場
 中東歐貨運與物流:市場佔有率分析、產業趨勢與統計、成長預測(2026-2031 年)亞太地區貨運與物流:市場佔有率分析、產業趨勢與統計、成長預測(2026-2031)南美貨運與物流:市場佔有率分析、產業趨勢與統計、成長預測(2026-2031)泰國貨運與物流:市場佔有率分析、產業趨勢與統計、成長預測(2026-2031)美國貨運和物流:市場佔有率分析、行業趨勢和統計數據、成長預測(2026-2031 年)