


 |
市場調查報告書
商品編碼
1940764
美國公路貨運:市場佔有率分析、行業趨勢和統計數據、成長預測(2026-2031 年)United States Road Freight Transport - Market Share Analysis, Industry Trends & Statistics, Growth Forecasts (2026 - 2031) |
||||||
※ 本網頁內容可能與最新版本有所差異。詳細情況請與我們聯繫。
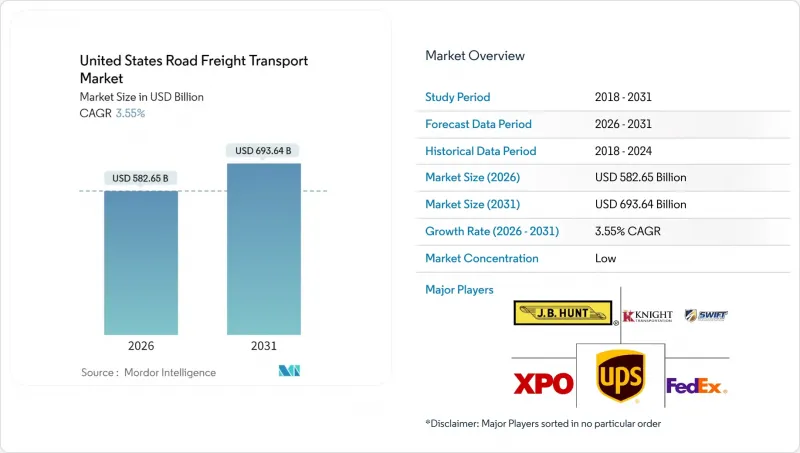
美國公路貨運市場預計到 2026 年價值 5,826.5 億美元,高於 2025 年的 5,626.8 億美元,預計到 2031 年將達到 6,936.4 億美元。
預計從 2026 年到 2031 年,其複合年成長率將達到 3.55%。
這種成長勢頭反映了貨運生態系統的韌性,該生態系統能夠吸收聯邦基礎設施投資、製造業回流計劃以及電子商務履約的擴張。由《基礎設施投資與就業法案》(IIJA)資助的專用卡車車道正在縮短尖峰時段的運輸時間並提高運力利用率。 《晶片/科學法案》下的供應鏈重組正引導半導體和生命科學產品的運輸轉向高速公路,而零擔貨運領域的動態定價API正在釋放潛在運力。數位化貨運匹配平台目前在總負載容量中所佔比例越來越高,從而縮短了取貨時間並平抑了季節性貨運波動。普遍存在的司機短缺和柴油價格波動仍然是結構性阻力,推動了自動化試點項目、替代燃料牽引車的引入以及戰略性車隊擴張。
美國公路貨運市場趨勢與洞察
電子商務履約需求推動了緊急運輸能力的發展
為了滿足當日達和隔日達的標準,承運商正努力提高周轉率並減少空駛里程。亞馬遜計劃在2024年在美國營運超過1000個履約中心,這將集中貨運量,並將空駛里程減少高達12%。加急貨運已佔卡車運輸收入的23%,反映出零售商越來越重視速度而非單純的成本指標。快遞包裹運輸正在推動樞紐輻射式運輸模式的整合、更先進的車輛遠端資訊處理系統以及拖車共用網路的擴展。已將包裹遞送API整合到其卡車運輸網路中的承運商,其取貨速度更快,準時率更高。
供應鏈正回歸日本,加速國內貨運量成長。
價值 520 億美元的《晶片與科學法案》獎勵計畫位置了半導體製造廠落腳亞利桑那州、俄亥俄州和德克薩斯州。英特爾和台積電的計劃需要運輸重達 180 噸以上的微影術設備,這推動了對大型平板拖車的需求。生命科學產業的回流也帶動了溫控貨物運輸量的成長。隨著更多國內灌裝包裝設施的建設,藥品負載容量正以每年 15% 的速度成長。擁有符合良好分銷規範 (GDP) 標準的認證低溫運輸拖車和即時溫度遙測系統的專業運輸公司從中受益匪淺。
監管壓力加劇司機短缺危機
美國預計到2024年將面臨7.8萬名長途貨運司機的缺口,而加州的AB-5就業分類法案已使州內貨運能力下降了15%。紐約州和伊利諾伊州提案的類似法案可能會導致全國範圍內的遵循成本上升。聯邦汽車運輸安全管理局(FMCSA)的藥物和酒精檢測資訊交換中心規則將在2024年前取消2.3%的商業駕駛執照(CDL)持有者的資格,進一步縮小勞動市場。貨運公司正透過合約獎金、加速培訓計畫以及旨在減少疲勞駕駛的駕駛輔助技術來應對這項挑戰。
細分市場分析
到2025年,製造業將占美國公路貨運市場收入的31.12%,這主要得益於產業回流以及汽車、機械和電子產品生產的持續成長。隨著資本密集型製造和組裝廠對進出物流的同步需求,美國製造業相關的公路貨運市場規模預計將穩定擴大。受電子商務庫存補貨週期的推動,批發和零售業將成為成長最快的產業,2026年至2031年的複合年成長率將達到4.05%。零擔貨運(LTL)網路在都市區擁有密集的貨運站,正從優先考慮靈活交貨期限的全通路零售商中獲得成長。建築材料運輸正受益於IIJA資助計劃的蓬勃發展,這些項目需要運輸大量的骨材和超大型混凝土梁。農業領域的季節性高峰仍在持續,收穫季節期間拖車供應往往受限,導致現貨貨運價格上漲。
運輸部關於營運時間的規定使長途農業和製造業路線的規劃變得複雜,但支援遠端資訊處理技術的路線規劃軟體正在減少停機時間。可再生能源組件和資料中心設備正在成為新興的細分市場。由於對牽引車輛和專用篷布的要求,運輸風力發電機葉片和超大規模伺服器機架的平板貨車獲得了豐厚的利潤。對於那些有著嚴格承運商選擇通訊協定的托運人來說,電子記錄設備 (ELD) 合規性和遵守安全評分標準仍然至關重要。
至2025年,受製造業回流導致跨洋運輸依賴性降低的影響,美國國內貨運將占美國公路貨運市場的62.10%。然而,預計2026年至2031年間,主要通往墨西哥的國際航線將以4.10%的複合年成長率成長。由於美墨加協定(USMCA)原產地規則的優惠待遇,北向汽車零件和南向機械設備的運輸量正在增加。同時,美國海關與邊防安全(CBP)的ACE系統實施後,商業過境時間縮短了四分之一。國際承運商必須僱用雙語司機,持有C-TPAT認證,並以披索結算回程傳輸費率。雖然國內航運受益於港口堵塞的緩解,但一些規避雙重檢查和沿海運輸規定的專業過境運營商正在獲取更高的利潤。
我們的國際運輸業務高度依賴保險條款以符合墨西哥的責任框架,並已在高風險地區部署了基於衛星的拖車追蹤系統,以防止貨物被盜。隨著蒙特雷和奇瓦瓦的位置工廠從美國進口原料並出口高價值耐用消費品,預計該業務板塊將進一步成長。
整車運輸 (FTL) 約佔所有貨運量的 80%,但預計 2026 年至 2031 年,零擔運輸 (LTL) 的複合年成長率將達到 3.98%,超過美國公路貨運市場整體到 2031 年的成長速度。基於密度的托盤費率、小批量貨物的湧入以及退貨處理等因素正在支撐零擔貨運終端的吞吐量。對機器人轉運中心、手持掃描器和即時 API 報價的投資正在縮短貨物停留時間並提高每節拖車的周轉率。整車運輸仍然主導著需要滿載拖車的重工業路線,但司機短缺和柴油成本的不確定性正在推高專線運輸合約的費率。
零擔貨運公司正在某些州試行使用雙44英尺拖車掛鉤,以提高在法定總重量限制內的裝載效率;而整車貨運車隊則在擴大甩掛運輸方案,以應對停車位短缺問題,並確保因電子記錄設備(ELD)強制規定而需要的休息時間。由於終端風險,零擔貨運公司根據《美國聯邦法規》第49篇第387條規定的最低保險要求仍然很高,這促使貨運公司進行貨物損壞風險降低分析。
其他福利:
- Excel格式的市場預測(ME)表
- 分析師支持(3個月)
目錄
第1章 引言
- 研究假設和市場定義
- 調查範圍
第2章調查方法
第3章執行摘要
第4章 市場情勢
- 市場概覽
- 按經濟活動分類的GDP分配
- 按經濟活動分類的GDP成長
- 經濟表現和公司概況
- 電子商務產業的趨勢
- 製造業趨勢
- 運輸和倉儲業的GDP
- 物流績效
- 道路長度
- 出口趨勢
- 進口趨勢
- 燃油價格趨勢
- 卡車運輸營運成本
- 卡車運輸車隊規模(按類型)
- 主要卡車供應商
- 公路貨運量趨勢
- 公路貨運費率趨勢
- 透過交通方式分享
- 通貨膨脹
- 法律規範
- 價值鍊和通路分析
- 市場促進因素
- 電子商務履約需求對緊急貨車運力帶來壓力。
- 美國重要供應鏈(半導體、生命科學)回流
- 大幅增加聯邦政府對公路基礎設施的撥款(IIJA 2021-2026)
- 大型承運商大規模部署零擔貨運 (LTL) 動態定價 API
- 各州主導的自動駕駛汽車和專用卡車收費車道試點計畫(德克薩斯州、喬治亞),以及釋放專用貨運能力
- Start-Ups整合推動了數位仲介的滲透,預計到2030年,數位經紀商將佔貨運量的25%以上。
- 市場限制
- 嚴重的駕駛短缺和AB-5式的州立法
- 柴油價格波動導致貨運價格波動
- 卡車OEM生產瓶頸(半導體和柴油引擎廢氣處理液感知器)
- 城市走廊橋樑和隧道通行費通膨率超過消費者物價指數
- 市場創新
- 波特五力分析
- 新進入者的威脅
- 買方的議價能力
- 供應商的議價能力
- 替代品的威脅
- 競爭對手之間的競爭
第5章 市場規模與成長預測
- 終端用戶產業
- 農業、漁業、林業
- 建造
- 製造業
- 石油天然氣、採礦和採石
- 批發和零售
- 其他
- 目的地
- 國內的
- 國際的
- 卡車裝載規範
- FTL
- LTL
- 容器化
- 容器化
- 非容器化
- 距離
- 長途
- 短程交通
- 貨物形式
- 液體貨物
- 固態貨物
- 溫度控制
- 非溫控型
- 溫度控制
第6章 競爭情勢
- 市場集中度
- 關鍵策略舉措
- 市佔率分析
- 公司簡介
- ArcBest
- Averitt Express, Inc.
- CH Robinson
- DHL Group
- Estes Express Lines
- FedEx
- JB Hunt Transport, Inc.
- Knight-Swift Transportation
- Landstar System, Inc.
- Old Dominion Freight Line
- Penske Logistics, Inc.
- R+L Carriers
- Ryder System, Inc.
- Saia Inc.
- Schneider National, Inc.
- Southeastern Freight Lines
- Total Quality Logistics, LLC
- United Parcel Service of America, Inc.(UPS)
- Werner Enterprises, Inc.
- XPO, Inc.
第7章 市場機會與未來展望
The United States road freight transport market size in 2026 is estimated at USD 582.65 billion, growing from 2025 value of USD 562.68 billion with 2031 projections showing USD 693.64 billion, growing at 3.55% CAGR over 2026-2031.
This momentum reflects a resilient freight ecosystem that absorbs federal infrastructure spending, manufacturing reshoring programs, and e-commerce fulfillment growth. Dedicated truck lanes funded by the Infrastructure Investment and Jobs Act (IIJA) are shortening peak-hour transit times and improving equipment utilization. Supply chain realignment under the CHIPS and Science Act is pulling semiconductor and life-sciences traffic onto highways, while dynamic-pricing APIs in the LTL segment are unlocking latent capacity. Digital freight matching platforms now steer a rising share of total loads, tightening pickup windows and smoothing seasonal rate swings. Widespread driver shortages and diesel price volatility remain structural headwinds that encourage automation pilots, alternative-fuel tractors, and strategic fleet expansions.
United States Road Freight Transport Market Trends and Insights
E-Commerce Fulfillment Pressure Drives Expedited Capacity Demand
Same-day and next-day delivery benchmarks push carriers to cycle assets faster and slash empty miles. Amazon exceeded 1,000 U.S. fulfillment centers in 2024, concentrating outbound volumes and trimming metro-area dead-head by up to 12%. Expedited freight already supplies 23% of trucking revenue, mirroring retailers' preference for speed over purely cost-based routing. High-velocity parcel traffic fuels hub-and-spoke densification, fleet telematics upgrades, and trailer pool expansions. Carriers that integrate parcel APIs with truckload networks report narrower pickup windows and improved on-time performance metrics.
Supply Chain Reshoring Accelerates Domestic Freight Volumes
The CHIPS and Science Act's USD 52 billion incentive package is anchoring semiconductor fabs in Arizona, Ohio, and Texas. Intel and TSMC projects require heavy-haul moves for lithography tools that can weigh more than 180 metric tons, creating premium flatbed demand. Life-sciences reshoring lifts temperature-controlled freight; pharmaceutical truck-loadings are rising 15% annually as domestic fill-finish sites multiply. Specialized carriers benefit from validated cold-chain trailers and real-time temperature telemetry that meets Good Distribution Practice standards.
Driver Shortage Crisis Intensifies Amid Regulatory Pressures
The United States needed 78,000 additional long-haul drivers in 2024, and California's AB-5 employment classification amplified capacity removal by 15% within the state. Proposed copycat legislation in New York and Illinois risks spreading compliance expenses nationwide. FMCSA drug-and-alcohol clearinghouse rules disqualified 2.3% of CDL holders during 2024, further tightening the labor pool. Carriers respond with signing bonuses, accelerated training programs, and driver-assistance technologies aimed at lowering fatigue.
Other drivers and restraints analyzed in the detailed report include:
- Federal Infrastructure Investment Expands Freight Corridor Capacity
- Dynamic-Pricing APIs Transform the LTL Market Structure
- Diesel Price Volatility Creates Operational Margin Pressure
For complete list of drivers and restraints, kindly check the Table Of Contents.
Segment Analysis
Manufacturing generated 31.12% of United States road freight transport market revenue in 2025, underpinned by industrial reshoring and sustained automotive, machinery, and electronics output. The United States road freight transport market size tied to manufacturing will expand steadily as capital-intensive fabs and assembly plants require synchronized inbound and outbound logistics. Wholesale and retail trade, buoyed by e-commerce restocking cycles, is the fastest-growing vertical, advancing at a 4.05% CAGR between 2026-2031. LTL networks with dense metro terminals capture incremental volumes from omnichannel retailers who value flexible pickup cutoffs. Construction freight rides the IIJA-funded project wave, demanding bulk aggregate hauls and oversize concrete girder moves. Agriculture continues to show seasonal peaks; harvest-period spikes often strain trailer availability and push spot rates upward.
Department of Transportation hours-of-service rules create planning complexity for long agricultural and manufacturing lanes, but telematics-driven routing software mitigates downtime. Renewable-energy components and data-center equipment are emerging sub-segments. Flatbed carriers hauling wind-turbine blades and hyperscale server racks earn premium yields thanks to escort-vehicle requirements and specialized tarping. Compliance with electronic logging devices (ELDs) and safety-score benchmarks remains essential for shippers that enforce strict carrier-selection protocols.
Domestic freight held 62.10% of the United States road freight transport market in 2025 as reshoring limited trans-oceanic reliance. Nonetheless, international lanes mainly Mexico-bound are projected to grow 4.10% CAGR between 2026 and 2031. USMCA rule-of-origin incentives boost northbound auto-parts and southbound machinery volumes, while the Customs and Border Protection's ACE system has cut commercial border crossing times by one-quarter. Carriers operating international lanes must maintain bilingual drivers, maintain C-TPAT certifications, and manage peso-denominated back-haul pricing. Domestic traffic gains from reduced port congestion, but cross-border specialists command margin premiums for navigating dual inspections and cabotage constraints.
International operations also rely heavily on insurance riders to meet Mexican liability frameworks and deploy satellite-based trailer tracking to deter cargo theft in high-risk corridors. The segment is gaining additional traction as near-shoring plants in Monterrey and Chihuahua import U.S. raw materials and export high-value consumer durables.
Full-truck-load commands nearly four-fifths of all shipments, but the 3.98% CAGR between 2026-2031 anticipated in LTL outpaces the broader United States road freight transport market through 2031. Density-priced pallets, parcel spillover, and returns processing feed LTL terminal volumes. Investments in robotic cross-docks, handheld scanners, and real-time API quoting compress dwell times and raise turns per trailer. FTL still dominates heavy industrial lanes that demand whole-trailer cubic capacity; however, driver scarcity and uncertain diesel costs are raising dedicated-contract rates.
LTL carriers are piloting double-44-ft pup combinations in select states to elevate cubic efficiency within statutory gross-vehicle-weight ceilings. FTL fleets, by contrast, are expanding drop-and-hook programs to mitigate parking shortages and ELD-mandated rest breaks. Insurance minimums under 49 CFR 387 remain higher for LTL given terminal exposure, encouraging carriers to pursue cargo-damage-reduction analytics.
The United States Road Freight Transport Market Report is Segmented by End User Industry (Manufacturing, and More), Destination (Domestic and International), Truckload Specification (FTL and LTL), Distance (Long Haul and Short Haul), Goods Configuration (Fluid Goods and Solid Goods), Temperature Control (Non-Temperature and Temperature Controlled), and by Containerization. The Market Forecasts are Provided in Terms of Value (USD).
List of Companies Covered in this Report:
- ArcBest
- Averitt Express, Inc.
- C.H. Robinson
- DHL Group
- Estes Express Lines
- FedEx
- J.B. Hunt Transport, Inc.
- Knight-Swift Transportation
- Landstar System, Inc.
- Old Dominion Freight Line
- Penske Logistics, Inc.
- R+L Carriers
- Ryder System, Inc.
- Saia Inc.
- Schneider National, Inc.
- Southeastern Freight Lines
- Total Quality Logistics, LLC
- United Parcel Service of America, Inc. (UPS)
- Werner Enterprises, Inc.
- XPO, Inc.
Additional Benefits:
- The market estimate (ME) sheet in Excel format
- 3 months of analyst support
TABLE OF CONTENTS
1 Introduction
- 1.1 Study Assumptions and Market Definition
- 1.2 Scope of the Study
2 Research Methodology
3 Executive Summary
4 Market Landscape
- 4.1 Market Overview
- 4.2 GDP Distribution by Economic Activity
- 4.3 GDP Growth by Economic Activity
- 4.4 Economic Performance and Profile
- 4.4.1 Trends in E-Commerce Industry
- 4.4.2 Trends in Manufacturing Industry
- 4.5 Transport and Storage Sector GDP
- 4.6 Logistics Performance
- 4.7 Length of Roads
- 4.8 Export Trends
- 4.9 Import Trends
- 4.10 Fuel Pricing Trends
- 4.11 Trucking Operational Costs
- 4.12 Trucking Fleet Size by Type
- 4.13 Major Truck Suppliers
- 4.14 Road Freight Tonnage Trends
- 4.15 Road Freight Pricing Trends
- 4.16 Modal Share
- 4.17 Inflation
- 4.18 Regulatory Framework
- 4.19 Value Chain and Distribution Channel Analysis
- 4.20 Market Drivers
- 4.20.1 E-Commerce Fulfillment Pressure on Expedited Trucking Capacity
- 4.20.2 On-Shoring of Critical United States Supply Chains (Semiconductors, Life-Sciences)
- 4.20.3 Federal Funding Surge for Highway Infrastructure (IIJA 2021-2026)
- 4.20.4 Wide-Scale Roll-Out of LTL Dynamic-Pricing APIs by Top Carriers
- 4.20.5 State-Led Autonomous and Truck-Only Toll-Lane Pilots (TX, GA) Opening Dedicated Freight Capacity
- 4.20.6 Start-Up Consolidation Driving Digital-Broker Penetration >25 % Loads By 2030
- 4.21 Market Restraints
- 4.21.1 Acute Long-Haul Driver Shortage and AB-5 Style State Legislation
- 4.21.2 Freight-Rate Volatility Linked to Diesel Price Swings
- 4.21.3 Truck OEM Production Bottlenecks (Semiconductor and DEF Sensors)
- 4.21.4 Bridge-and-Tunnel Toll Inflation Outpacing CPI in Urban Corridors
- 4.22 Technology Innovations in the Market
- 4.23 Porter's Five Forces Analysis
- 4.23.1 Threat of New Entrants
- 4.23.2 Bargaining Power of Buyers
- 4.23.3 Bargaining Power of Suppliers
- 4.23.4 Threat of Substitutes
- 4.23.5 Competitive Rivalry
5 Market Size and Growth Forecasts (Value, USD)
- 5.1 End User Industry
- 5.1.1 Agriculture, Fishing, and Forestry
- 5.1.2 Construction
- 5.1.3 Manufacturing
- 5.1.4 Oil and Gas, Mining and Quarrying
- 5.1.5 Wholesale and Retail Trade
- 5.1.6 Others
- 5.2 Destination
- 5.2.1 Domestic
- 5.2.2 International
- 5.3 Truckload Specification
- 5.3.1 Full-Truck-Load (FTL)
- 5.3.2 Less than-Truck-Load (LTL)
- 5.4 Containerization
- 5.4.1 Containerized
- 5.4.2 Non-Containerized
- 5.5 Distance
- 5.5.1 Long Haul
- 5.5.2 Short Haul
- 5.6 Goods Configuration
- 5.6.1 Fluid Goods
- 5.6.2 Solid Goods
- 5.7 Temperature Control
- 5.7.1 Non-Temperature Controlled
- 5.7.2 Temperature Controlled
6 Competitive Landscape
- 6.1 Market Concentration
- 6.2 Key Strategic Moves
- 6.3 Market Share Analysis
- 6.4 Company Profiles (Includes Global Level Overview, Market Level Overview, Core Segments, Financials as Available, Strategic Information, Market Rank/Share for Key Companies, Products and Services, and Recent Developments)
- 6.4.1 ArcBest
- 6.4.2 Averitt Express, Inc.
- 6.4.3 C.H. Robinson
- 6.4.4 DHL Group
- 6.4.5 Estes Express Lines
- 6.4.6 FedEx
- 6.4.7 J.B. Hunt Transport, Inc.
- 6.4.8 Knight-Swift Transportation
- 6.4.9 Landstar System, Inc.
- 6.4.10 Old Dominion Freight Line
- 6.4.11 Penske Logistics, Inc.
- 6.4.12 R+L Carriers
- 6.4.13 Ryder System, Inc.
- 6.4.14 Saia Inc.
- 6.4.15 Schneider National, Inc.
- 6.4.16 Southeastern Freight Lines
- 6.4.17 Total Quality Logistics, LLC
- 6.4.18 United Parcel Service of America, Inc. (UPS)
- 6.4.19 Werner Enterprises, Inc.
- 6.4.20 XPO, Inc.
7 Market Opportunities and Future Outlook
- 7.1 White-space and Unmet-Need Assessment
 西班牙公路貨運:市場佔有率分析、行業趨勢和統計數據以及成長預測(2026-2031 年)英國公路貨運:市場佔有率分析、產業趨勢與統計、成長預測(2026-2031 年)印尼陸上貨運:市場佔有率分析、行業趨勢和統計數據以及成長預測(2026-2031 年)
 2026-2030年全球公路貨運市場
 2026年全球公路貨運市場報告
 陸上貨運市場:2026-2032年全球市場預測(依服務類型、貨物類型、所有權、車輛類型及最終用途分類)
 公路貨運服務市場機會、成長促進因素、產業趨勢分析、預測(2026-2035年)越南公路貨運:市場佔有率分析、產業趨勢與統計、成長預測(2026-2031)日本公路貨運:市佔率分析、產業趨勢與統計及成長預測(2026-2031)北美公路貨運市場:市場佔有率分析、產業趨勢與統計、成長預測(2026-2031 年)