


 |
市場調查報告書
商品編碼
1911419
北美公路貨運市場:市場佔有率分析、產業趨勢與統計、成長預測(2026-2031 年)North America Road Freight Transport - Market Share Analysis, Industry Trends & Statistics, Growth Forecasts (2026 - 2031) |
||||||
※ 本網頁內容可能與最新版本有所差異。詳細情況請與我們聯繫。
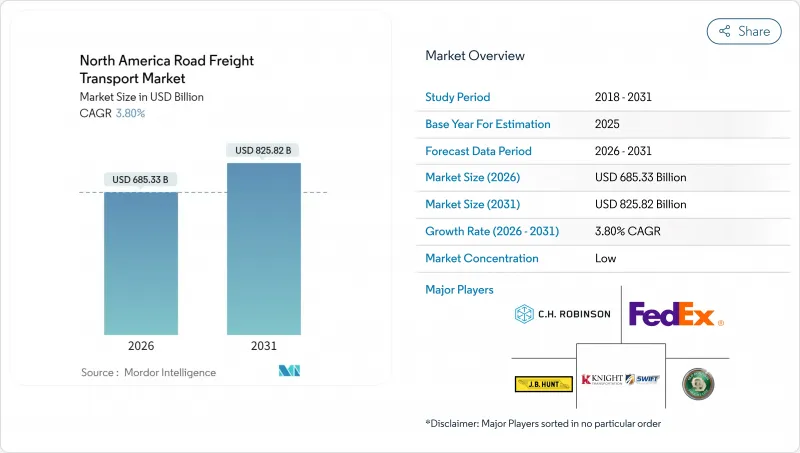
2025年北美公路貨運市場價值為6,602.4億美元,預計從2026年的6,853.3億美元成長到2031年的8,258.2億美元,在預測期(2026-2031年)內複合年成長率為3.80%。
北美公路貨運市場正處於穩定發展階段,這得益於該行業的韌性、政策支持的基礎設施建設以及不斷成長的電子商務量。墨西哥近岸外包、美國墨加協定(USMCA)推動的跨境貿易以及庫存多元化正在重塑貨運路線,使其更加短途、頻繁。儘管托運人出於成本效益考量仍然選擇整車運輸(FTL)服務,但零擔運輸(LTL)服務的結構性成長反映出對靈活運力和貨物整合的需求日益成長。隨著尋求規模的承運商不斷收購專業營運商,競爭依然激烈。同時,自動駕駛試點計畫和零排放動力系統的廣泛應用預示著技術主導的生產力飛躍。監管趨勢(特別是溫室氣體排放限制和修訂後的軸荷規定)帶來了小規模承運商難以承受的合規成本,推動了產業整合。
北美公路貨運市場趨勢與洞察
電子商務最後一公里配送快速成長
隨著零售商將庫存轉移到更靠近消費者的地方以履行當日送達的承諾,預計到2024年,短途貨運(100英里以內)將以每年20%的速度成長。大都會圈集中的需求加劇了貨運站的運力緊張,並導致能夠遵守都市區法規的司機競爭日益激烈。食品和藥品電商通路的蓬勃發展推動了對溫控貨物的投資,承運商也不斷擴大其冷藏車隊規模。路線最佳化演算法優先考慮停靠點密度而非距離,這使得擁有都市區經驗的本地營運商更具優勢。有關送貨時間限制和零排放區的地方性法規正在促使電池電動貨車在最後一公里配送路線上得到早期應用。
政府基礎設施獎勵策略
《基礎設施投資與就業法案》撥款1,100億美元用於公路和橋樑建設,透過增加車道和消除瓶頸路段來縮短運輸時間並提高卡車運輸效率。明尼蘇達州已確定22處貨運瓶頸路段,導致卡車每天每英里延誤超過4小時。伊利諾伊州、德克薩斯州和加利福尼亞州也面臨類似的挑戰。 2025年至2028年間完工的計劃將提升I-35和I-95等主要公路的通行能力,但施工繞行可能會暫時減少交通流量。路面品質的提升將降低維護成本並延長拖車的使用壽命,從而降低整體擁有成本。
駕駛人和工資上漲
預計到2024年,由於退休人數超過新頒發的商業駕駛執照數量,卡車司機將出現8萬個缺口。卡車運輸公司調查顯示,兩位數的薪資成長、留任獎金和柔軟性的工作時間是成本上升的主要促進因素。由於額外的認證要求,危險品、超大件貨物和冷藏運輸等特殊領域面臨更嚴重的司機短缺問題。生活方式因素和駕駛時間限制阻礙了年輕司機進入該行業,迫使卡車運輸公司投資於駕駛輔助技術和拖車分離系統,以減少等待時間。
細分市場分析
預計到2025年,製造業將佔據北美公路貨運市場最大佔有率,佔總收入的31.68%。金屬、機械和汽車零件將推動出口貨運量的成長,而進口原料的流動則維持著穩定的貨車週轉率。由於全通路庫存策略和微型倉配中心的擴張,北美公路貨運市場中與批發和零售業相關的市場規模預計將以更快的速度成長。
批發商和零售商更頻繁地補充庫存,每次補貨量也更小,這推動了零擔貨運(LTL)的成長,預計2026年至2031年,零擔貨運的複合年成長率將達到4.33%。建築材料運輸受益於獎勵策略的計劃,而石油和天然氣貨物的運輸則隨大宗商品週期波動。可再生能源組件(渦輪葉片、太陽能板、電池組)屬於「其他」類別,需要專用設備和護送車輛。
到2025年,國內貨運收入將佔總收入的62.30%,這反映了公司在美國和加拿大境內廣泛的分銷網路。儘管經濟情勢波動,北美公路貨運市場仍保持強勁,穩定的區域合約保障了車輛的運轉率,並降低了海關風險。
國際貨運雖然規模較小,但預計從2026年到2031年將以4.38%的複合年成長率成長。美國墨加協定(USMCA)縮短了邊境停留時間並實現了單據採購的標準化,這吸引了托運人對單一發票跨境解決方案的興趣。主要承運商正透過提供雙語客戶服務和保稅倉庫來把握這一成長機會。
到2025年,整車運輸(FTL)收入將佔總收入的79.35%,凸顯了托運人對快速門到門配送和減少裝卸環節的重視。季節性需求高峰,尤其是在零售假日高峰期,將導致整車運輸運力緊張,從而為更高的現貨價格和與柴油價格相關的合約重新談判創造機會。雖然零擔運輸(LTL)在北美公路貨運市場中所佔佔有率較小,但預計其成長速度將更快,2026年至2031年的複合年成長率(CAGR)將達到4.18%,這主要得益於電子商務退貨以及中小企業的運輸需求。
區域零擔運輸專家正大力投資於轉運中心自動化和API連接,以便為客戶提供即時價格比較和貨物追蹤服務。 Knight-Swift的目標是在2026年前建立覆蓋全國的零擔運輸網路,這表明資產密集的傳統貨運公司正在向更均衡的收入來源轉型。
其他福利:
- Excel格式的市場預測(ME)表
- 3個月的分析師支持
目錄
第1章 引言
- 研究假設和市場定義
- 調查範圍
第2章調查方法
第3章執行摘要
第4章 市場情勢
- 市場概覽
- 按經濟活動分類的GDP分配
- 按經濟活動分類的GDP成長
- 經濟表現及概況
- 電子商務產業的趨勢
- 製造業趨勢
- 運輸和倉儲業GDP
- 物流績效
- 道路長度
- 出口趨勢
- 進口趨勢
- 燃油價格趨勢
- 卡車運輸營運成本
- 卡車運輸車隊規模(按類型)
- 主要卡車供應商
- 公路貨運量趨勢
- 公路貨運價格趨勢
- 按交通方式分享
- 通貨膨脹
- 法律規範
- 價值鍊和通路分析
- 市場促進因素
- 電子商務最後一公里配送快速成長
- 政府基礎設施獎勵策略
- 美墨加協定將增加跨境貨運量
- 墨西哥近岸外包
- 引進自動駕駛卡車走廊
- 氫燃料卡車普及勢頭強勁
- 市場限制
- 駕駛人和工資上漲壓力
- 燃油價格波動
- 更嚴格的軸荷/溫室氣體 (GHG) 法規
- 模式轉換
- 市場創新
- 波特五力分析
- 新進入者的威脅
- 買方的議價能力
- 供應商的議價能力
- 替代品的威脅
- 競爭對手之間的競爭
第5章 市場規模與成長預測
- 終端用戶產業
- 農業、林業和漁業
- 建造
- 製造業
- 石油天然氣、採礦和採石
- 批發和零售
- 其他
- 目的地
- 國內的
- 國際的
- 卡車裝載規範
- 整車運輸 (FTL)
- 低於100%的運費(零擔運輸)
- 貨櫃運輸
- 貨櫃運輸
- 非貨櫃運輸
- 距離
- 長途
- 短程交通
- 貨物類型
- 液體貨物
- 固體貨物
- 溫度控制
- 非溫控型
- 溫度控制
- 國家
- 美國
- 加拿大
- 墨西哥
- 北美其他地區
第6章 競爭情勢
- 市場集中度
- 關鍵策略舉措
- 市佔率分析
- 公司簡介
- AP Moller-Maersk
- ArcBest
- CH Robinson
- Canada Cartage
- CMA CGM Group(including CEVA Logistics)
- DHL Group
- DSV A/S(De Sammensluttede Vognmaend af Air and Sea)
- FedEx
- JB Hunt Transport, Inc.
- Knight-Swift Transportation Holdings Inc.
- Landstar System Inc.
- Old Dominion Freight Line
- Penske
- Ryder System, Inc.
- Schneider National, Inc.
- Transportes Marva
- Traxion
- United Parcel Service of America, Inc.(UPS)
- Werner Enterprises Inc.
- XPO, Inc.
第7章 市場機會與未來展望
The North America road freight transport market was valued at USD 660.24 billion in 2025 and estimated to grow from USD 685.33 billion in 2026 to reach USD 825.82 billion by 2031, at a CAGR of 3.80% during the forecast period (2026-2031).
This trajectory positions the North America road freight transport market as a steady growth environment sustained by industrial resilience, policy-backed infrastructure upgrades, and rising e-commerce volumes. Nearshoring to Mexico, USMCA-enabled cross-border trade, and inventory decentralization are reshaping freight flows toward shorter-haul, higher-frequency lanes. Shippers continue to favor Full-Truck-Load (FTL) services for cost efficiency, yet the structural rise of Less-than-Truck-Load (LTL) reflects mounting demand for flexible capacity and shipment consolidation. Competitive intensity remains elevated as scale-oriented carriers acquire specialized providers, while widespread adoption of autonomous driving pilots and zero-emission powertrains signals a technology-driven productivity leap. Regulatory trends-most notably greenhouse-gas limits and axle-weight revisions-create compliance costs that smaller fleets struggle to absorb, reinforcing consolidation momentum.
North America Road Freight Transport Market Trends and Insights
E-commerce Last-Mile Boom
Short-haul freight under 100 miles grew 20% annually through 2024 as retailers moved stock closer to consumers to meet same-day delivery promises. Dense metropolitan demand strains terminal capacity and intensifies competition for drivers who can navigate urban restrictions. Grocery and pharmaceutical e-commerce channels push temperature-controlled freight investment, prompting carriers to expand refrigerated fleets. Route-optimization algorithms focus on stop density rather than distance, advantaging regional specialists with urban expertise. Local ordinances on delivery time windows and zero-emission zones accelerate early adoption of battery-electric vans for final-mile routes.
Government Infrastructure Stimulus
The Infrastructure Investment and Jobs Act earmarks USD 110 billion for highways and bridges, unlocking lane additions and bottleneck removals that lower transit times and boost truck productivity. Minnesota identified 22 freight chokepoints causing over 4 hours of daily truck delay per mile; similar pain points exist in Illinois, Texas, and California. Project completions scheduled between 2025-2028 will expand capacity on key corridors such as I-35 and I-95, although construction detours may temporarily suppress throughput. Better pavement quality reduces maintenance expenses, extending tractor-trailer life cycles and lowering the total cost of ownership.
Driver Shortage and Wage Inflation
Retirements outpace new Commercial Driver's License entrants, leaving fleets short by an estimated 80,000 drivers in 2024. Carrier surveys cite double-digit pay increases, retention bonuses, and schedule flexibility as key cost escalators. Specialized segments-hazmat, oversized, and refrigerated-face steeper shortages due to extra certification hurdles. Lifestyle factors and hours-of-service limits deter younger recruits, compelling fleets to invest in driver-assist technology and drop-trailer programs to reduce waiting times.
Other drivers and restraints analyzed in the detailed report include:
- USMCA-Fueled Cross-Border Volumes
- Near-Shoring Shift to Mexico
- Fuel-Price Volatility
For complete list of drivers and restraints, kindly check the Table Of Contents.
Segment Analysis
Manufacturing generated 31.68% of 2025 revenue, the highest slice of the North America road freight transport market share. Metals, machinery, and automotive parts dominate outbound lane volume, while inbound raw-material flows maintain steady trailer turns. The North America road freight transport market size tied to wholesale and retail trade is poised for faster expansion, aided by omnichannel inventory strategies and micro-fulfillment buildouts.
Wholesale and retail traders reorder stock more frequently and in smaller quantities, fueling LTL shipment growth, and are projected to grow at a CAGR of 4.33% between 2026-2031. Construction freight absorbs a meaningful uplift from stimulus-funded projects, whereas oil-and-gas cargoes fluctuate with commodity cycles. Renewable-energy components-turbine blades, solar panels, and battery packs-enter the "Others" bucket and demand specialized equipment and escorts.
Domestic hauls represented 62.30% of 2025 turnover, reflecting extensive intra-U.S. and intra-Canada distribution networks. Stable regional contracts anchor fleet utilization and limit customs risk, keeping the North America road freight transport market robust during economic swings.
International volumes, while smaller, eye a 4.38% CAGR between 2026-2031. Lower border dwell times and harmonized documentation under USMCA attract shippers seeking one-bill cross-border solutions. Large carriers embed bilingual customer service and bonded warehousing to capitalize on the upswing.
FTL held 79.35% of 2025 sales, underscoring shippers' preference for door-to-door speed and limited handling. Seasonality spikes, notably retail holiday peaks, tighten FTL capacity, pushing spot rates upward and opening openings for contract renegotiations tethered to diesel indexation. The North America road freight transport market size captured by LTL is smaller but should grow faster with a CAGR of 4.18% between 2026-2031 on the back of e-commerce returns and SME shipping needs.
Regional LTL specialists invest heavily in cross-dock automation and API connectivity so customers can rate-shop and track in real time. Knight-Swift's ambition to build a national LTL grid by 2026 illustrates how asset-heavy truckload incumbents diversify toward more balanced revenue streams.
The North America Road Freight Transport Market Report is Segmented by End User Industry (Manufacturing, and More), Destination (Domestic and International), Truckload Specification (FTL and LTL), Distance (Long and Short Haul), Goods Configuration (Fluid Goods and Solid Goods), Temperature Control (Non-Temperature and Temperature Controlled), Containerization, and Country. The Market Forecasts are Provided in Terms of Value (USD).
List of Companies Covered in this Report:
- A.P. Moller - Maersk
- ArcBest
- C.H. Robinson
- Canada Cartage
- CMA CGM Group (including CEVA Logistics)
- DHL Group
- DSV A/S (De Sammensluttede Vognmaend af Air and Sea)
- FedEx
- J.B. Hunt Transport, Inc.
- Knight-Swift Transportation Holdings Inc.
- Landstar System Inc.
- Old Dominion Freight Line
- Penske
- Ryder System, Inc.
- Schneider National, Inc.
- Transportes Marva
- Traxion
- United Parcel Service of America, Inc. (UPS)
- Werner Enterprises Inc.
- XPO, Inc.
Additional Benefits:
- The market estimate (ME) sheet in Excel format
- 3 months of analyst support
TABLE OF CONTENTS
1 Introduction
- 1.1 Study Assumptions and Market Definition
- 1.2 Scope of the Study
2 Research Methodology
3 Executive Summary
4 Market Landscape
- 4.1 Market Overview
- 4.2 GDP Distribution by Economic Activity
- 4.3 GDP Growth by Economic Activity
- 4.4 Economic Performance and Profile
- 4.4.1 Trends in E-Commerce Industry
- 4.4.2 Trends in Manufacturing Industry
- 4.5 Transport and Storage Sector GDP
- 4.6 Logistics Performance
- 4.7 Length of Roads
- 4.8 Export Trends
- 4.9 Import Trends
- 4.10 Fuel Pricing Trends
- 4.11 Trucking Operational Costs
- 4.12 Trucking Fleet Size by Type
- 4.13 Major Truck Suppliers
- 4.14 Road Freight Tonnage Trends
- 4.15 Road Freight Pricing Trends
- 4.16 Modal Share
- 4.17 Inflation
- 4.18 Regulatory Framework
- 4.19 Value Chain and Distribution Channel Analysis
- 4.20 Market Drivers
- 4.20.1 E-Commerce Last-Mile Boom
- 4.20.2 Government Infrastructure Stimulus
- 4.20.3 USMCA-Fuelled Cross-Border Volumes
- 4.20.4 Near-Shoring Shift to Mexico
- 4.20.5 Autonomous-Truck Corridor Roll-Outs
- 4.20.6 Hydrogen-Truck Adoption Momentum
- 4.21 Market Restraints
- 4.21.1 Driver Shortage and Wage Inflation
- 4.21.2 Fuel-Price Volatility
- 4.21.3 Stricter Axle-Weight/GHG Rules
- 4.21.4 Modal Shift to Rail-Intermodal
- 4.22 Technology Innovations in the Market
- 4.23 Porter's Five Forces Analysis
- 4.23.1 Threat of New Entrants
- 4.23.2 Bargaining Power of Buyers
- 4.23.3 Bargaining Power of Suppliers
- 4.23.4 Threat of Substitutes
- 4.23.5 Competitive Rivalry
5 Market Size and Growth Forecasts (Value, USD)
- 5.1 End User Industry
- 5.1.1 Agriculture, Fishing, and Forestry
- 5.1.2 Construction
- 5.1.3 Manufacturing
- 5.1.4 Oil and Gas, Mining and Quarrying
- 5.1.5 Wholesale and Retail Trade
- 5.1.6 Others
- 5.2 Destination
- 5.2.1 Domestic
- 5.2.2 International
- 5.3 Truckload Specification
- 5.3.1 Full-Truck-Load (FTL)
- 5.3.2 Less than-Truck-Load (LTL)
- 5.4 Containerization
- 5.4.1 Containerized
- 5.4.2 Non-Containerized
- 5.5 Distance
- 5.5.1 Long Haul
- 5.5.2 Short Haul
- 5.6 Goods Configuration
- 5.6.1 Fluid Goods
- 5.6.2 Solid Goods
- 5.7 Temperature Control
- 5.7.1 Non-Temperature Controlled
- 5.7.2 Temperature Controlled
- 5.8 Country
- 5.8.1 United States
- 5.8.2 Canada
- 5.8.3 Mexico
- 5.8.4 Rest of North America
6 Competitive Landscape
- 6.1 Market Concentration
- 6.2 Key Strategic Moves
- 6.3 Market Share Analysis
- 6.4 Company Profiles (Includes Global Level Overview, Market Level Overview, Core Segments, Financials as Available, Strategic Information, Market Rank/Share for Key Companies, Products and Services, and Recent Developments)
- 6.4.1 A.P. Moller - Maersk
- 6.4.2 ArcBest
- 6.4.3 C.H. Robinson
- 6.4.4 Canada Cartage
- 6.4.5 CMA CGM Group (including CEVA Logistics)
- 6.4.6 DHL Group
- 6.4.7 DSV A/S (De Sammensluttede Vognmaend af Air and Sea)
- 6.4.8 FedEx
- 6.4.9 J.B. Hunt Transport, Inc.
- 6.4.10 Knight-Swift Transportation Holdings Inc.
- 6.4.11 Landstar System Inc.
- 6.4.12 Old Dominion Freight Line
- 6.4.13 Penske
- 6.4.14 Ryder System, Inc.
- 6.4.15 Schneider National, Inc.
- 6.4.16 Transportes Marva
- 6.4.17 Traxion
- 6.4.18 United Parcel Service of America, Inc. (UPS)
- 6.4.19 Werner Enterprises Inc.
- 6.4.20 XPO, Inc.
7 Market Opportunities and Future Outlook
- 7.1 White-Space and Unmet-Need Assessment
 西班牙公路貨運:市場佔有率分析、行業趨勢和統計數據以及成長預測(2026-2031 年)英國公路貨運:市場佔有率分析、產業趨勢與統計、成長預測(2026-2031 年)印尼陸上貨運:市場佔有率分析、行業趨勢和統計數據以及成長預測(2026-2031 年)
 2026-2030年全球公路貨運市場
 2026年全球公路貨運市場報告
 陸上貨運市場:2026-2032年全球市場預測(依服務類型、貨物類型、所有權、車輛類型及最終用途分類)
 公路貨運服務市場機會、成長促進因素、產業趨勢分析、預測(2026-2035年)美國公路貨運:市場佔有率分析、行業趨勢和統計數據、成長預測(2026-2031 年)越南公路貨運:市場佔有率分析、產業趨勢與統計、成長預測(2026-2031)日本公路貨運:市佔率分析、產業趨勢與統計及成長預測(2026-2031)